The human transporter associated with antigen processing: molecular models to describe peptide binding competent states - PubMed (original) (raw)
The human transporter associated with antigen processing: molecular models to describe peptide binding competent states
Valentina Corradi et al. J Biol Chem. 2012.
Abstract
The human transporter associated with antigen processing (TAP) is a member of the ATP binding cassette (ABC) transporter superfamily. TAP plays an essential role in the antigen presentation pathway by translocating cytosolic peptides derived from proteasomal degradation into the endoplasmic reticulum lumen. Here, the peptides are loaded into major histocompatibility class I molecules to be in turn exposed at the cell surface for recognition by T-cells. TAP is a heterodimer formed by the association of two half-transporters, TAP1 and TAP2, with a typical ABC transporter core that consists of two nucleotide binding domains and two transmembrane domains. Despite the availability of biological data, a full understanding of the mechanism of action of TAP is limited by the absence of experimental structures of the full-length transporter. Here, we present homology models of TAP built on the crystal structures of P-glycoprotein, ABCB10, and Sav1866. The models represent the transporter in inward- and outward-facing conformations that could represent initial and final states of the transport cycle, respectively. We described conserved regions in the endoplasmic reticulum-facing loops with a role in the opening and closing of the cavity. We also identified conserved π-stacking interactions in the cytosolic part of the transmembrane domains that could explain the experimental data available for TAP1-Phe-265. Electrostatic potential calculations gave structural insights into the role of residues involved in peptide binding, such as TAP1-Val-288, TAP2-Cys-213, TAP2-Met-218. Moreover, these calculations identified additional residues potentially involved in peptide binding, in turn verified with replica exchange simulations performed on a peptide bound to the inward-facing models.
Figures
FIGURE 1.
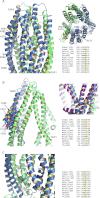
Homology models of TAP-based on P-gp (inward-facing conformation) (A), ABCB10 (inward-facing conformation) (B), and Sav1866 (outward-facing conformation) (C) crystal structures. TAP1 and TAP2 are shown in green and blue ribbons, respectively. The region of the transporter embedded in the membrane (TMD core) is highlighted in gray. Short loops connect the transmembrane helices on the ER lumen (ELs), whereas longer CLs are projected into the cytosol followed by the NBDs. Peptides bind to TAP in the inward-facing cavity, whereas ATP molecules bind to the NBDs, inducing NBD dimerization. The energy derived from ATP hydrolysis is used by TAP to translocate the peptides from the cytosol to the ER. D–F, shown is a top view of the models based on P-gp (D), ABCB10 (E), and Sav1866 (F). The conserved residues of the ELs described under “Conserved Regions in ELs” are shown as spheres. In particular, TAP1-Asp-213 (orange spheres) interacts with TAP1-Ser-440 (blue spheres), and TAP2-Asp-178 (orange spheres) makes contacts with TAP2-Thr-405 (blue spheres) in the inward-facing conformation models (D and E). As a consequence of the cavity opening toward the ER lumen in the outward-facing conformation (F), these interactions are not longer retrieved. The interactions between the conserved residues of the EL2 (TAP1-Met-320, -Ser-324, -Leu-327, -Thr-328, light green spheres; TAP2-Met-285, -Ser-289, -Leu-292, -Thr-293, light blue spheres) are preserved in both the inward-facing and the outward-facing conformations (D–F). For homology modeling, the sequence alignments (
supplemental Figs. S1 and S2
) were generated with MAFFT (35), and the models were built with MODELLER (39). The TAP models were then inserted into a lipid bilayer as described under “Experimental Procedures.”
FIGURE 2.
π-Stacking interactions between TM2 and TM5. A–C, TAP1 and TAP2 are shown in green and blue ribbons, respectively. Side view of the TMDs of the TAP models based on P-gp (P-gp-based model 2, A), ABCB10 (B), and Sav1866. TAP1-Phe-265 and TAP2-Tyr-355 involved in the π-stacking interactions in the outward-facing conformation are represented as green and blue spheres, respectively. The NBDs are not shown for clarity. D, the multiple sequence alignment shows that in all the transporters taken into account in this study, the positions corresponding to TAP1-Phe-265 and TAP2-Tyr-355 are conserved. The sequences were retrieved from the UniprotKB data base, and their accession codes are as follow: human TAP1, Q03518; human TAP2, Q03519; Rattus, TAP1, P36370; Rattus, TAP2, P36372; Sav1866, Q99T13 (PDB access code 2HYD); MsbA Vibrio cholerae (Msba_VibCh), Q9KQW9 (PDB access code 3B5X); MsbA E. coli (MsbA_EColi), P60752 (PDB access code 3B5W); MsbA S. typhimurium (MsbA SalTy), P63359 (PDB access code 3B60); mouse P-glycoprotein (Mouse_Pgp1 and Mouse_Pgp2), P21447 (PDB access code 3G5U); ABCB10, Q9NRK6 (PDB access code 2YL4), T. maritima 0287 (TM_0287), Q9WYC3; T. maritima 0288 (TM_0288), Q9WYC4.
FIGURE 3.
Residues affecting peptide binding and transport. A–C, TAP1 and TAP2 are shown in green and blue ribbons, respectively. A, shown is a side view of the TMDs of the TAP homology model based on ABCB10 (left) and Sav1866 (right) crystal structure to highlight the position occupied by TAP2-Ala-374, represented as spheres. The surrounding TAP2 arginine residues (Arg-368, Arg-369, Arg-373, Arg-380, Arg-381) are in blue sticks. The multiple sequence alignment for the residues surrounding TAP2-Ala-374 is also provided. B, shown is a view of TAP2-Cys-213 in the TAP homology model based on ABCB10. Cys-213 is shown as orange spheres, whereas the neighborhood residues are in blue spheres. The multiple alignment of the region surrounding Cys-213 is also shown. On the right is the superimposition of the homology model of TAP based on Sav1866 and the MsbA crystal structure (PDB access code 3B60) shown in purple ribbons. TAP2-Cys-213 and MsbA-Cys88 are shown as spheres. C, shown is a close-up view of Val-288 of TAP1 in the TAP homology models based on ABCB10. The multiple alignment highlights the residues surrounding Val-288 (Gly-282, Ile-284, Ser-286, Arg-287, and Asp-291) and conserved among other transporters.
FIGURE 4.
Electrostatic potential of the TAP inward-facing models. A, shown is an isosurface representation of the electrostatic potential of the TAP P-gp-based model 2 (left panel), P-gp-based model 1 (center panel), and ABCB10-based model (right panel). The isosurface has been clipped to highlight the different properties of the lower side of the inward-facing cavity. The isovalue is set to −2 k_B_T/e for the negative potential (red) and +2 k_B_T/e for the positive one (blue). TAP1 and TAP2 are shown in green and blue ribbon, respectively. B and C, per each model (P-gp based model 2 and model 1 on the left and center panel, respectively; ABCB10-based model on the right panel), the electrostatic potential of the inward-facing cavity was mapped on the solvent-accessible surface. Shown are the negatively (B) and positively (C) charged side of the cavity. The isovalue was set to −4 k_B_T/e for the negative potential (red) and +4 k_B_T/e for the positive potential (blue). Pockets 1, 2, 3, and 4 described in the text under “Peptide Binding” are highlighted. Electrostatic potential calculations were performed with APBS software (52) using a dielectric constant of 2, 10, and 80 for membrane, protein, and water, respectively. The solvent-accessible surface was calculated based on the last frame of the 5-ns equilibration run, whereas the electrostatic potential was averaged during the last 2.5 ns, as described under “Experimental Procedures.”
FIGURE 5.
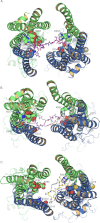
Replica exchange simulations and peptide binding. A–C, TAP1 and TAP2 are shown in green and blue ribbons, respectively. Shown is the top view of the nonamer RRYQKSTEL bound to the inward-facing models of TAP, as it results from the replica exchange simulations and clustering analysis. The peptide conformation corresponding to the cluster with the highest population is shown as sticks for the TAP model based on ABCB10 (A), the P-gp-based model 2 (B), and the P-gp-based model 1 (C). The residues involved in the binding of the N and the C terminus of the peptide are shown as spheres. Only polar hydrogen atoms are shown. For clarity, the loops facing the ER lumen are not shown. Replica exchange simulations were performed in implicit solvent using 44 temperatures ranging from 298.2 to 433.0 K.
Similar articles
- Analyses of conformational states of the transporter associated with antigen processing (TAP) protein in a native cellular membrane environment.
Geng J, Sivaramakrishnan S, Raghavan M. Geng J, et al. J Biol Chem. 2013 Dec 27;288(52):37039-47. doi: 10.1074/jbc.M113.504696. Epub 2013 Nov 6. J Biol Chem. 2013. PMID: 24196954 Free PMC article. - Function of the transport complex TAP in cellular immune recognition.
Abele R, Tampé R. Abele R, et al. Biochim Biophys Acta. 1999 Dec 6;1461(2):405-19. doi: 10.1016/s0005-2736(99)00171-6. Biochim Biophys Acta. 1999. PMID: 10581370 Review. - ABC transporters in adaptive immunity.
Seyffer F, Tampé R. Seyffer F, et al. Biochim Biophys Acta. 2015 Mar;1850(3):449-60. doi: 10.1016/j.bbagen.2014.05.022. Epub 2014 Jun 9. Biochim Biophys Acta. 2015. PMID: 24923865 Review.
Cited by
- The lysosomal transporter TAPL has a dual role as peptide translocator and phosphatidylserine floppase.
Park JG, Kim S, Jang E, Choi SH, Han H, Ju S, Kim JW, Min DS, Jin MS. Park JG, et al. Nat Commun. 2022 Oct 4;13(1):5851. doi: 10.1038/s41467-022-33593-2. Nat Commun. 2022. PMID: 36195619 Free PMC article. - A mechanism of viral immune evasion revealed by cryo-EM analysis of the TAP transporter.
Oldham ML, Hite RK, Steffen AM, Damko E, Li Z, Walz T, Chen J. Oldham ML, et al. Nature. 2016 Jan 28;529(7587):537-40. doi: 10.1038/nature16506. Epub 2016 Jan 20. Nature. 2016. PMID: 26789246 Free PMC article. - Analyses of conformational states of the transporter associated with antigen processing (TAP) protein in a native cellular membrane environment.
Geng J, Sivaramakrishnan S, Raghavan M. Geng J, et al. J Biol Chem. 2013 Dec 27;288(52):37039-47. doi: 10.1074/jbc.M113.504696. Epub 2013 Nov 6. J Biol Chem. 2013. PMID: 24196954 Free PMC article. - Exploiting the exploiter: a viral inhibitor stabilizes TAP for cryo-EM.
Luteijn RD, Wiertz EJ. Luteijn RD, et al. Nat Struct Mol Biol. 2016 Feb;23(2):95-7. doi: 10.1038/nsmb.3168. Nat Struct Mol Biol. 2016. PMID: 26840895 No abstract available. - Three tapasin docking sites in TAP cooperate to facilitate transporter stabilization and heterodimerization.
Leonhardt RM, Abrahimi P, Mitchell SM, Cresswell P. Leonhardt RM, et al. J Immunol. 2014 Mar 1;192(5):2480-94. doi: 10.4049/jimmunol.1302637. Epub 2014 Feb 5. J Immunol. 2014. PMID: 24501197 Free PMC article.
References
- Dean M., Rzhetsky A., Allikmets R. (2001) The human ATP-binding cassette (ABC) transporter superfamily. Genome Res. 11, 1156–1166 - PubMed
- Dean M. (2005) The genetics of ATP binding cassette transporters. Methods Enzymol. 400, 409–429 - PubMed
- Higgins C. F. (1992) ABC transporters. From microorganisms to man. Annu. Rev. Cell Biol. 8, 67–113 - PubMed
- Procko E., O'Mara M. L., Bennett W. F., Tieleman D. P., Gaudet R. (2009) The mechanism of ABC transporters. General lessons from structural and functional studies of an antigenic peptide transporter. FASEB J. 23, 1287–1302 - PubMed
Publication types
MeSH terms
Substances
LinkOut - more resources
Full Text Sources
Research Materials
Miscellaneous


