Mechanotransduction and YAP-dependent matrix remodelling is required for the generation and maintenance of cancer-associated fibroblasts - PubMed (original) (raw)
Mechanotransduction and YAP-dependent matrix remodelling is required for the generation and maintenance of cancer-associated fibroblasts
Fernando Calvo et al. Nat Cell Biol. 2013 Jun.
Abstract
To learn more about cancer-associated fibroblasts (CAFs), we have isolated fibroblasts from different stages of breast cancer progression and analysed their function and gene expression. These analyses reveal that activation of the YAP transcription factor is a signature feature of CAFs. YAP function is required for CAFs to promote matrix stiffening, cancer cell invasion and angiogenesis. Remodelling of the ECM and promotion of cancer cell invasion requires the actomyosin cytoskeleton. YAP regulates the expression of several cytoskeletal regulators, including ANLN and DIAPH3, and controls the protein levels of MYL9 (also known as MLC2). Matrix stiffening further enhances YAP activation, thus establishing a feed-forward self-reinforcing loop that helps to maintain the CAF phenotype. Actomyosin contractility and Src function are required for YAP activation by stiff matrices. Further, transient ROCK inhibition is able to disrupt the feed-forward loop, leading to a long-lasting reversion of the CAF phenotype.
Figures
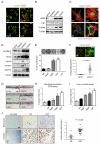
Figure 1. Isolation and characterisation of fibroblasts from different disease stages
A) Vimentin (green) and αSMA (red) staining of fibroblasts isolated from different disease stages. Scale bar, 50μm. B) Western blots of αSMA, fibronectin, and S100A4 levels in fibroblasts isolated from different disease stages. C) Upper panels show F-actin (red), paxillin (green) and DAPI (magenta) staining in NFs and CAFs. Scale bar, 10μm. Lower panels show F-actin (red), fibronectin (green) and DAPI (blue) staining in NFs and CAFs. D) Western blots showing pS19-MLC2/MYL9, MLC2/MYL9, MYH9, MYH10, and DIAPH1 levels in fibroblasts. E) Images show gel contraction by fibroblasts and 4T1 breast cancer cells. Histogram shows mean of ± s.e.m. (n = number of gels (NF, 15; HpAF 13; AdAF, 15; CAF, 35; 4T1, 4), assessed over multiple experiments (NF, 5; HpAF, 5; AdAF, 5; CAF, 10; 4T1, 2). F) Images show F-actin staining of fibroblasts and collagen second harmonic signal. Scale bar, 50μm. Histogram shows elastic modulus of matrices remodelled by NFs or CAFs. Each data point represents a single measurement, n=100 measurements in total. Line and error bars indicate mean ± s.d. G) Representative images showing the invasion of 4T1 cells cultured in the presence of different fibroblasts. Scale bar, 50μm. H) Quantification of 4T1 invasion into matrices previously remodelled by different fibroblasts. Bars represent mean ± s.e.m. _n_= organotypic assays (-, 4; NF, 18; HpAF, 5; AdAF, 6; CAF, 24), assessed over multiple experiments (-, 2; NF, 4; HpAF, 2; AdAF, 2; CAF, 6). I) Quantification of 4T1 invasion when co-cultured with different fibroblasts. Bars represent mean ± s.e.m. _n_= organotypic assays (-, 29; NF, 53; HpAF, 19; AdAF, 22; CAF, 56), assessed over multiple experiments (-, 6; NF, 12; HpAF, 4; AdAF, 5; CAF, 12). J) Images show endomucin and vimentin staining of matrix plugs with or without different fibroblasts injected sub-cut in mice. Scale bar, 50μm. Graph shows quantification of endomucin staining relative to fibroblast number (vimentin staining). Each data point represents a different plug (NF, n=7; CAF, n=16). * P < 0.05; ** P < 0.01; *** P < 0.001 - unpaired t-test.
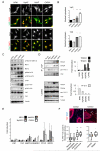
Figure 2. YAP is activated in cancer-associated fibroblasts
A) Images show YAP or TAZ localisation (greyscale and green) and DAPI (red) in different fibroblasts. Scale bar, 20μm. B) Quantification of nuclear relative to cytosolic fluorescent intensity of YAP or TAZ. Bars represent mean ± s.e.m for YAP data (NF, n=4 experiments with ~15 20× fields of view analysed in each experiment; HpAF, n=3; AdAF, n=3; CAF, n=4). Bars represent mean for TAZ data (one representative experiment shown, with ~15 20× fields of view analysed. Additional data in Table S2 (Statistics Source Data). C) Western blots show active MST1/2 (judged by pT183/T180), MST1 and MST2 levels, active LATS1/2 (judged by pS909 and pT1079), LATS1/2 levels, pS127-YAP, pY357-YAP, TAZ levels, YAP levels and tubulin loading control in NF#1, HpAF#1, AdAF#1, and CAF#1. D) Western blots show immune-precipitation of TEAD1, TEAD4 and 14-3-3 with YAP in NF#1, HpAF#1, AdAF#1, and CAF#1. Graphs represent quantification of the blots showing the amount of TEAD1, TEAD4 and 14-3-3 proteins bound to YAP in HpAF#1, AdAF#1, and CAF#1 relative to NF#1. E) qRT-PCR analysis of gene expression in different fibroblasts. Data from three independent experiments performed in triplicate (normalized to_Gapdh_). Bars represent mean ± s.e.m. of the average fold induction compared to NF#1 in each experiment. F) Images show YAP localisation (red) and DAPI (blue) staining of normal and cancerous mammary tissue. White arrows indicate nuclear accumulation of YAP in the stroma. Scale bar, 20μm. Charts show quantification from different stages of MMTV-PyMT disease and from different tumoural regions on carcinomas. n= number of images analysed (normal, n=27; hyperplasia, n=41; adenoma, n=20; carcinoma, n=18; central, n=19; margin, n=18). Images were taken from multiple tissue samples (normal, 3; hyperplasia, 2; adenoma, 7; carcinoma, 7; central, 7; margin 7). In the box-and-whisker plot, the central box represents values from the lower to upper quartile. The middle line represents the mean. The horizontal line extends from the minimum to the maximum value. Values represent the % of YAP positive stromal cells per 20× field of view. * P < 0.05; ** P < 0.01; *** P < 0.001 – unpaired t-test.
Figure 3. YAP is activated in cancer-associated fibroblasts in human disease
A) Images show YAP localisation (red), F-actin (green), and DAPI (blue) staining of human mammary tissue. Scale bar is 20μm. White arrows indicate nuclear accumulation of YAP in the stroma. Chart shows the proportion of non-leukocytic stroma with nuclear YAP localisation in normal, hyperplastic, and malignant breast tissue (round symbols are from analysis of frozen tissue, diamonds are from analysis of formalin-fixed paraffin embedded tissue). Each point represents a different tumour or normal tissue sample; normal, n=9; hyperplasia, n=5; carcinoma, n=16. B) Images show YAP localisation (red), F-actin (green), and DAPI (blue) staining of human squamous epithelium. White arrows indicate nuclear accumulation of YAP in the stroma. Chart shows the proportion of non-leukocytic stroma with nuclear YAP localisation in cancerous human head and neck squamous cell carcinoma and adjacent non-malignant mucosa (both in unmatched and matched pairs from the same patient). Each point represents a different tumour or normal tissue sample; normal, n=13; carcinoma, n=20 (including 11 matched pairs). Scale bar is 20μm. C) Images show YAP or TAZ localisation (green) and DAPI (red) in human CerCAFs,HNCAFs and VCAFs. Scale bars is 20μm. D) Histogram shows the % of CerCAF, HNCAF and VCAF with predominantly nuclear YAP. Bars represent mean ± s.e.m of 5 independet experiments. ** P < 0.01, *** P < 0.001 – unpaired t-test.
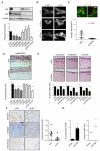
Figure 4. YAP is required for cancer associated fibroblast function
A) Western blots showing depletion of YAP or TAZ with three different siRNA. Chart shows matrix remodelling by CAF#1 following transfection with different YAP or TAZ siRNA. Bars represent mean ± s.e.m (_n_=20 organotypic assays assessed over 4 independent experiments). B) Panels show paxillin and F-actin staining in control, siYAP, and siTAZ transfected CAF#1. Scale bar, 10μm. C) Images show F-actin staining of control and siYAP-transfected fibroblasts and collagen second harmonic signal. Scale bar is 50μm. Histogram shows elastic modulus of matrices remodelled by CAF#1 transfected with control or YAP siRNA. Each data point represents a single measurement, n=96 measurements in total. Line and error bars indicate mean ± s.d. D) Representative images and quantification of 4T1 invasion when co-cultured with murine breast CAF#1 (muBrCAF#1) transfected with control, YAP or TAZ siRNA. Bars represent mean ± s.e.m. (_n_=15 organotypic assays assessed over 3experiments). Scale bar, 50μm. E) Images show squamous cell carcinoma invasion (SCC12 cells) in organotypic co-culture models including human CerCAFs, HNCAFs) and VCAFs. Histogram shows quantification of carcinoma invasion when co-cultured with indicated human CAFs transfected with control, YAP or TAZ siRNA smart-pools. Scale bar, 50μm. Bars represent mean ± s.e.m. of _n_=10 organotypic assays assessed over 3 independent experiments. F) Images show endomucin, Masson’s Trichrome, and vimentin staining of matrix plugs with murine breast CAF#1 transfected with control or YAP siRNA and injected sub-cut in mice. Scale bar, 100μm. Chart shows quantification of endomucin staining in 6 control and 6 YAP siRNA plugs, each plug is from a different mouse. Line and error bars indicate mean ± s.e.m. G) Charts show the effect of YAP S5A expression in NF#1 on gel contraction and ability to promote cancer cell invasion. Bars represent mean ± s.e.m. of three independent experiments (gel contraction). For organotypic invasion, every organotypic measurement is shown individually (pooled from 2 independent experiments) ** P < 0.01, *** P < 0.001 – unpaired t-test. Additional data for Fig. 4e, 4g in Table S2 (Statistics Source Data).
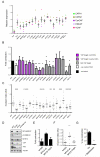
Figure 5. Identification of YAP regulated mRNA and proteins required for CAF function
A) Histogram shows the expression of the 14 genes of interest 72hours after YAP siRNA transfection of CAF#1, CAF#2, CerCAF, HNCAF and VCAF. Expression levels are relative to Lamc2. Each data point represents a single measurement performed in triplicate. Line and error bars indicate mean ± s.e.m of average of the triplicate values from the 5 cell lines analysed. B) Histogram shows the effect of siRNA mediated depletion of the indicated genes on the ability of CAF#1 to contract collagen-rich gels. Bars represent mean ± s.e.m. (_n_=7 independent experiments for siYAP, n=5 independent experiments for siMYL9 and siMYH10, n=4 independent experiments for all other siRNA). C) Plot shows the effect of siRNA mediated depletion of the indicated genes on the ability of CAF#1 to promote cancer cell invasion. Every organotypic measurement is shown individually, bar shows the mean pooled from 2 independent experiments. D) Western blots show levels of MYL9/MLC2, pS19MLC2/MYL9, MYH10, YAP, and TAZ in CAF#1 transfected with either control, YAP, TAZ or YAP&TAZ siRNA. E) Chart shows the effect of MYL9/MLC2 and MYL9/MLC2TASA (T18A, S19A – unphosphorylable mutant) over-expression in NF#1 on gel contraction. Bars represent mean ± s.e.m. of 3 experiments. F) Chart shows the effect of MYL9/MLC2 and MYL9/MLC2TASA over-expression in NF#1 on ability to promote cancer cell invasion. Every organotypic measurement is shown individually (pooled from 2 independent experiments). G) Graph shows the effect of 25μM blebbistatin on matrix remodelling by CAF#1. Bars represent mean ± s.e.m. of 3 independent experiments. * P < 0.05, ** P < 0.01, *** P < 0.001 – unpaired t-test. Additional data for Fig. 5b, 5c, 5e, 5f, 5g in Table S2 (Statistics Source Data).
Figure 6. Actomyosin and Src-dependence of YAP activation in CAFs
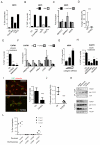
A) Effects of 4T1 conditioned media, LPA and TGFβ on matrix remodelling by NFs. One of two independent experiments is shown. B) Effects of 4T1 conditioned media, TGFβ, and LPA on YAP localisation in NFs. Grey bars indicate presence of blebbistatin. One of two independent experiments is shown. C) Effect of 4T1 conditioned media on gene expression in NFs normalised to Gapdh. Mean and ± S.E.M. n=3 experiments. D) Elastic modulus of matrices remodelled by CAF#1 transfected with control siRNA with or without Y27362 for 3 days. Central box represents the lower and upper quartiles, middle line represents the mean, and horizontal lines show the minimum to the maximum value (_n_=100 independent elastic modulus measurements). E) YAP localisation in CAF#1 with or without Y27362 and blebbistatin for 3 days. Mean ± S.E.M. n=3 experiments. F) Effects of Y27632 and blebbistatin on gene expression in CAF#1 normalized to Gapdh expression. Mean of n=4 experiments, ± s.e.m. G) YAP localisation in NFs cultured on 1.5mg/ml collagen I gel (~100Pa), 8mg/ml collagen (~300Pa) and collagen-coated glass (>10kPa). Mean ± S.D. n=8 experiments. H) YAP localisation in CAF#1 with or without Y27362, blebbistatin, PP2, and Dasatinib for 2 hours. Mean ± S.E.M. n=4 experiments. I) YAP and vimentin staining in CAF#1 matrix plugs grown sub-cutaneously in mice, where indicated mice received 50mg/kg Y27632. Scale bar, 100μm. Average number of YAP +ve nuclei shown for each mouse as an individual data point nuclei (4 control and 5 Y27632-treated mice in one cohort). Bars represent mean ± s.e.m. J) Quantification of endomucin. Each point is an independent plug (3 control and 5 Y27632-treated mice in one cohort). Bars represent mean ± s.e.m. K) Immune-precipitation of TEAD1, TEAD4 and 14-3-3 with YAP in control, blebbistatin-, Y27632-, and Dasatinib-treated CAF#1. L) Matrix remodelling by CAF#2 previously cultured with Y27632, or cultured with Y27632 during the assay. Data from two experiments, distinguished in black and grey. * P < 0.05, ** P < 0.01, *** P < 0.001 – unpaired t-test. Additional data for Fig. 6a,e,&l in Table S2 (Statistics Source Data).
Figure 7
Model outlining the role of YAP in the generation and maintenance of CAFs. A range of soluble factors can promote matrix remodelling by normal fibroblasts. This requires some level of ROCK and actomyosin function. As the matrix becomes stiffer, isometric tension within the cell increases leading to Src activation and the association of YAP with TEAD transcription factors. Active YAP then promotes the expression of ANLN and DIAPH3 and stabilises actomyosin proteins. This leads to further matrix stiffening, thereby generating a positive feedback loop.
Comment in
- YAP forces fibroblasts to feel the tension.
Maller O, DuFort CC, Weaver VM. Maller O, et al. Nat Cell Biol. 2013 Jun;15(6):570-2. doi: 10.1038/ncb2777. Nat Cell Biol. 2013. PMID: 23728464
Similar articles
- YAP forces fibroblasts to feel the tension.
Maller O, DuFort CC, Weaver VM. Maller O, et al. Nat Cell Biol. 2013 Jun;15(6):570-2. doi: 10.1038/ncb2777. Nat Cell Biol. 2013. PMID: 23728464 - CCM3 is a gatekeeper in focal adhesions regulating mechanotransduction and YAP/TAZ signalling.
Wang S, Englund E, Kjellman P, Li Z, Ahnlide JK, Rodriguez-Cupello C, Saggioro M, Kanzaki R, Pietras K, Lindgren D, Axelson H, Prinz CN, Swaminathan V, Madsen CD. Wang S, et al. Nat Cell Biol. 2021 Jul;23(7):758-770. doi: 10.1038/s41556-021-00702-0. Epub 2021 Jul 5. Nat Cell Biol. 2021. PMID: 34226698 Retracted. - Substrate rigidity-dependent positive feedback regulation between YAP and ROCK2.
Sugimoto W, Itoh K, Mitsui Y, Ebata T, Fujita H, Hirata H, Kawauchi K. Sugimoto W, et al. Cell Adh Migr. 2018 Mar 4;12(2):101-108. doi: 10.1080/19336918.2017.1338233. Epub 2018 Jan 29. Cell Adh Migr. 2018. PMID: 28686514 Free PMC article. - YAP/TAZ upstream signals and downstream responses.
Totaro A, Panciera T, Piccolo S. Totaro A, et al. Nat Cell Biol. 2018 Aug;20(8):888-899. doi: 10.1038/s41556-018-0142-z. Epub 2018 Jul 26. Nat Cell Biol. 2018. PMID: 30050119 Free PMC article. Review. - Role of YAP/TAZ in cell-matrix adhesion-mediated signalling and mechanotransduction.
Dupont S. Dupont S. Exp Cell Res. 2016 Apr 10;343(1):42-53. doi: 10.1016/j.yexcr.2015.10.034. Epub 2015 Oct 30. Exp Cell Res. 2016. PMID: 26524510 Review.
Cited by
- Evidence that CRISPR-Cas9 Y537S-mutant expressing breast cancer cells activate Yes-associated protein 1 to driving the conversion of normal fibroblasts into cancer-associated fibroblasts.
Gelsomino L, Caruso A, Tasan E, Leonetti AE, Malivindi R, Naimo GD, Giordano F, Panza S, Gu G, Perrone B, Giordano C, Mauro L, Nardo B, Filippelli G, Bonofiglio D, Barone I, Fuqua SAW, Catalano S, Andò S. Gelsomino L, et al. Cell Commun Signal. 2024 Nov 14;22(1):545. doi: 10.1186/s12964-024-01918-x. Cell Commun Signal. 2024. PMID: 39543704 Free PMC article. - Veratridine, a plant-derived alkaloid, suppresses the hyperactive Rictor-mTORC2 pathway: a new targeted therapy for primary and metastatic colorectal cancer.
Eikanger MM, Sane S, Schraufnagel KS, Slunecka JL, Potts RA, Freeling J, Sereda G, Rasulev B, Brockstein RL, Emon MAB, Saif MTA, Rezvani K. Eikanger MM, et al. Res Sq [Preprint]. 2024 Oct 25:rs.3.rs-5199838. doi: 10.21203/rs.3.rs-5199838/v1. Res Sq. 2024. PMID: 39502780 Free PMC article. Preprint. - Metabolic Reprogramming of Cancer-Associated Fibroblast in the Tumor Microenvironment: From Basics to Clinic.
Zhou L, Zhang W, Hu X, Wang D, Tang D. Zhou L, et al. Clin Med Insights Oncol. 2024 Oct 21;18:11795549241287058. doi: 10.1177/11795549241287058. eCollection 2024. Clin Med Insights Oncol. 2024. PMID: 39450056 Free PMC article. Review. - The axis of tumor-associated macrophages, extracellular matrix proteins, and cancer-associated fibroblasts in oncogenesis.
Yu S, Wang S, Wang X, Xu X. Yu S, et al. Cancer Cell Int. 2024 Oct 7;24(1):335. doi: 10.1186/s12935-024-03518-8. Cancer Cell Int. 2024. PMID: 39375726 Free PMC article. Review. - The role and mechanism of compressive stress in tumor.
Tan M, Song B, Zhao X, Du J. Tan M, et al. Front Oncol. 2024 Sep 16;14:1459313. doi: 10.3389/fonc.2024.1459313. eCollection 2024. Front Oncol. 2024. PMID: 39351360 Free PMC article. Review.
References
- Calvo F, Sahai E. Cell communication networks in cancer invasion. Current opinion in cell iology. 2011;23:621–629. - PubMed
Publication types
MeSH terms
Substances
LinkOut - more resources
Full Text Sources
Other Literature Sources
Medical
Molecular Biology Databases
Miscellaneous
