Hematopoietic progenitor cell lines with myeloid and lymphoid potential - PubMed (original) (raw)
Hematopoietic progenitor cell lines with myeloid and lymphoid potential
Vanessa Redecke et al. Nat Methods. 2013 Aug.
Abstract
Investigation of immune-cell differentiation and function is limited by shortcomings of suitable and scalable experimental systems. Here we show that retroviral delivery of an estrogen-regulated form of Hoxb8 into mouse bone marrow cells can be used along with Flt3 ligand to conditionally immortalize early hematopoietic progenitor cells (Hoxb8-FL cells). Hoxb8-FL cells have lost self-renewal capacity and potential to differentiate into megakaryocytes and erythrocytes but retain the potential to differentiate into myeloid and lymphoid cells. They differentiate in vitro and in vivo into macrophages, granulocytes, dendritic cells, B lymphocytes and T lymphocytes that are phenotypically and functionally indistinguishable from their primary counterparts. Quantitative in vitro assays indicate that myeloid and B-cell potential of Hoxb8-FL cells is comparable to that of primary lymphoid-primed multipotent progenitors, whereas T-cell potential is diminished. The simplicity of this system and the unlimited proliferative capacity of Hoxb8-FL cells will enable studies of immune-cell differentiation and function.
Conflict of interest statement
The authors declare no conflict of interest.
Figures
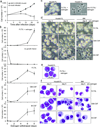
Figure 1. Growth and morphology of Hoxb8–FL cells
(a) BM cells were infected with an MSCV–based, ERHBD–HOXB8 expressing retrovirus or mock infected and cultured in the presence of estrogen and FLT3L. Cell numbers were determined at time points indicated. Error bars represent standard deviation of cells grown in five individual wells. For viral construct and procedure see also Supplementary Figure 1. (b) Medium of 2×10⁵ exponentially growing Hoxb8–FL cells was exchanged by medium with indicated factors and cell numbers of live cells were determined at depicted time points. Mean cell numbers obtained after eight days of culture were: FLT3L, 1.6×10⁶; GM–CSF, 1.3×10⁶; M–CSF, 4.5×10⁶; Error bars represent standard deviation of three Hoxb8–FL cell populations. (c–f) β–estrogen– and FLT3L–containing medium of exponentially growing Hoxb8–FL cells was replaced by medium without growth factor (c), or with FLT3L, GM–CSF or M–CSF, as indicated, and cells were analyzed one day (c) and three and six days (d,f) later by phase contrast microscopy in cell culture (c, d) or after cytospin and May–Grünwald/ Giemsa staining by bright field microscopy (e, f). Unfractionated BM cells were cultured in parallel for six days under the same conditions as described for Hoxb8–FL cells and are shown for comparison. Scale bars: (c, d) = 50 µm, (e, f) = 20 µm.
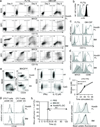
Figure 2. Phenotype and function of Hoxb8–FL– and BM–derived myeloid cells
(a–c) Hoxb8–FL cells or BM cells were cultured in the presence of FLT3L or GM–CSF and analyzed after three and six days (a,b) and six days (c) by flow cytometry. Day 0 corresponds to cells prior to differentiation. (d) Cells were differentiated with FLT3L for six days, followed by treatment with (open) or without (filled) CpG–DNA (1668) for 18 hours and flow cytometry analysis. (e) Cells were differentiated with FLT3L for ten days, followed by flow cytometry analysis. (f) Hoxb8–FL cells were differentiated with FLT3L for six days, treated with or without (ctrl) CpG–DNA (2216; CpG), followed by intracellular staining for IFNα and IL–12p40 and flow cytometry. (g) Cells were differentiated with FLT3L for nine days. Sorted eCD8+ DCs and eCD8– DCs were pulsed with OVA and co–incubated with CFSE–labeled naïve CD4 and CD8 T–cells from TCR–transgenic OTII and OTI mice. T–cell proliferation in the absence (filled) or presence of DC (open) was analyzed by flow cytometry after 72 hours. (h) Cells were differentiated with GM–CSF for nine days, pulsed with OVA for 4 hours and stimulated with CpG–DNA for 18 hours. Mice were immunized with cells or PBS subcutaneously and challenged one week later intra–dermally by OVA–expressing B16 cells. Mice were sacrificed when tumor size reached 1 cm3. n=5 mice per group. * = P < 0.05; ** = P < 0.003 (log–rank test). (d) Cells were differentiated with M–CSF, treated with LPS and IFNγ, and Nitrate levels in supernatants were determined. Error bars represent standard deviation of three biological replicates. (j) Cells were differentiated with M–CSF, incubated with FITC–labeled IgG–coated beads at 37°C for 2 h (solid) or 6 h (thick line), or at 4°C for 6 h (thin line), followed by flow cytometry analysis.
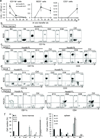
Figure 3. In vivo differentiation of Hoxb8–FL cells
(a) CD45.1+ Hoxb8–FL– and –Hoxb8–SCF cells were transferred into lethally irradiated CD45.2+ recipient mice and CD11b+, B220+, and CD3+ cells in the peripheral blood were quantified based on flow cytometry and complete blood cell counts. Respective cell populations are depicted as total cell numbers over time. Error bars represent standard deviation of three Hoxb8–FL populations. (b–f) CD45.1+ Hoxb8–FL cells were transferred into lethally irradiated CD45.2+ recipient mice and cells from BM (b), spleen (c), peripheral blood (d) and thymus (e) were analyzed by flow cytometry. Representative data obtained from six mice transferred with two independent Hoxb8–FL cell populations (three mice each per population) per time point are depicted. Tissue from untreated control mice (Ctrl) was used for comparison. Relative numbers of cells of the B–cell lineage in the BM and spleen were determined by flow cytometry as described in Supplementary Figure 8a,b (f). Error bars for Hoxb8–FL–derived cells represent standard deviation of six mice that were transferred with two populations of Hoxb8–FL cells (three mice each). Error bars of untreated mice represent standard deviation (n=6).
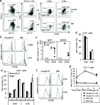
Figure 4. In vivo cell differentiation and function of Hoxb8–FL–derived lymphocytes
(a) Hoxb8–FL cells or BM cells were transferred into lethally irradiated mice and splenic DC were analyzed by flow cytometry after seven days. (b) Hoxb8–FL cells and unfractionated BM cells were transferred into lethally irradiated mice. Seven weeks later, splenocytes were CFSE labeled and left untreated (filled) or stimulated for three days with anti–IgM antibodies (1 µg/ml (solid line), 10 µg/ml (dashed line)) or LPS (0.1 µg/ml (solid line), 0.5 µg/ml (dashed line), followed by flow cytometry analysis. (c) Hoxb8–FL cells or unfractionated BM cells were transferred into lethally irradiated µMT mice along with unfractionated BM helper cells from µMT mice, followed by intradermal injection of OVA plus CpG–DNA on day 21, 31 and 41 after transfer. Serum IgG1 and IgG2a antibody titers were determined by ELISA one day before immunization (Pre) and 10 days after the last immunization (OVA). n.d., not detectable. (d,e) Hoxb8–FL cells and BM cells were transferred into lethally irradiated mice. Seven weeks later, the percentage of CD3+CD4+ and CD3+CD8+ splenocytes (d), and the distribution of select TCR Vβ chains on CD3+CD4+ and CD3+CD8+ splenocytes (e) were analyzed by flow cytometry. Error bars represent standard deviation of three Hoxb8–FL populations. (f) Splenocytes described in (d,e) were CFSE labeled, stimulated for two days with plate–bound αCD3 antibodies (10 µg/ml: dashed line; 3 µ/ml: solid line; non–stim: filled) and αCD28 antibodies (10 µg/ml) and analyzed by flow cytometry. (g) CD45.1+ Hoxb8–FL cells and CD45.2+ BM cells were transferred into lethally irradiated mice. Five weeks later mice were challenged with SEB and the percentage of CD45.1+ CD3+T–cells and CD45.2+ CD3+ T–cells expressing TCR Vβ6– and TCR Vβ8–chains in the peripheral blood was determined by flow cytometry before and 3 and 7 days after SEB challenge. Mean and standard deviation of four mice are shown.
Figure 5. Hoxb8–FL cells realize and sustain multi–lineage potential in vitro, but lack MkE potential
(a) and (b) Hoxb8–FL cells were analyzed by flow cytometry, either in their non–differentiated state (a), or after estrogen withdrawal and co–culture on OP9 cells or OP9–DL1 cells for indicated periods of time (b). (c) Hoxb8–FL cells (Hox) and BM–derived LSK cells (LSK) were seeded as single cells or five cells per well into medium supporting Mk development (see Methods). Plating efficiency (open bars) and number of Mk colonies (filled bars) are shown. Error bars represent standard deviation of three Hoxb8–FL populations. Columns representing LSK cells express means of duplicate plates. (d) Hoxb8–FL cells (Hox), unfractionated BM (BM) or LSK cells (LSK) were seeded in methylcellulose containing medium supplemented with EPO (CFU–E) or EPO, SCF, IL–3 and IL–6 (BFU–E, CFU–M) and formation of CFU–E, BFU–E and CFU–M was determined after two (CFU–E) and 14 days (BFU–E, CFU–M). Error bars represent standard deviation of three Hoxb8–FL populations. Columns representing BM and LSK cells express means of duplicate wells. (e) Five independent Hoxb8–FL cell populations were generated and B–cell, T–cell and myeloid potential was determined after three and six weeks of continuous cell culture.
Figure 6. Phenotype, principal component analysis (PCA) and biochemical application of Hoxb8–FL cells
(a) Lineage depleted BM cells and Hoxb8–FL cells were analyzed by flow cytometry. Open, specific antibodies; filled = isotype controls. Data are representative for at least five independent populations of Hoxb8–FL cells. (b) Three–dimensional PCA based on gene expression profiles of Hoxb8–FL cells (four independent populations), bone marrow–derived macrophages (BMM), granulocytes (GR) and purified hematopoietic progenitor cell populations. LTHSC, long–term hematopoietic stem cell; STHSC, short–term hematopoietic stem cell, LMPP, lymphoid–primed multipotent progenitor; ETP, early thymic progenitor; ProB, pro B–cell; PreB, pre B–cell; CD4T, CD4+ T–cell, Pre–GM, pre–granulocyte/ macrophage; GMP, granulocyte/macrophage progenitor; MkP, megakaryocyte progenitor; MkE, Megakaryocyte/ Erythrocyte progenitor; Pre CFU–E, pre–colony forming unit–erythrocytes; CFU–E, colony forming unit–erythrocytes; Pro–E, pro–Erythrocyte; GR, granulocyte. Each symbol represents an individual biological sample. PC, principal component. (c) Hoxb8–FL cells were generated from BM of ABIN1–deficient mice, reconstituted with epitope–tagged ABIN1 (FS–ABIN1), either wildtype (WT) or an ubiquitin–binding mutant (EE) or an empty control vector (Ctrl), differentiated into DC in the presence of GM–CSF for eight days, followed by tandem affinity purification of ABIN1. Purified proteins were separated by SDS/ PAGE, visualized by SYPRO Ruby (c) and identified by LC–MS (for peptide identifications see Supplementary Table 1). (d and e) ABIN1 expression was analyzed in non–differentiated cells (non–diff. (d)) and GM–CSF–driven DC (d, e) by intracellular (FLAG) staining and flow cytometry (d), and immuno–blotting with antibodies against ABIN1 (e).
Similar articles
- In Vitro Generation of Murine Dendritic Cells from Hoxb8-Immortalized Hematopoietic Progenitors.
Häcker H. Häcker H. Methods Mol Biol. 2023;2618:93-107. doi: 10.1007/978-1-0716-2938-3_7. Methods Mol Biol. 2023. PMID: 36905511 - Hox-driven conditional immortalization of myeloid and lymphoid progenitors: Uses, advantages, and future potential.
Lail SS, Arnold CR, de Almeida LGN, McKenna N, Chiriboga JA, Dufour A, Warren AL, Yates RM. Lail SS, et al. Traffic. 2022 Nov;23(11):538-553. doi: 10.1111/tra.12869. Epub 2022 Oct 4. Traffic. 2022. PMID: 36117140 - Hoxa9 and Flt3 signaling synergistically regulate an early checkpoint in lymphopoiesis.
Gwin KA, Shapiro MB, Dolence JJ, Huang ZL, Medina KL. Gwin KA, et al. J Immunol. 2013 Jul 15;191(2):745-54. doi: 10.4049/jimmunol.1203294. Epub 2013 Jun 14. J Immunol. 2013. PMID: 23772038 Free PMC article. - Stepwise lineage restriction of progenitors in lympho-myelopoiesis.
Katsura Y, Kawamoto H. Katsura Y, et al. Int Rev Immunol. 2001 Feb;20(1):1-20. doi: 10.3109/08830180109056720. Int Rev Immunol. 2001. PMID: 11342295 Review. - Expression of FLT3 receptor and response to FLT3 ligand by leukemic cells.
Drexler HG. Drexler HG. Leukemia. 1996 Apr;10(4):588-99. Leukemia. 1996. PMID: 8618433 Review.
Cited by
- TGF-β Enhances Immunosuppression of Myeloid-Derived Suppressor Cells to Induce Transplant Immune Tolerance Through Affecting Arg-1 Expression.
Cao P, Sun Z, Zhang F, Zhang J, Zheng X, Yu B, Zhao Y, Wang W, Wang W. Cao P, et al. Front Immunol. 2022 Jul 7;13:919674. doi: 10.3389/fimmu.2022.919674. eCollection 2022. Front Immunol. 2022. PMID: 35874674 Free PMC article. - Differences in Cell-Intrinsic Inflammatory Programs of Yolk Sac and Bone Marrow Macrophages.
Elhag S, Stremmel C, Zehrer A, Plocke J, Hennel R, Keuper M, Knabe C, Winterhalter J, Gölling V, Tomas L, Weinberger T, Fischer M, Liu L, Wagner F, Lorenz M, Stark K, Häcker H, Schmidt-Supprian M, Völker U, Jastroch M, Lauber K, Straub T, Walzog B, Hammer E, Schulz C. Elhag S, et al. Cells. 2021 Dec 17;10(12):3564. doi: 10.3390/cells10123564. Cells. 2021. PMID: 34944072 Free PMC article. - Characterisation of Neutropenia-Associated Neutrophil Elastase Mutations in a Murine Differentiation Model In Vitro and In Vivo.
Wiesmeier M, Gautam S, Kirschnek S, Häcker G. Wiesmeier M, et al. PLoS One. 2016 Dec 12;11(12):e0168055. doi: 10.1371/journal.pone.0168055. eCollection 2016. PLoS One. 2016. PMID: 27942017 Free PMC article. - Ultraviolet radiation shapes dendritic cell leukaemia transformation in the skin.
Griffin GK, Booth CAG, Togami K, Chung SS, Ssozi D, Verga JA, Bouyssou JM, Lee YS, Shanmugam V, Hornick JL, LeBoeuf NR, Morgan EA, Bernstein BE, Hovestadt V, van Galen P, Lane AA. Griffin GK, et al. Nature. 2023 Jun;618(7966):834-841. doi: 10.1038/s41586-023-06156-8. Epub 2023 Jun 7. Nature. 2023. PMID: 37286599 Free PMC article. - FOXO activity adaptation safeguards the hematopoietic stem cell compartment in hyperglycemia.
Govindarajah V, Lee JM, Solomon M, Goddard B, Nayak R, Nattamai K, Geiger H, Salomonis N, Cancelas JA, Reynaud D. Govindarajah V, et al. Blood Adv. 2020 Nov 10;4(21):5512-5526. doi: 10.1182/bloodadvances.2020001826. Blood Adv. 2020. PMID: 33166407 Free PMC article.
References
- Argiropoulos B, Humphries RK. Hox genes in hematopoiesis and leukemogenesis. Oncogene. 2007;26:6766–6776. - PubMed
- Pineault N, Helgason CD, Lawrence HJ, Humphries RK. Differential expression of Hox, Meis1, and Pbx1 genes in primitive cells throughout murine hematopoietic ontogeny. Exp Hematol. 2002;30:49–57. - PubMed
- Wang GG, et al. Quantitative production of macrophages or neutrophils ex vivo using conditional Hoxb8. Nat Methods. 2006;3:287–293. - PubMed
- McKenna HJ, et al. Mice lacking flt3 ligand have deficient hematopoiesis affecting hematopoietic progenitor cells, dendritic cells, and natural killer cells. Blood. 2000;95:3489–3497. - PubMed
Publication types
MeSH terms
Substances
LinkOut - more resources
Full Text Sources
Other Literature Sources
Medical
Molecular Biology Databases
Research Materials
Miscellaneous


