Intracellular free radical production by peripheral blood T lymphocytes from patients with systemic sclerosis: role of NADPH oxidase and ERK1/2 - PubMed (original) (raw)
Intracellular free radical production by peripheral blood T lymphocytes from patients with systemic sclerosis: role of NADPH oxidase and ERK1/2
Donatella Amico et al. Arthritis Res Ther. 2015.
Abstract
Introduction: Abnormal oxidative stress has been described in systemic sclerosis (SSc) and previous works from our laboratory demonstrated an increased generation of reactive oxygen species (ROS) by SSc fibroblasts and monocytes. This study investigated the ability of SSc T lymphocytes to produce ROS, the molecular pathway involved, and the biological effects of ROS on SSc phenotype.
Methods: Peripheral blood T lymphocytes were isolated from serum of healthy controls or SSc patients by negative selection with magnetic beads and activated either with PMA or with magnetic beads coated with anti-CD3 and anti-CD28 antibodies. Intracellular ROS generation was measured using a DCFH-DA assay in a plate reader fluorimeter or by FACS analysis. CD69 expression and cytokine production were analyzed by FACS analysis. Protein expression was studied using immunoblotting techniques and mRNA levels were quantified by real-time PCR. Cell proliferation was carried out using a BrdU incorporation assay.
Results: Peripheral blood T lymphocytes from SSc patients showed an increased ROS production compared to T cells from healthy subjects. Since NADPH oxidase complex is involved in oxidative stress in SSc and we found high levels of gp91phox in SSc T cells, SSc T cells were incubated with chemical inhibititors or specific siRNAs against gp91phox. Inhibition of NADPH oxidase partially reverted CD69 activation and proliferation rate increase, and significantly influenced cytokine production and ERK1/2 activation.
Conclusions: SSc T lymphocityes are characterized by high levels of ROS, generated by NADPH oxidase via ERK1/2 phosphorylation, that are essential for cell activation, proliferation, and cytokine production. These data confirm lymphocytes as key cellular players in the pathogenesis of systemic sclerosis and suggest a crucial link between ROS and T cell activation.
Figures
Figure 1
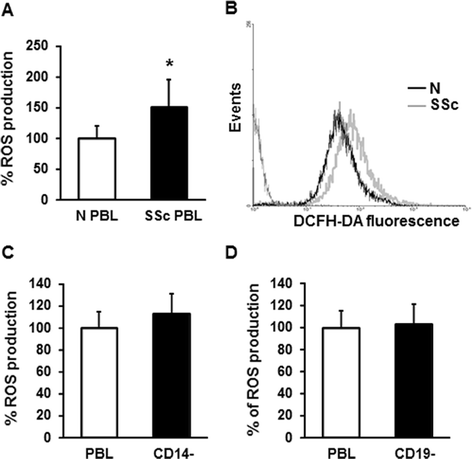
ROS production by PBL from SSc patients and healthy controls. (A) PBL from 17 healthy controls (white bar) and 34 SSc patients (black bar), isolated from peripheral blood were stained with 20 μM DCFH-DA for 20 minutes, and fluorescence was measured in a plate reader fluorimeter. Each patient and control was tested three times and the mean value used to calculate the mean of each group. Data are means ± standard deviation (SD). * P <0.05 compared to normal PBL. (B) ROS production by PBL from one healthy control (black line) and one SSc patient (grey line) was analyzed by FACS analysis. A representative histogram of three independent experiments is shown. (C and D) SSc CD14- (C) and SSc CD19- cells (D) were purified from PBL using CD14 and CD19 microbeads. The total fractions of cells (PBL, white bars) and the collected depleted fractions (black bars) were stained with 20 μM DCFH-DA for 20 minutes, and fluorescence was measured on a plate reader fluorimeter. Data are means ± SD of three independent experiments with cells from three distinct subjects. DCFH-DA, 2′, 7′-dichlorodihydrofluorescin diacetate; PBL, peripheral blood lymphocytes; ROS, reactive oxygen species; SSc, systemic sclerosis.
Figure 2
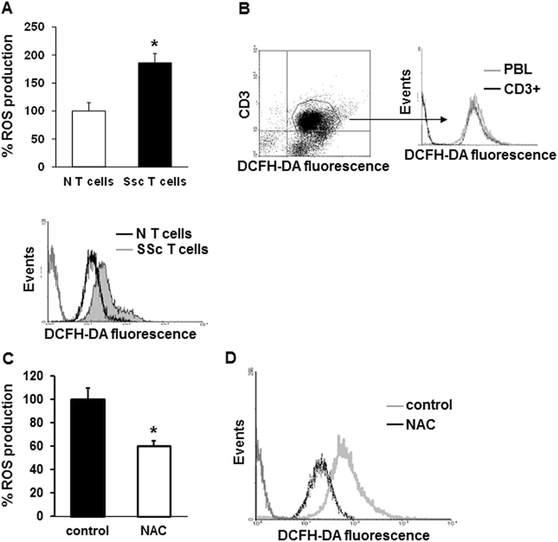
ROS production by T cells from SSc patients and healthy controls. (A) T lymphocytes from 12 healthy controls (white bar) and 23 SSc patients (black bar) purified using a negative selection procedure were stained with 20 μM DCFH-DA, and the fluorescence was quantified in a plate reader fluorimeter (upper panel). Each patient and control was tested three times and the mean value used to calculate the mean of each group. Data are means ± standard deviation (SD). * P <0.05 compared to normal T cells. Representative histogram of ROS production in T cells from one healthy control (black line) and one SSc patient (grey line) analyzed by FACS analysis is shown in the lower panel. (B) ROS production in total (grey line) and in CD3+ PBL (black line) from one SSc patient simultaneously stained with 2 μM DCFH-DA and monoclonal PerCP-conjugated anti-CD3 antibody for 20 minutes was analyzed by FACS analysis. Histogram is representative of three independent experiments. (C) CD3+ T lymphocytes isolated from 10 SSc patients and treated with NAC (10 mM, 1 hour) were stained with 20 μM DCFH-DA for 20 minutes, and the fluorescence was measured in a plate reader fluorimeter. Each treatment was tested three times and the mean value used to calculate the mean of each group. Data are means ± SD. * P <0.05 compared to untreated T cells (control). (D) Untreated (control, grey line) or treated with NAC CD3+ T cells (black line) were simultaneously stained with 2 μM DCFH-DA and monoclonal PerCP-conjugated anti-CD3 antibody for 20 minutes, and ROS production was analyzed by FACS analysis. Representative histogram of three independent experiments is shown. DCFH-DA, 2′, 7′-dichlorodihydrofluorescin diacetate; NAC, N-acetylcysteine; PBL, peripheral blood lymphocytes; PerCP, peridinin chlorophyl protein; ROS, reactive oxygen species; SSc, systemic sclerosis.
Figure 3
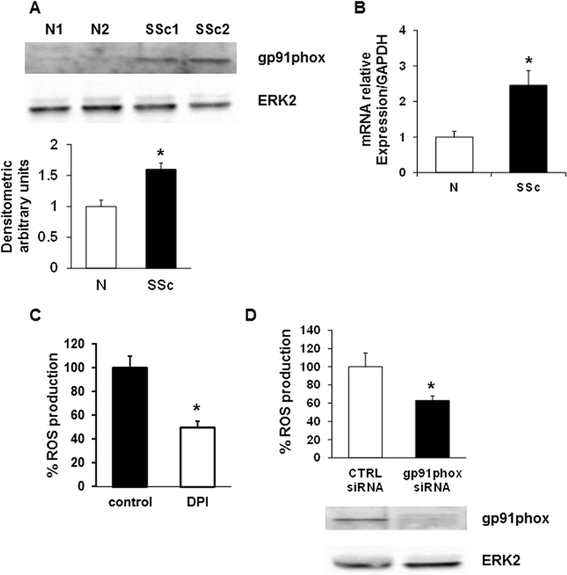
Role of NOX2 in ROS production by SSc T cells. (A) A representative gp91phox immunoblot of three independent experiments is shown. T cells were isolated from healthy controls (N) and SSc patients (SSc) and then analyzed by immunoblotting with specific antibodies. The lower panel shows the densitometric analysis from distinct experiments with five healthy controls and five SSc patients. Data are means ± standard deviation (SD). * P <0.05 compared to normal T cells. (B) Real time-PCR for gp91phox expression in T cells was isolated from five healthy controls and five SSc patients. Each patient and control was tested three times and the mean value used to calculate the mean of each group. Data are means ± SD. * P <0.05 compared to normal T cells. (C) T cells isolated from five SSc patients were treated with DPI (20 μM, 1 hour), stained with 20 μM DCFH-DA and subsequently analyzed in a plate reader fluorimeter. Each treatment was tested three times and the mean value used to calculate the mean of each group. Data are means ± SD. * P <0.05 compared to untreated T cells (control). (D) ROS production in SSc T lymphocytes transiently transfected with control siRNA (CTRL siRNA) or gp91phox targeted siRNA (gp91phox siRNA) for 72 hours (upper panel). Data are means ± SD of three independent experiments with cells from three distinct patients. * P <0.05 compared to control siRNA. Transfection efficiency was monitored by western blot (lower panel). DCFH-DA, 2′, 7′-dichlorodihydrofluorescin diacetate; NOX2, NADPH oxidase 2; ROS, reactive oxygen species; siRNA, small interfering RNA; SSc, systemic sclerosis.
Figure 4
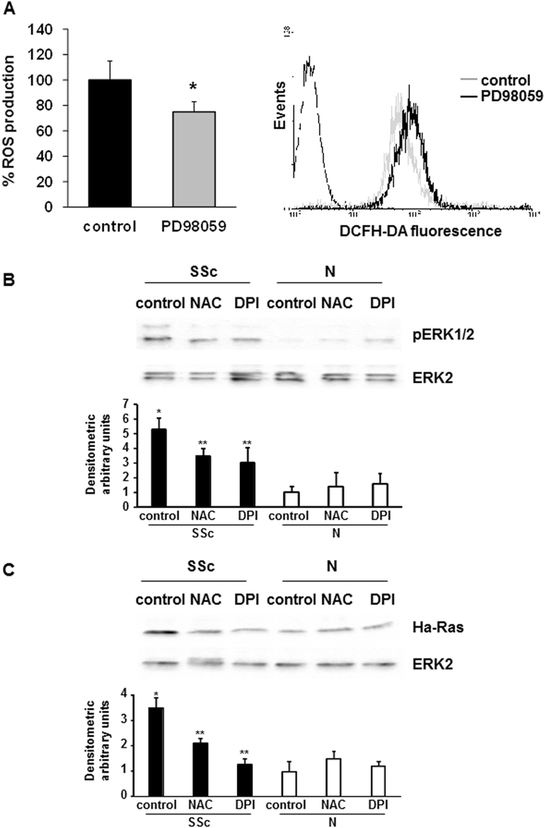
pERK1/2 implication in ROS production. (A) T lymphocytes from five SSc patients were incubated with PD98059 (50 μM, 2 hours) or left untreated. After staining with 20 μM DCFH-DA, fluorescence was analyzed in a plate reader fluorimeter (left panel). Each treatment was tested three times and the mean value used to calculate the mean of each group. Data are means ± standard deviation (SD). * P <0.05 compared to untreated T cells (control). Representative histogram of ROS production by SSc T cells is shown in the right panel. Untreated (control, grey line) and PD98059 treated cells (black line) were stained with 2 μM DCFH-DA and analyzed by FACS analysis. (B) Representative pERK1/2 immunoblot of three independent experiments is shown (upper panel). T lymphocytes were isolated from five healthy controls and five SSc patients, treated with NAC (10 mM, 1 hour) or DPI (20 μM, 1 hour), and then analyzed by immunoblotting with specific antibodies. The lower panel shows the densitometric analysis from distinct experiments with five healthy controls and five SSc patients. Data are means ± SD. * P <0.05 compared to untreated normal T cells. ** P < 0.05 compared to untreated SSc T cells. (C) Representative Ha-Ras immunoblot of three independent experiments is shown (upper panel). T lymphocytes were isolated from five healthy controls and five SSc patients, treated with NAC (10 mM, 1 hour) or DPI (20 μM, 1 hour), and then analyzed by immunoblotting with specific antibodies. The lower panel shows the densitometric analysis from distinct experiments with five healthy controls and five SSc patients. Data are means ± SD. * P <0.05 compared to untreated normal T cells. ** P <0.05 compared to untreated SSc T cells. DCFH-DA, 2′, 7′-dichlorodihydrofluorescin diacetate; DPI, diphenylene iodonium; NAC, N-acetylcysteine; ROS, reactive oxygen species; SSc, systemic sclerosis.
Figure 5
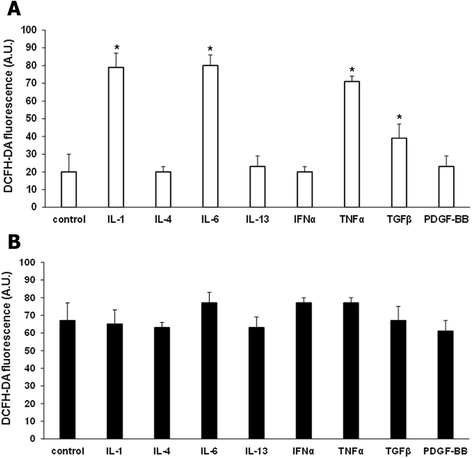
Modulation of ROS production by cytokines. ROS production by T cells isolated from three healthy controls (A) and three SSc patients (B) and treated with IL-1 (10 ng/ml), IL-4 (15 ng/ml), IL-6 (5 ng/ml), IL-13 (50 ng/ml), IFNα (0.5 ng/ml), TNFα (1 ng/ml), TGFβ (1 ng/ml), and PDGF-BB (15 ng/ml) for 15 minutes. Cells were then stained with 20 μM DCFH-DA and analyzed in a plate reader fluorimeter. Data are means ± standard deviation (SD) of three independent experiments with cells from three distinct subjects. * P <0.05 compared to untreated T cells. DCFH-DA, 2′, 7′-dichlorodihydrofluorescin diacetate; IFNα, interferon alpha; IL, interleukin; PDGF-BB, platelet-derived growth factor beta; ROS, reactive oxygen species; SSc, systemic sclerosis; Th, T helper; TGFβ, transforming growth factor beta; TNFα, tumor necrosis factor alpha.
Figure 6
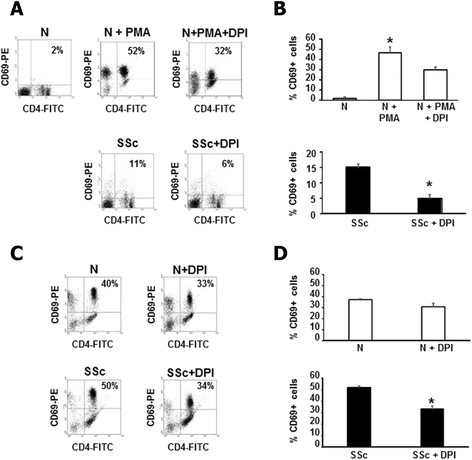
Modulation of T cell activation by ROS. (A) One representative flow cytometry analysis of CD69 expression is shown. PMA activated normal T cells (upper panels) or SSc T cells (lower panels) were treated with DPI (20 μM, 1 hour). Plots represent live cells gated for CD4+ cells. (B) Percentage of CD69+ cells in three healthy controls (upper panel) and three SSc patients (lower panel) are presented. Cells were treated as in A. Data are means ± standard deviation (SD). * P <0.05 compared to untreated T cells. (C) One representative flow cytometry analysis of CD69 expression is shown. Normal T cells (upper panels) or SSc T cells (lower panels) were activated with CD3/CD28 magnetic beads and treated with DPI (20 μM, 1 hour). Plots represent live cells gated for CD4+ cells. (D) Percentage of CD69+ cells in three healthy controls (upper panel) and three SSc patients (lower panel) are presented. Cells were treated as in C. Data are means ± SD. * P <0.05 compared to untreated T cells. DPI, diphenylene iodonium; PMA, phorbol myristate acetate; ROS, reactive oxygen species; SSc, systemic sclerosis.
Figure 7
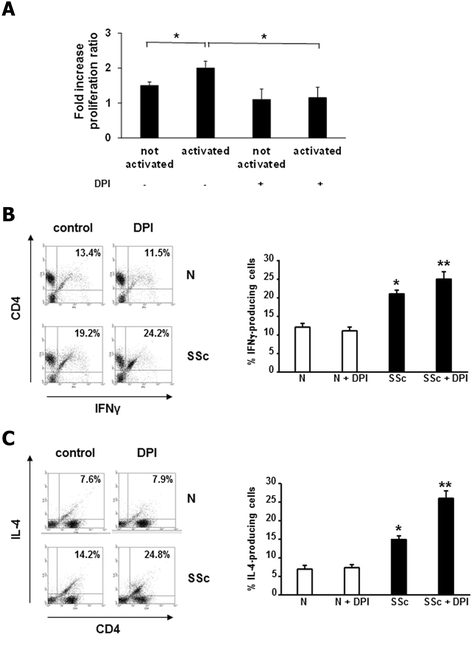
Modulation of proliferation and cytokine production by ROS in activated T cells. (A) T cells from three healthy controls and three SSc patients were activated with CD3/CD28 magnetic beads, treated with DPI (20 μM, 1 hour) and pulsed with BrdU for 6 hours. Proliferation was measured with a colorimetric immunoassay in a plate reader fluorimeter. Data are means ± standard deviation (SD) of fold increase of SSc/N proliferation ratio. * P <0.05. (B) One representative flow cytometry analysis of IFNγ-producing T cells is shown. Normal T cells (upper panels) or SSc T cells (lower panels) were activated with CD3/CD28 magnetic beads and treated with DPI (20 μM, 1 hour). Plots represent live cells gated for CD4+ cells. Percentage of IFNγ-producing T cells in three healthy controls and three SSc patients are presented (right panel). Data are means ± SD. * P <0.05 compared to normal untreated T cells. ** P <0.05 compared to SSc untreated T cells. (C) One representative flow cytometry analysis of IL-4-producing T cells is shown. Normal T cells (upper panel) or SSc T cells (lower panel) were activated with CD3/CD28 magnetic beads and treated with DPI (20 μM, 1 hour). Plots represent live cells gated for CD4+ cells. Percentage of IL-4-producing T cells in three healthy controls and three SSc patients are presented (right panel). Data are means ± SD. * P <0.05 compared to normal untreated T cells. ** P <0.05 compared to SSc untreated T cells. BrdU, bromodeoxyuridine; DPI, diphenylene iodonium; IFN, interferon; PMA, phorbol myristate acetate; ROS, reactive oxygen species; SSc, systemic sclerosis.
Similar articles
- A reactive oxygen species-mediated loop maintains increased expression of NADPH oxidases 2 and 4 in skin fibroblasts from patients with systemic sclerosis.
Spadoni T, Svegliati Baroni S, Amico D, Albani L, Moroncini G, Avvedimento EV, Gabrielli A. Spadoni T, et al. Arthritis Rheumatol. 2015 Jun;67(6):1611-22. doi: 10.1002/art.39084. Arthritis Rheumatol. 2015. PMID: 25707572 - Oxidative stress in scleroderma: maintenance of scleroderma fibroblast phenotype by the constitutive up-regulation of reactive oxygen species generation through the NADPH oxidase complex pathway.
Sambo P, Baroni SS, Luchetti M, Paroncini P, Dusi S, Orlandini G, Gabrielli A. Sambo P, et al. Arthritis Rheum. 2001 Nov;44(11):2653-64. doi: 10.1002/1529-0131(200111)44:11<2653::aid-art445>3.0.co;2-1. Arthritis Rheum. 2001. PMID: 11710721 - _N_-Formyl Peptide Receptors Induce Radical Oxygen Production in Fibroblasts Derived From Systemic Sclerosis by Interacting With a Cleaved Form of Urokinase Receptor.
Napolitano F, Rossi FW, Pesapane A, Varricchio S, Ilardi G, Mascolo M, Staibano S, Lavecchia A, Ragno P, Selleri C, Marone G, Matucci-Cerinic M, de Paulis A, Montuori N. Napolitano F, et al. Front Immunol. 2018 Apr 4;9:574. doi: 10.3389/fimmu.2018.00574. eCollection 2018. Front Immunol. 2018. PMID: 29670612 Free PMC article. - The immunobiology of systemic sclerosis.
Gu YS, Kong J, Cheema GS, Keen CL, Wick G, Gershwin ME. Gu YS, et al. Semin Arthritis Rheum. 2008 Oct;38(2):132-60. doi: 10.1016/j.semarthrit.2007.10.010. Epub 2008 Jan 25. Semin Arthritis Rheum. 2008. PMID: 18221988 Review. - Circulating Vdelta1+ T cells are activated and accumulate in the skin of systemic sclerosis patients.
Giacomelli R, Matucci-Cerinic M, Cipriani P, Ghersetich I, Lattanzio R, Pavan A, Pignone A, Cagnoni ML, Lotti T, Tonietti G. Giacomelli R, et al. Arthritis Rheum. 1998 Feb;41(2):327-34. doi: 10.1002/1529-0131(199802)41:2<327::AID-ART17>3.0.CO;2-S. Arthritis Rheum. 1998. PMID: 9485091 Review.
Cited by
- Molecular Basis of Accelerated Aging with Immune Dysfunction-Mediated Inflammation (Inflamm-Aging) in Patients with Systemic Sclerosis.
Shen CY, Lu CH, Wu CH, Li KJ, Kuo YM, Hsieh SC, Yu CL. Shen CY, et al. Cells. 2021 Dec 2;10(12):3402. doi: 10.3390/cells10123402. Cells. 2021. PMID: 34943909 Free PMC article. Review. - Redox-sensitive signaling in inflammatory T cells and in autoimmune disease.
Weyand CM, Shen Y, Goronzy JJ. Weyand CM, et al. Free Radic Biol Med. 2018 Sep;125:36-43. doi: 10.1016/j.freeradbiomed.2018.03.004. Epub 2018 Mar 7. Free Radic Biol Med. 2018. PMID: 29524605 Free PMC article. Review. - The Potential of Twendee X® as a Safe Antioxidant Treatment for Systemic Sclerosis.
You F, Nicco C, Harakawa Y, Yoshikawa T, Inufusa H. You F, et al. Int J Mol Sci. 2024 Mar 6;25(5):3064. doi: 10.3390/ijms25053064. Int J Mol Sci. 2024. PMID: 38474309 Free PMC article. - Reactive Oxygen Species and Oxidative Stress in the Pathogenesis and Progression of Genetic Diseases of the Connective Tissue.
Egea G, Jiménez-Altayó F, Campuzano V. Egea G, et al. Antioxidants (Basel). 2020 Oct 19;9(10):1013. doi: 10.3390/antiox9101013. Antioxidants (Basel). 2020. PMID: 33086603 Free PMC article. Review. - Plasma Glycosaminoglycan Profiles in Systemic Sclerosis: Associations with MMP-3, MMP-10, TIMP-1, TIMP-2, and TGF-Beta.
Kuźnik-Trocha K, Winsz-Szczotka K, Komosińska-Vassev K, Jura-Półtorak A, Kotulska-Kucharz A, Kucharz EJ, Kotyla P, Olczyk K. Kuźnik-Trocha K, et al. Biomed Res Int. 2020 Apr 21;2020:6416514. doi: 10.1155/2020/6416514. eCollection 2020. Biomed Res Int. 2020. PMID: 32382564 Free PMC article. Clinical Trial.
References
Publication types
MeSH terms
Substances
LinkOut - more resources
Full Text Sources
Other Literature Sources
Medical
Miscellaneous
