Microenvironment rigidity modulates responses to the HER2 receptor tyrosine kinase inhibitor lapatinib via YAP and TAZ transcription factors - PubMed (original) (raw)
Microenvironment rigidity modulates responses to the HER2 receptor tyrosine kinase inhibitor lapatinib via YAP and TAZ transcription factors
Chun-Han Lin et al. Mol Biol Cell. 2015.
Abstract
Stiffness is a biophysical property of the extracellular matrix that modulates cellular functions, including proliferation, invasion, and differentiation, and it also may affect therapeutic responses. Therapeutic durability in cancer treatments remains a problem for both chemotherapies and pathway-targeted drugs, but the reasons for this are not well understood. Tumor progression is accompanied by changes in the biophysical properties of the tissue, and we asked whether matrix rigidity modulated the sensitive versus resistant states in HER2-amplified breast cancer cell responses to the HER2-targeted kinase inhibitor lapatinib. The antiproliferative effect of lapatinib was inversely proportional to the elastic modulus of the adhesive substrata. Down-regulation of the mechanosensitive transcription coactivators YAP and TAZ, either by siRNA or with the small-molecule YAP/TEAD inhibitor verteporfin, eliminated modulus-dependent lapatinib resistance. Reduction of YAP in vivo in mice also slowed the growth of implanted HER2-amplified tumors, showing a trend of increasing sensitivity to lapatinib as YAP decreased. Thus we address the role of stiffness in resistance to and efficacy of a HER2 pathway-targeted therapeutic via the mechanotransduction arm of the Hippo pathway.
© 2015 Lin et al. This article is distributed by The American Society for Cell Biology under license from the author(s). Two months after publication it is available to the public under an Attribution–Noncommercial–Share Alike 3.0 Unported Creative Commons License (http://creativecommons.org/licenses/by-nc-sa/3.0).
Figures
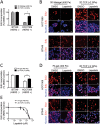
FIGURE 1:
Substrate elastic modulus is a modifier of lapatinib responses in HER2-amplified cancer cells. Bar graphs show the relative incorporation of EdU expressed as a percentage of DMSO-treated cells in (A) HCC1569 and BT549 cells cultured on 2D TCP dishes or 3D in Matrigel for 48 h and then treated with lapatinib or DMSO for 48 h (n = 3; 500 cells/condition per experiment, *p < 0.05). (B) Representative images of HCC1569 and BT549 cells cultured on 2D TCP or in 3D Matrigel. EdU is pseudocolored red, and nuclear DNA is blue. (C) Bar graphs showing relative incorporation of EdU expressed as a percentage of DMSO-treated cells. HCC1569 and BT549 cells cultured on 2D TCP or 400-Pa PA gels for 48 h, followed by lapatinib (1.5 μM) or DMSO for 48 h (n = 3; 500 cells/condition per experiment, *p < 0.05). (D) Representative images of HCC1569 and BT549 cells cultured on 2D TCP or 400-Pa PA gels. EdU is pseudocolored red, and nuclear DNA is blue. Scale bars, 20 μm. (E) Dose-response curves used to calculate IC50 of lapatinib in HCC1569 cells cultured on 400-Pa PA gel (0.94 μM) vs. 2D TCP (2.66 μM). n = 3; 500 cells/condition per experiment, *p < 0.05.
FIGURE 2:
YAP and TAZ are required for modulus-dependent lapatinib responses. (A) Representative images of HCC1569 after 48 h culture on substrates of increasing stiffness: immunofluorescence stains represent YAP (green), TAZ (red), and nucleus (blue). Scale bars, 20 μm. (B) Bar graphs showing the proportions of single cells in which YAP and TAZ were located in the nucleus or cytoplasm or evenly distributed in both compartments as a function of stiffness (n = 3; 100 cells/condition per experiment, *p < 0.05). (C) Bar graphs showing the relative incorporation of EdU in HCC1569 cells cultured on 2D TCP and 400-Pa PA gel with YAP or TAZ knockdown by siRNA for 72 h and then treated with lapatinib (1.5 μM) or DMSO for 48 h. Results are expressed as a percentage of cells treated with DMSO and NSC siRNA-treated cells (n = 3; 500 cells/condition per experiment, *p < 0.05). (D) Bar graphs showing relative incorporation of EdU in HCC1569 cells cultured on 400-Pa and 40-kPa PA gels for 48 h and then treated with lapatinib (1.5 μM) together with verteporfin (2 μg/ml) or DMSO for 48 h. Results expressed as percentage of DMSO-treated controls (n = 3; 500/condition per experiment, *p < 0.05).
FIGURE 3:
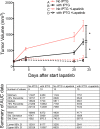
YAP knockdown has a synergistic trend of inhibition with lapatinib in vivo. Tumor volume curves as a function of time and the summary table of area-under-the-curve data for different treatment groups. The tumor volume was measured during the course of lapatinib treatment on mice that did not receive IPTG or lapatinib (group A), mice treated with IPTG only (group B), mice treated with lapatinib only (group C), and mice treated with lapatinib together with IPTG (group D).
FIGURE 4:
YAP-dependent amphiregulin protein regulation is involved in modulus-dependent lapatinib responses. Bar graphs showing (A) AREG mRNA expression level measured by qRT-PCR and (B) cell surface AREG measured by FACS in HCC1569 cultured on TCP or 400-Pa PA gels for 96 h (n = 3; 10,000 cells/condition per experiment, *p < 0.05). (C) Bar graphs showing the proportions of single cells in which YAP and TAZ were located in the nucleus or cytoplasm or evenly distributed in both compartments as a function of stiffness in HCC1569 cells cultured on TCP or 400-Pa PA gel for 48 h and then treated with AREG (5 ng/ml) for 48 h (n = 3; 100 cells/condition per experiment, *p < 0.05). (D) Bar graphs showing the relative incorporation of EdU, expressed as a percentage of DMSO-treated cells in HCC1569 cultured on TCP or 400-Pa PA gels for 48 h and then treated with lapatinib (1.5 mM), AREG (5 ng/ml), and erlotinib (1.5 mM) for 48 h (n = 3; 500 cells/condition per experiment, *p < 0.05). (E) Bar graphs showing intracellular AREG protein levels measured by enzyme-linked immunosorbent assay in HCC1569 with NSC siRNA or YAP knockdown by siRNA for 72 h (n = 3, *p < 0.05). (F) Bar graphs show the relative incorporation of EdU, expressed as a percentage of DMSO- and NSC siRNA–treated cells in HCC1569 cultured on 400-Pa and 40-kPa PA gels with AREG knockdown by siRNA for 72 h and then treated with lapatinib (1.5 μM) or DMSO for 48 h (n = 3; 500 cells/condition per experiment, *p < 0.05).
Similar articles
- Epidermal growth factor-receptor activation modulates Src-dependent resistance to lapatinib in breast cancer models.
Formisano L, Nappi L, Rosa R, Marciano R, D'Amato C, D'Amato V, Damiano V, Raimondo L, Iommelli F, Scorziello A, Troncone G, Veneziani B, Parsons SJ, De Placido S, Bianco R. Formisano L, et al. Breast Cancer Res. 2014 May 5;16(3):R45. doi: 10.1186/bcr3650. Breast Cancer Res. 2014. PMID: 24887236 Free PMC article. - Direct inhibition of PI3K in combination with dual HER2 inhibitors is required for optimal antitumor activity in HER2+ breast cancer cells.
Rexer BN, Chanthaphaychith S, Dahlman K, Arteaga CL. Rexer BN, et al. Breast Cancer Res. 2014 Jan 23;16(1):R9. doi: 10.1186/bcr3601. Breast Cancer Res. 2014. PMID: 24451154 Free PMC article. - Dual mTORC1/2 and HER2 blockade results in antitumor activity in preclinical models of breast cancer resistant to anti-HER2 therapy.
García-García C, Ibrahim YH, Serra V, Calvo MT, Guzmán M, Grueso J, Aura C, Pérez J, Jessen K, Liu Y, Rommel C, Tabernero J, Baselga J, Scaltriti M. García-García C, et al. Clin Cancer Res. 2012 May 1;18(9):2603-12. doi: 10.1158/1078-0432.CCR-11-2750. Epub 2012 Mar 8. Clin Cancer Res. 2012. PMID: 22407832 - Does lapatinib, a small-molecule tyrosine kinase inhibitor, constitute a breakthrough in the treatment of breast cancer?
Ito Y, Tokudome N, Sugihara T, Takahashi S, Hatake K. Ito Y, et al. Breast Cancer. 2007;14(2):156-62. doi: 10.2325/jbcs.971. Breast Cancer. 2007. PMID: 17485900 Review. - Lapatinib.
Voigtlaender M, Schneider-Merck T, Trepel M. Voigtlaender M, et al. Recent Results Cancer Res. 2018;211:19-44. doi: 10.1007/978-3-319-91442-8_2. Recent Results Cancer Res. 2018. PMID: 30069757 Review.
Cited by
- Cellular adaptation to biomechanical stress across length scales in tissue homeostasis and disease.
Gilbert PM, Weaver VM. Gilbert PM, et al. Semin Cell Dev Biol. 2017 Jul;67:141-152. doi: 10.1016/j.semcdb.2016.09.004. Epub 2016 Sep 15. Semin Cell Dev Biol. 2017. PMID: 27641825 Free PMC article. Review. - New Insights into YES-Associated Protein Signaling Pathways in Hematological Malignancies: Diagnostic and Therapeutic Challenges.
Allegra A, Pioggia G, Innao V, Musolino C, Gangemi S. Allegra A, et al. Cancers (Basel). 2021 Apr 20;13(8):1981. doi: 10.3390/cancers13081981. Cancers (Basel). 2021. PMID: 33924049 Free PMC article. Review. - Targeting the Mevalonate Pathway to Overcome Acquired Anti-HER2 Treatment Resistance in Breast Cancer.
Sethunath V, Hu H, De Angelis C, Veeraraghavan J, Qin L, Wang N, Simon LM, Wang T, Fu X, Nardone A, Pereira R, Nanda S, Griffith OL, Tsimelzon A, Shaw C, Chamness GC, Reis-Filho JS, Weigelt B, Heiser LM, Hilsenbeck SG, Huang S, Rimawi MF, Gray JW, Osborne CK, Schiff R. Sethunath V, et al. Mol Cancer Res. 2019 Nov;17(11):2318-2330. doi: 10.1158/1541-7786.MCR-19-0756. Epub 2019 Aug 16. Mol Cancer Res. 2019. PMID: 31420371 Free PMC article. - Determination of the migration effect and molecular docking of verteporfin in different subtypes of breast cancer cells.
Wei C, Li X. Wei C, et al. Mol Med Rep. 2020 Nov;22(5):3955-3961. doi: 10.3892/mmr.2020.11482. Epub 2020 Sep 2. Mol Med Rep. 2020. PMID: 32901856 Free PMC article. - Extracellular matrix regulation of cell spheroid invasion in a 3D bioprinted solid tumor-on-a-chip.
Dogan E, Galifi CA, Cecen B, Shukla R, Wood TL, Miri AK. Dogan E, et al. Acta Biomater. 2024 Sep 15;186:156-166. doi: 10.1016/j.actbio.2024.07.040. Epub 2024 Aug 7. Acta Biomater. 2024. PMID: 39097123
References
- Burris HA, 3rd, Hurwitz HI, Dees EC, Dowlati A, Blackwell KL, O’Neil B, Marcom PK, Ellis MJ, Overmoyer B, Jones SF, et al. Phase I safety, pharmacokinetics, and clinical activity study of lapatinib (GW572016), a reversible dual inhibitor of epidermal growth factor receptor tyrosine kinases, in heavily pretreated patients with metastatic carcinomas. J Clin Oncol. 2005;23:5305–5313. - PubMed
- Calvo F, Ege N, Grande-Garcia A, Hooper S, Jenkins RP, Chaudhry SI, Harrington K, Williamson P, Moeendarbary E, Charras G, Sahai E. Mechanotransduction and YAP-dependent matrix remodelling is required for the generation and maintenance of cancer-associated fibroblasts. Nat Cell Biol. 2013;15:637–646. - PMC - PubMed
Publication types
MeSH terms
Substances
Grants and funding
- R01 CA192914/CA/NCI NIH HHS/United States
- R01 AG040081/AG/NIA NIH HHS/United States
- R00AG033176/AG/NIA NIH HHS/United States
- R00 AG033176/AG/NIA NIH HHS/United States
- R01AG040081/AG/NIA NIH HHS/United States
LinkOut - more resources
Full Text Sources
Medical
Research Materials
Miscellaneous


