In situ structural analysis of the human nuclear pore complex - PubMed (original) (raw)
. 2015 Oct 1;526(7571):140-143.
doi: 10.1038/nature15381. Epub 2015 Sep 23.
Jan Kosinski # 1, Lenore Sparks # 1, Alessandro Ori 1, Amanda L DiGuilio 2, Benjamin Vollmer 3, Marie-Therese Mackmull 1, Niccolo Banterle 1, Luca Parca 1, Panagiotis Kastritis 1, Katarzyna Buczak 1, Shyamal Mosalaganti 1, Wim Hagen 1, Amparo Andres-Pons 1, Edward A Lemke 1, Peer Bork 1, Wolfram Antonin 3, Joseph S Glavy 2, Khanh Huy Bui 1 4, Martin Beck 1
Affiliations
- PMID: 26416747
- PMCID: PMC4886846
- DOI: 10.1038/nature15381
In situ structural analysis of the human nuclear pore complex
Alexander von Appen et al. Nature. 2015.
Abstract
Nuclear pore complexes are fundamental components of all eukaryotic cells that mediate nucleocytoplasmic exchange. Determining their 110-megadalton structure imposes a formidable challenge and requires in situ structural biology approaches. Of approximately 30 nucleoporins (Nups), 15 are structured and form the Y and inner-ring complexes. These two major scaffolding modules assemble in multiple copies into an eight-fold rotationally symmetric structure that fuses the inner and outer nuclear membranes to form a central channel of ~60 nm in diameter. The scaffold is decorated with transport-channel Nups that often contain phenylalanine-repeat sequences and mediate the interaction with cargo complexes. Although the architectural arrangement of parts of the Y complex has been elucidated, it is unclear how exactly it oligomerizes in situ. Here we combine cryo-electron tomography with mass spectrometry, biochemical analysis, perturbation experiments and structural modelling to generate, to our knowledge, the most comprehensive architectural model of the human nuclear pore complex to date. Our data suggest previously unknown protein interfaces across Y complexes and to inner-ring complex members. We show that the transport-channel Nup358 (also known as Ranbp2) has a previously unanticipated role in Y-complex oligomerization. Our findings blur the established boundaries between scaffold and transport-channel Nups. We conclude that, similar to coated vesicles, several copies of the same structural building block--although compositionally identical--engage in different local sets of interactions and conformations.
Figures
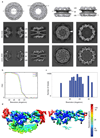
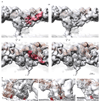
Extended Data Figure 1. Tomographic map of the human NPC.
(a) Orthoslices through the nucleocytoplasmic axis, CR, IR, and NR of a tomographic structure of the human NPC obtained using a direct electron detector (this study) compared to a structure obtained with a conventional detector using a similar experimental workflow (emd_2444). In both cases, the CR, IR and NR were aligned independently. The arrowhead indicates a transmembrane domain that is resolved in the IR. (b) Fourier shell correlation curves of the CR, IR and NR regions. (c) Histogram corresponding to the color-coded local resolution map shown in (d) that was calculated using ResMap . (d) A single segment of the NR ring is shown (in all other figures the segments are shown jointly with their anterior and/or posterior asymmetric unit) at two different isosurface thresholds. The redundant density of the outer Nup43 beta propeller (horizontal arrowhead) and the Nup133 middle domain (vertical arrowhead) of two neighboring asymmetric units are indicated for orientation. The reduced resolution at the edges is due to the border of the mask used during alignment and averaging that covered about 1.5 times the asymmetric unit.
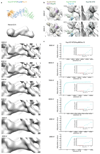
Extended Data Figure 2. B-factor correction.
X-ray structures filtered to the overall resolution of the tomographic map were compared to tomographic maps corrected with different B-factors to choose an appropriate B-factor. (a) X-ray structure of Nup107/Nup96/Sec13 at (top) and filtered to 23 Å (below) as compared to respective region of the outer vertex corrected with B-factors ranging from 2000 – 9000 A2. (b) B-factors of 6000 – 8000 A2 most realistically resemble features of the X-ray structures. Three regions of the tomographic map are superimposed with the respective X-ray structures at B-factors of 6000 A2 in comparison to 8000 A2. In these well-resolved regions, additional features such as more detailed shapes of beta propellers or the Nup107 finger domain (see also Fig. 2a, b; Extended Data Fig. 4e) are apparent at 8000 A2. Due to local deviations in resolution (Extended Data Fig. 1c, d) a more conservative B-factor of 6000 A2 was chosen to correct the averages. Asterisks mark structures that can be unambiguously positioned but have some uncertainty in their orientation, that is the Nup85-CTD. (c) Systematic fitting of the X-ray structure of Nup107/Nup96/Sec13 into the tomographic map as shown in Extended Data Fig. 7a but at different B-factors. Adjusted p-values are shown ranked; the four true positive hits are shown in red in the inset. The latter are consistently identified as top hits, except when a B-factor of 9000 A2 is used.
Extended Data Figure 3. Comparison of hybrid model of the Y-complex to the X-ray structure of the vertex region .
The hybrid model of the Y-complex (NR) shown on the left side was generated independently from the coordinates X-ray structure of the vertex shown on the right side. The structures of Y-complex members were fitted into the tomographic map based on spatial restraints and complementary information (see Supplementary Table 1 for detail). The outer and inner Y-complexes/vertices are shown separately on the top and the bottom. The molecular weight of one human Y-complex is approximately 1 MDa, the majority of which is structured. Asterisks mark structures that can be unambiguously positioned but have some uncertainty in their orientation. Those are the beta propellers of Elys and Nup133 as well as Nup85-CTD.
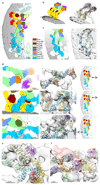
Extended Data Figure 4. The inner and outer Y-complexes have distinct conformations and engage in locally specific sets of interactions.
(a) Arrangement of the inner and outer Y-complex as seen from above. X-ray structures were filtered to 2.3 nm resolution and colored by protein. Positions of the five interfaces between Y-complexes are indicated. (b) The inner and outer copies of Nup160 assume the same normal vector with respect to the membrane and are slightly tilted to each other because of the different diameters from the central axis. (c) The hinges between the Nup107 C- and N-terminal domains as well as within the Nup133 C-terminal domain have a different conformation in the inner and outer Y-complex. In the case of the inner stem, the middle domain of Nup133 appears slightly bent inwards compared to the conformation revealed in the X-ray structure, which can be accounted for by introducing a hinge, as previously predicted based on the Nup133 structure . (d) Zoomed-in views showing details of five interfaces (I–V). The panels on the right indicate the viewing point. (I) Sec13 of the outer vertex interfaces with the Nup107 N-terminal domain of the inner vertex ,; (II) the N-terminal beta propeller of Nup133 interfaces with Nup160 of the posterior asymmetric unit in the case of both Y-complexes, forming the head-to-tail contact that facilitates ring formation ,; (III) therefore, only the beta propeller of the inner copy of Nup133 is sandwiched between both Nup160s. In this case, the N-terminal alpha-helical domain extends into a larger interface with the outer Nup160 of the posterior asymmetric unit; (IV) the very C-terminus of the inner Nup133 branches out of the inner stem to form a contact with its counterpart on the outer stem. This relatively small interface is reminiscent of a crystal contact observed in the Nup133–Nup107 structure (pdb code: 3I4R); and (V) Nups 85 and 43 of the outer vertex form an interface with the C-terminal domain of Nup107 of the inner stem. (e) The Nup107 finger domain (red) is exclusive to higher eukaryotes. While its inner copy (shown) interfaces with Nup43 and Nup85 of the outer vertex, its outer copy interfaces with the density connecting both Y-complexes (Fig. 2a, b). A phosphorylation site in the finger domain is depicted as dark red spheres. Asterisks mark structures that can be unambiguously positioned but have some uncertainty in their orientation, that is Nup85-CTD. (f) Vertex region of the CR as seen from the central channel. Phosphorylation sites are represented as in (e). The density connecting both Y-complexes is segmented as in Fig. 2b and is in close contact with several phosphorylation sites in Sec13, Nup96 and Nup107. Phosphorylation sites in Seh1 and Nup85 are in direct proximity to the Nup214 complex region.
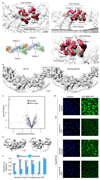
Extended Data Figure 5. Connection of the inner and outer Y-complexes.
(a) Four clamp-shaped densities (segmented red) emanate from the Nup96/107 region of both Y-complexes in the CR. Only the inner clamps connect both Y-complexes, whereas the outer ones protrude into a more complex substructure at the outer periphery of the CR (Fig. 2b). (b) Same as in Fig. 2c, d but for the NR. (c) Volcano plot visualizing shotgun proteomics data obtained of HeLa cells in the Nup358 knockdown (treatment) as compared to the control condition. (d) Nuclear transport assays of NLS-MBP-GFP in non-treated cells and the Nup358 knockdown condition. Cargos with a classical nuclear localization signal are imported in the absence of Nup358 as previously observed although a lower efficacy cannot be excluded. (e) Classification of subtomograms of the knockdown condition reveals that approximately 5% of all asymmetric units contain an outer Y-complex in the CR, which is in excellent agreement with the knockdown efficiency of ∼95%. Classification was done on the level of asymmetric units. Transferred to the level of NPCs, it suggests that out of 920 NPCs observed under gene silencing conditions, 663 had no outer Y-complex in the CR, 183 had one, 49 had two, 14 had three, 4 had four, 6 had five, 0 had six, 1 had seven and 0 had eight. (e) The observed adjacency of outer Y-complexes in the CR under knockdown conditions was much higher than expected. The 5% of asymmetric units that contained outer Y-complexes in the CR were analyzed on the NPC level to determine whether their neighboring asymmetric units also contained outer Y-complexes in the CR. The observed frequency of adjacency is shown in dark blue. The respective total number of observed outer Y-complexes in the CR and the number of the ones that had adjacent partners is indicated as (n/m). The observed frequency is considerably elevated over the theoretical frequency (shown in bright blue) that would be expected if Y-complexes would bind to random subunits. This observation implies cooperativity for Y-complex assembly/maintenance within the CR that might arise through the head to tail contact of adjacent Y-complexes. NPCs with 0, 1 and 8 outer Y-complexes per CR are not shown because they cannot contain any adjacent Y-complexes or were not observed, respectively.
Extended Data Figure 6. Structural signatures of inner ring scaffold Nups and membrane binding motifs of Nup160 and Nup133.
(a) Same as Fig. 3a but for the CR. (b) Fits of Nup160 (left) of the outer (orange) and inner (grey) Y-complexes into the NR are shown. Additional density accounting for the C-terminal domain of Elys is indicated. Fits of Nup133 are shown at normal (center) and high (right) isosurface thresholds. At the higher isosurface threshold, density linking both Nup133 domains is apparent also in the outer stem. The membrane-binding motifs are colored red. Asterisks mark structures that can be unambiguously positioned but have some uncertainty in their orientation. Those are the beta propellers of Elys and Nup133 as well as Nup85-CTD.
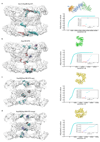
Extended Data Figure 7. Systematic fitting of selected NPC components to the EM map.
Each panel shows the 20 best-scoring fits (left), a plot of p-values for all the solutions (right) and the top solutions in the inset. The models used for fitting are shown as ribbon representation. The fits and data points are colored according to the groups with similar p-value ranges. The group of fits with the best p-values is colored red (high-confidence fits), the second-best group (medium-confidence fits) blue, and all remaining - cyan. The membrane density has been removed for clarity. (a) The Sec13–Nup96–Nup107 subcomplex, for which the ground-truth is known because it is part of the vertex. (b–d) same as (a) but for the N-terminal domains of Nup155 , the open conformation of Nup205/188-NTD (template Nup205) and the closed conformation of Nup205/188-NTD (template Nup188), respectively.
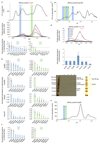
Extended Data Figure 8. Co-elution analysis to detect weak nucleoporin interactions.
To detect weak interactions of scaffold nucleoporins we combined rapid affinity isolation with gel filtration and quantitative targeted proteomics to measure absolute protein abundances. Hek293 cells expressing various affinity-tagged Nups (in contrast to Fig. 3c without nocodazole arrest) were lysed using mild conditions and sonication for protein solubilization. Affinity isolates were subjected to gel-filtration and all fractions were analyzed using targeted mass spectrometry, as previously described , to measure protein abundances in the high and low molecular weight fractions. The high-molecular-weight fractions will be indicative of potential outgoing interactions of large molecular species. The low molecular weight fraction will highlight smaller fragments that occur after sonication. In case of affinity tagged Nup85 (a) the top panel shows the 215 nm absorption curve of the gel-filtration experiment. The middle panel shows the arbitrary protein abundance units of Y-complex members in all fractions (red for Nup85, black for all other Y-complex members). Protein abundances (normalized to the affinity tagged protein) in the high-molecular-weight fractions (blue bar) and low-molecular-weight fraction (green bar) are shown as bar charts in the bottom panel. The low molecular weight peak corresponds to the small arm proteins (Nup85, Seh1 and Nup43) the high molecular weight peak to the intact Y-complex. (b) The same approach was applied to Nup205, Nup93 and Nup155. The seven most abundant co-eluting Nups are shown for the high-molecular-weight fractions (blue bar plots) and low-molecular weight fraction (green bar plots). In case of Nup85 (top) the seven most abundant proteins apart from the Y-complex members are shown. Weak interactions of Y-complex members with Nups 205 and 93 are apparent. In case of Nup155, weak interactions are detected with CR and NR members, as well as Sec13 that localizes to the proximity of the C-term domain of Nup155 when fitted into the density connecting the IR with CR/NR. Tpr was excluded from this analysis since it was present in all fractions. Protein abundances based on single reference peptides are marked with an asterisk. (c) Same as (a, top panel) but for Nup188 affinity purified from nocodazole arrested cells. (d) Same as Fig. 3c but for Nup188 affinity purified from nocodazole arrested cells. Co-eluting species in the high molecular weight fraction are similar to the ones observed for affinity-purified Nup62 (Fig 3c). Isostoichiometric amounts of Nups 188, 98, 93, 62 and an enrichment of Nups 214, 88 and Rae1 were detected. The Nup188–Nup93 heterodimer thus binds to Nups that are well-established components of the CR, which is consistent with the systematic fitting approach. (e) Same as (c) but corresponding to Fig. 3c. (f) Same as (b; second panel for Nup205) but for nocodazole-arrested cells. In case of Nup205, the co-purifying species are overall similar in nocodazole-arrested as compared to untreated cells.
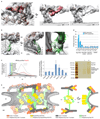
Figure 1. Tomographic map of the human NPC.
(a) The structure is shown cut in half (membranes in dark grey). (b) Segment of the NR with the two staggered inner (grey) and outer Y-complexes with their anterior and posterior counterparts (colored grey and orange). Color code according to the scheme on top (beta propellers highlighted with black strokes). Asterisks mark structures that can be unambiguously positioned but have some uncertainty in their orientation. (c) The small arm region of the inner and outer vertices is shown with two different isosurface thresholds. The fits of Nup85–Seh1, Nup43 and Sec13–Nup96–Nup107 are shown superimposed.
Figure 2. Nup358 complex stabilizes the CR.
The connecting density (red) between the inner (grey) and outer (orange) Y-complexes differs in the NR (a) as compared to the CR (b). While the finger domain of Nup107 (dotted lines) is engaged with the connecting density, its inner counterpart is engaged with Nup43. Asterisks mark structures that can be unambiguously positioned but have some uncertainty in their orientation (c, d) Removal of Nup358 complex causes loss of the outer Y-complex in the CR but not NR (Extended Data Fig. 5). Tomographic structures are shown for the control (WT, c) and knockdown condition (KD, d). (e) Stoichiometric measurements show that in contrast to nuclear oriented Nups, Y-complex members are reduced by ∼20% upon Nup358 knockdown (combined p-value excluding Elys: 1.31e-6; one-sided Welch t-test combined using Fisher's method; error bars indicate median absolute deviation across three biological replicates and multiple independent peptides).
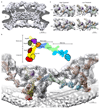
Figure 3. Scaffold architecture of the human NPC.
(a) Question mark shaped density (red) in the vertex region of the NR (arrowhead indicates Nup43). (b) Fit Nup155 (green) into the rod-shaped density connecting the outer rings with the IR. The membrane-binding motif (red) dips into the outer lipid bilayer. Asterisks mark structures that can be unambiguously positioned but have some uncertainty in their orientation. (c) Nups188 and 93 copurify with Nup214 complex. Nup62 was affinity-purified from nocodazole-arrested cells. The eluate was subjected to size exclusion chromatography. Arbitrary protein abundances measured in the fractions (left) using targeted mass spectrometry are shown for the Nup62 complex (grey; Nup62 in red) and Nup214 complex members (black). Protein abundances within fraction one (blue) are shown as bar chart (center; error bars indicate the standard deviation of multiple independent peptides). A silver-stained SDS-PAGE of fractions one and two is shown on the right. (d) Binding of X. laevis Nup155, the L267D mutant, the 258–267 deletion or SUMO (negative control) to liposomes with a nuclear envelope lipid composition or DOPC liposomes of different sizes were analyzed in flotation experiments and quantified by western blotting (columns are the average bound quantities of three independent experiments, individual data points are indicated). (e) Scheme of the human nuclear pore scaffold architecture.
Similar articles
- Molecular architecture of the inner ring scaffold of the human nuclear pore complex.
Kosinski J, Mosalaganti S, von Appen A, Teimer R, DiGuilio AL, Wan W, Bui KH, Hagen WJ, Briggs JA, Glavy JS, Hurt E, Beck M. Kosinski J, et al. Science. 2016 Apr 15;352(6283):363-5. doi: 10.1126/science.aaf0643. Science. 2016. PMID: 27081072 Free PMC article. - Architecture of the cytoplasmic face of the nuclear pore.
Bley CJ, Nie S, Mobbs GW, Petrovic S, Gres AT, Liu X, Mukherjee S, Harvey S, Huber FM, Lin DH, Brown B, Tang AW, Rundlet EJ, Correia AR, Chen S, Regmi SG, Stevens TA, Jette CA, Dasso M, Patke A, Palazzo AF, Kossiakoff AA, Hoelz A. Bley CJ, et al. Science. 2022 Jun 10;376(6598):eabm9129. doi: 10.1126/science.abm9129. Epub 2022 Jun 10. Science. 2022. PMID: 35679405 Free PMC article. - Structure of the cytoplasmic ring of the Xenopus laevis nuclear pore complex.
Zhu X, Huang G, Zeng C, Zhan X, Liang K, Xu Q, Zhao Y, Wang P, Wang Q, Zhou Q, Tao Q, Liu M, Lei J, Yan C, Shi Y. Zhu X, et al. Science. 2022 Jun 10;376(6598):eabl8280. doi: 10.1126/science.abl8280. Epub 2022 Jun 10. Science. 2022. PMID: 35679404 - Structural analysis of the nuclear pore complex by integrated approaches.
Elad N, Maimon T, Frenkiel-Krispin D, Lim RY, Medalia O. Elad N, et al. Curr Opin Struct Biol. 2009 Apr;19(2):226-32. doi: 10.1016/j.sbi.2009.02.009. Epub 2009 Mar 25. Curr Opin Struct Biol. 2009. PMID: 19327984 Review. - Structure and Assembly of the Nuclear Pore Complex.
Hampoelz B, Andres-Pons A, Kastritis P, Beck M. Hampoelz B, et al. Annu Rev Biophys. 2019 May 6;48:515-536. doi: 10.1146/annurev-biophys-052118-115308. Epub 2019 Apr 3. Annu Rev Biophys. 2019. PMID: 30943044 Review.
Cited by
- Rapid Brownian Motion Primes Ultrafast Reconstruction of Intrinsically Disordered Phe-Gly Repeats Inside the Nuclear Pore Complex.
Moussavi-Baygi R, Mofrad MR. Moussavi-Baygi R, et al. Sci Rep. 2016 Jul 29;6:29991. doi: 10.1038/srep29991. Sci Rep. 2016. PMID: 27470900 Free PMC article. - HIV-1 Capsid Core: A Bullet to the Heart of the Target Cell.
Toccafondi E, Lener D, Negroni M. Toccafondi E, et al. Front Microbiol. 2021 Apr 1;12:652486. doi: 10.3389/fmicb.2021.652486. eCollection 2021. Front Microbiol. 2021. PMID: 33868211 Free PMC article. Review. - Nucleoporin Nup155 is part of the p53 network in liver cancer.
Holzer K, Ori A, Cooke A, Dauch D, Drucker E, Riemenschneider P, Andres-Pons A, DiGuilio AL, Mackmull MT, Baßler J, Roessler S, Breuhahn K, Zender L, Glavy JS, Dombrowski F, Hurt E, Schirmacher P, Beck M, Singer S. Holzer K, et al. Nat Commun. 2019 May 14;10(1):2147. doi: 10.1038/s41467-019-10133-z. Nat Commun. 2019. PMID: 31089132 Free PMC article. - Integrative structure and functional anatomy of a nuclear pore complex.
Kim SJ, Fernandez-Martinez J, Nudelman I, Shi Y, Zhang W, Raveh B, Herricks T, Slaughter BD, Hogan JA, Upla P, Chemmama IE, Pellarin R, Echeverria I, Shivaraju M, Chaudhury AS, Wang J, Williams R, Unruh JR, Greenberg CH, Jacobs EY, Yu Z, de la Cruz MJ, Mironska R, Stokes DL, Aitchison JD, Jarrold MF, Gerton JL, Ludtke SJ, Akey CW, Chait BT, Sali A, Rout MP. Kim SJ, et al. Nature. 2018 Mar 22;555(7697):475-482. doi: 10.1038/nature26003. Epub 2018 Mar 14. Nature. 2018. PMID: 29539637 Free PMC article. - Biallelic Variants in the Nuclear Pore Complex Protein NUP93 Are Associated with Non-progressive Congenital Ataxia.
Zanni G, De Magistris P, Nardella M, Bellacchio E, Barresi S, Sferra A, Ciolfi A, Motta M, Lue H, Moreno-Andres D, Tartaglia M, Bertini E, Antonin W. Zanni G, et al. Cerebellum. 2019 Jun;18(3):422-432. doi: 10.1007/s12311-019-1010-5. Cerebellum. 2019. PMID: 30741391
References
Publication types
MeSH terms
Substances
LinkOut - more resources
Full Text Sources
Other Literature Sources
Miscellaneous
