ZEB1 induces LOXL2-mediated collagen stabilization and deposition in the extracellular matrix to drive lung cancer invasion and metastasis - PubMed (original) (raw)
. 2017 Apr 6;36(14):1925-1938.
doi: 10.1038/onc.2016.358. Epub 2016 Oct 3.
C Ungewiss 1 2, P Tong 3, L A Byers 1, J Wang 3, J R Canales 4, P A Villalobos 4, N Uraoka 4, B Mino 4, C Behrens 1, I I Wistuba 4, R I Han 5, C A Wanna 5, M Fahrenholtz 5, K J Grande-Allen 5, C J Creighton 3 6, D L Gibbons 1 7
Affiliations
- PMID: 27694892
- PMCID: PMC5378666
- DOI: 10.1038/onc.2016.358
ZEB1 induces LOXL2-mediated collagen stabilization and deposition in the extracellular matrix to drive lung cancer invasion and metastasis
D H Peng et al. Oncogene. 2017.
Abstract
Lung cancer is the leading cause of cancer-related deaths, primarily due to distant metastatic disease. Metastatic lung cancer cells can undergo an epithelial-to-mesenchymal transition (EMT) regulated by various transcription factors, including a double-negative feedback loop between the microRNA-200 (miR-200) family and ZEB1, but the precise mechanisms by which ZEB1-dependent EMT promotes malignancy remain largely undefined. Although the cell-intrinsic effects of EMT are important for tumor progression, the reciprocal dynamic crosstalk between mesenchymal cancer cells and the extracellular matrix (ECM) is equally critical in regulating invasion and metastasis. Investigating the collaborative effect of EMT and ECM in the metastatic process reveals increased collagen deposition in metastatic tumor tissues as a direct consequence of amplified collagen gene expression in ZEB1-activated mesenchymal lung cancer cells. In addition, collagen fibers in metastatic lung tumors exhibit greater linearity and organization as a result of collagen crosslinking by the lysyl oxidase (LOX) family of enzymes. Expression of the LOX and LOXL2 isoforms is directly regulated by miR-200 and ZEB1, respectively, and their upregulation in metastatic tumors and mesenchymal cell lines is coordinated to that of collagen. Functionally, LOXL2, as opposed to LOX, is the principal isoform that crosslinks and stabilizes insoluble collagen deposition in tumor tissues. In turn, focal adhesion formation and FAK/SRC signaling is activated in mesenchymal tumor cells by crosslinked collagen in the ECM. Our study is the first to validate direct regulation of LOX and LOXL2 by the miR-200/ZEB1 axis, defines a novel mechanism driving tumor metastasis, delineates collagen as a prognostic marker, and identifies LOXL2 as a potential therapeutic target against tumor progression.
Conflict of interest statement
CONFLICT OF INTEREST
The authors declare no conflict of interest.
Figures
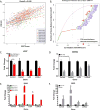
Figure 1. Expression of collagen and ECM-associated genes correlates with EMT
(A) Representative plot correlating gene expression of collagen 1A1 to EMT scores of human tumors from TCGA datasets (BASAL: Basal-like breast cancer; BCLA: Bladder Urothelial Carcinoma; BRCA: Breast invasive carcinoma; COAD: Colon adenocarcinoma; HNSC: Head and Neck squamous cell carcinoma; LUAD: Lung adenocarcinoma; LUSC: Lung squamous cell carcinoma; OVCA: Ovarian carcinoma). (B) Graph showing the fraction of genes from TCGA dataset analysis below the correlation value to EMT score. Purple line represents genes that are not associated with the ECM but still correlated with EMT gene signatures. ECM-related genes are represented by the red line with collagen-associated genes specifically denoted by green points. Collagen genes above a high correlation cutoff (r>0.5), as indicated by the red asterisks, were selected for further validation. Red arrows indicate qPCR validated collagen-associated genes that were consistently downregulated by miR-200, upregulated by Zeb1, and selected for further analyses. (C, D) qPCR analysis for relative expression of COL1A1, COL3A1, LOX, and LOXL2 in human H157 and murine 344SQ mesenchymal lung cancer cell lines with inducible and stable miR-200 expression, respectively. (E, F) qPCR analysis for relative expression of COL1A1, COL3A1, LOX, and LOXL2 in human H441 and murine 393P epithelial lung cancer cell lines with inducible and stable Zeb1 expression, respectively. Asterisks (*) for qPCR data indicate significance value of p<0.01.
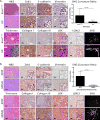
Figure 2. Metastatic lung tumors have increased collagen deposition and linearization
(A) Hematoxylin and eosin (H&E), Masson’s trichrome, Zeb1, E-cadherin, Vimentin, collagen type I/type III, LOX, and LOXL2 immunohistochemical (IHC) stains, and second harmonics generation (SHG) microscopy of lung tumor tissues from non-metastatic KrasG12D and metastatic KrasG12D;p53R172H (KP) mice (n=5 tissues per group). (B) Staining of primary syngeneic tumor tissues generated by subcutaneous injection of non-metastatic 393P and metastatic 344SQ murine lung cancer cell lines in syngeneic mice (n=10 tumors per group). Upper right corners: Quantification of curvature ratio for individual collagen fibers (n=50 collagen fibers per sample) imaged by SHG microscopy of tumor tissues from (A) and (B). Microscopy images were captured at 20× magnification, scale bars represent 50 μm.
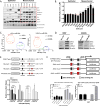
Figure 3. LOX and LOXL2 levels are higher in metastatic lung tumors and are directly regulated by miR-200 and Zeb1, respectively
(A) Top: Western blot analysis of Zeb1, Snail1, N-cadherin, Vimentin, LOX, LOXL2, and β-actin (loading control) in a panel of epithelial or mesenchymal murine KP lung cancer cell lines. Bottom: Western blot of secreted LOX and LOXL2 in conditioned media of murine panel cell lines. (B) Amplex Red assay to determine LOX/LOXL2 enzymatic activity in conditioned media of murine cell line panel. (*): p<0.05 and (**): p<0.01. (C) Cluster plots of normalized miR-200c and LOX or LOXL2 mRNA levels in epithelial and mesenchymal murine lung cancer cell lines. 393P-Zeb1 and 344SQ-miR200 cells have also been included in the analysis. Data points represent mean ± SD (n = 3 samples). Spearman’s rank correlation used for co-expression analysis. (D) Western blot analysis of Zeb1, LOX, LOXL2, and β-actin in epithelial 393P and mesenchymal 344SQ cell lines with constitutive Zeb1 or miR-200a/b/429 expression, respectively. (E) Top: Schematic of luciferase reporter constructs for wild-type (WT) mouse LOX-3′UTR and mutated potential miR-200b/c binding sites. Bottom: Relative luciferase activity of LOX-3′UTR reporter constructs above, co-transfected with non-targeting control miRNA, miR-200a, miR-200b, or miR-200c precursors in 344SQ cells. Three experimental replicates were performed with three technical replicates per experiment. (F) Top: Schematic of luciferase reporter constructs for mouse LOXL2 promoter region containing predicted Zeb1 and Ets1 binding sites. Mutations of potential Zeb1 binding sites indicated with red X and location of qPCR primers to amplify the region containing potential Zeb1 binding sites indicated by black arrows. Bottom-Left: Relative luciferase activity of LOXL2 reporter constructs above transfected into epithelial 393P cells with vector control or Zeb1 expression. Bottom-Right: Fold enrichment by qPCR analysis of LOXL2 promoter segments containing potential Zeb1 binding sites after chromatin immunoprecipitation in 393P-pcDNA vector control and 393P-Zeb1 cells, using Zeb1 antibody or mock IgG control antibody.
Figure 4. LOX enzymatic function is necessary for lung cancer cell migration and invasion
(A) Amplex Red assay to determine LOX/LOXL2 enzymatic activity in conditioned media of 344SQ and 393P-Zeb1 cells with or without 500 μM BAPN treatment. (B) Transwell migration and invasion through collagen for 344SQ cells treated with 500 μM BAPN. (C) 393P cells with constitutive Zeb1 expression cultured in a 3D matrix consisting of 1.5 mg/ml collagen/Matrigel mixture for 7 days, treated with 500 μM BAPN. (D) Transwell migration and invasion through collagen for 344SQ cells treated with 300 μM D-Penicillamine (D-Pen). (E) 393P cells with constitutive Zeb1 expression cultured in a 3D matrix consisting of 1.5 mg/ml collagen/Matrigel mixture for 7 days, treated with 300 μM D-Pen. Quantification of fraction of invasive structures in 3D culture assays to the right (n = 50 structures counted per condition). Microscopy images were captured at 4× magnification, scale bars represent 200 μm.
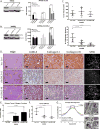
Figure 5. LOXL2 is necessary for collagen deposition, crosslinking and tumor cell metastasis
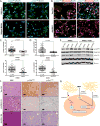
(A) Left: Western blot of LOX protein levels after stable shRNA knockdown in 344SQ cells. Right: Transwell migration and invasion through Matrigel and collagen for 344SQ cells with LOX knockdown. (B) Left: Western blot of LOXL2 protein levels after stable shRNA knockdown in 344SQ cells. Right: Transwell migration and invasion through Matrigel and collagen for 344SQ cells with LOXL2 knockdown. (C) Top: Primary subcutaneous tumor volume of 344SQ cells with stable LOXL2 knockdown injected in syngeneic wild type mice. Bottom: Quantification of lung metastatic surface nodules after subcutaneous injection of 344SQ cells with stable LOXL2 knockdown in syngeneic wild type mice. (D) H&E and IHC stains of LOXL2, collagen type I, and type III along with SHG microscopy of primary syngeneic tumor tissues from 344SQ cells with either a vector control or stable LOXL2 knockdown. Microscopy images were captured at 20× magnification, scale bars represent 50 μm. (E) Quantification of curvature ratio for individual collagen fibers imaged by SHG microscopy of tumor tissues from (D). (F) Mechanical stiffness measurements of tumor tissues from in D and E. (G) Right: Scanning electron microscopy (SEM) images of 2 mg/ml collagen gels after culturing 344SQ cells with or without LOXL2 knockdown. Images were viewed at 10kV and images were captured at 10kX magnification. Scale bars, 5 μm (n = 3 collagen gel molds per cell line). Left: Alignment analysis of collagen fibers to determine linearity and organization of collagen fibers as described in Methods section. The Kuiper test was used to test for differences in alignment between the sets of decimated data with significance as indicated.
Figure 6. LOXL2-mediated collagen deposition induces FAK/Src signaling in vitro and in vivo
(A) Immunofluorescent staining of p-FAKY861 and p-SrcY416 (green dots) in 344SQ cells treated with 5 ng/ml TGF-β for 48 hours in the presence or absence of 500 μM BAPN. (B) Immunofluorescent staining of p-FAKY861, p-SrcY416 (green dots), and β-catenin (red) in 344SQ cells after stable shRNA knockdown of LOXL2. β-catenin used as a marker to identify cell membrane. (C) Quantification of p-FAKY861 and p-SrcY416 signal per cell from immunofluorescent stains in (A). (D) Quantification of p-FAKY861 and p-SrcY416 signal per cell from immunofluorescent stains in (B). (E) Western blot of p-FAKY861, total FAK, p-SrcY416, and total Src in 344SQ cells ± 5 ng/ml TGF-β treatment for 48 hours in the presence of 500 µM BAPN, with stable LOX or LOXL2 knockdown. (F) H&E and IHC stains of p-FAKY861 and p-SrcY416 of primary tumor tissues from subcutaneous injection of 344SQ cells with stable LOXL2 knockdown in syngeneic wild type mice. Microscopy images captured at 20× magnification, scale bars represent 50 μm. (G) Proposed model demonstrating Zeb1 regulation of collagen deposition in the tumor microenvironment through LOXL2 crosslinking and stabilization, activating the Integrin β1/FAK/Src signaling pathway in an autocrine manner leading to invasion and metastasis.
Figure 7. Increased collagen, LOX, and LOXL2 expression predicts poor prognosis among patients with lung adenocarcinoma
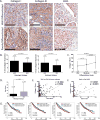
(A) Well differentiated and poorly differentiated human lung adenocarcinoma tissue sections IHC stained for collagen type I, collagen type III, and Zeb1. Scale bars, 200 μm. (B) Percent stromal area of tumor tissues with collagen type I or type III expression in patients with lung adenocarcinoma (ACC) or squamous cell carcinoma (SCC). (C) Average final cytoplasmic H-score of collagen type I expression in lung adenocarcinomas of different grades. (D) Average final nuclear H-score of Zeb1 in tumor cells of ADC or SCC specimens. (E) Cluster plot analysis of Spearman’s rank correlation between Zeb1 and collagen I H-score in both ADC and SCC specimens. (F) Cluster plot analysis of Spearman’s rank correlation between Zeb1 and collagen I H-score in ADC samples. (G) Kaplan-Meier survival analysis by log-rank significance test of COL1A1, COL3A1, LOX, and LOXL2 mRNA expression levels versus overall lung cancer patient survival from a compendium expression dataset of 1,586 lung adenocarcinoma cases. P-values by log-rank test.
Similar articles
- The microRNA-200/Zeb1 axis regulates ECM-dependent β1-integrin/FAK signaling, cancer cell invasion and metastasis through CRKL.
Ungewiss C, Rizvi ZH, Roybal JD, Peng DH, Gold KA, Shin DH, Creighton CJ, Gibbons DL. Ungewiss C, et al. Sci Rep. 2016 Jan 5;6:18652. doi: 10.1038/srep18652. Sci Rep. 2016. PMID: 26728244 Free PMC article. - UBE2C, Directly Targeted by miR-548e-5p, Increases the Cellular Growth and Invasive Abilities of Cancer Cells Interacting with the EMT Marker Protein Zinc Finger E-box Binding Homeobox 1/2 in NSCLC.
Jin D, Guo J, Wu Y, Du J, Wang X, An J, Hu B, Kong L, Di W, Wang W. Jin D, et al. Theranostics. 2019 Mar 17;9(7):2036-2055. doi: 10.7150/thno.32738. eCollection 2019. Theranostics. 2019. PMID: 31037155 Free PMC article. Retracted. - Lysyl oxidase-like 2 (LOXL2) and E47 EMT factor: novel partners in E-cadherin repression and early metastasis colonization.
Canesin G, Cuevas EP, Santos V, López-Menéndez C, Moreno-Bueno G, Huang Y, Csiszar K, Portillo F, Peinado H, Lyden D, Cano A. Canesin G, et al. Oncogene. 2015 Feb 19;34(8):951-64. doi: 10.1038/onc.2014.23. Epub 2014 Mar 17. Oncogene. 2015. PMID: 24632622 - LOXL2 in cancer: regulation, downstream effectors and novel roles.
Wen B, Xu LY, Li EM. Wen B, et al. Biochim Biophys Acta Rev Cancer. 2020 Dec;1874(2):188435. doi: 10.1016/j.bbcan.2020.188435. Epub 2020 Sep 22. Biochim Biophys Acta Rev Cancer. 2020. PMID: 32976981 Review. - LOXL2 in epithelial cell plasticity and tumor progression.
Cano A, Santamaría PG, Moreno-Bueno G. Cano A, et al. Future Oncol. 2012 Sep;8(9):1095-108. doi: 10.2217/fon.12.105. Future Oncol. 2012. PMID: 23030485 Review.
Cited by
- The GJB3 correlates with the prognosis, immune cell infiltration, and therapeutic responses in lung adenocarcinoma.
Dou R, Liu R, Su P, Yu X, Xu Y. Dou R, et al. Open Med (Wars). 2024 Aug 10;19(1):20240974. doi: 10.1515/med-2024-0974. eCollection 2024. Open Med (Wars). 2024. PMID: 39135979 Free PMC article. - A novel CpG-based signature for survival prediction of lung adenocarcinoma patients.
Zheng R, Xu H, Mao W, Du Z, Wang M, Hu M, Gu X. Zheng R, et al. Exp Ther Med. 2020 Jan;19(1):280-286. doi: 10.3892/etm.2019.8200. Epub 2019 Nov 15. Exp Ther Med. 2020. PMID: 31853300 Free PMC article. - Targeting immunosuppressive Ly6C+ classical monocytes reverses anti-PD-1/CTLA-4 immunotherapy resistance.
Rodriguez BL, Chen L, Li Y, Miao S, Peng DH, Fradette JJ, Diao L, Konen JM, Alvarez FRR, Solis LM, Yi X, Padhye A, Gibson LA, Ochieng JK, Zhou X, Wang J, Gibbons DL. Rodriguez BL, et al. Front Immunol. 2023 Jun 28;14:1161869. doi: 10.3389/fimmu.2023.1161869. eCollection 2023. Front Immunol. 2023. PMID: 37449205 Free PMC article. - A positive feedback between IDO1 metabolite and COL12A1 via MAPK pathway to promote gastric cancer metastasis.
Xiang Z, Li J, Song S, Wang J, Cai W, Hu W, Ji J, Zhu Z, Zang L, Yan R, Yu Y. Xiang Z, et al. J Exp Clin Cancer Res. 2019 Jul 17;38(1):314. doi: 10.1186/s13046-019-1318-5. J Exp Clin Cancer Res. 2019. PMID: 31315643 Free PMC article. - Lung Cancer Models Reveal Severe Acute Respiratory Syndrome Coronavirus 2-Induced Epithelial-to-Mesenchymal Transition Contributes to Coronavirus Disease 2019 Pathophysiology.
Stewart CA, Gay CM, Ramkumar K, Cargill KR, Cardnell RJ, Nilsson MB, Heeke S, Park EM, Kundu ST, Diao L, Wang Q, Shen L, Xi Y, Zhang B, Della Corte CM, Fan Y, Kundu K, Gao B, Avila K, Pickering CR, Johnson FM, Zhang J, Kadara H, Minna JD, Gibbons DL, Wang J, Heymach JV, Byers LA. Stewart CA, et al. J Thorac Oncol. 2021 Nov;16(11):1821-1839. doi: 10.1016/j.jtho.2021.07.002. Epub 2021 Jul 16. J Thorac Oncol. 2021. PMID: 34274504 Free PMC article.
References
- Siegel R, Ma J, Zou Z, Jemal A. Cancer statistics, 2014. CA Cancer J Clin. 2014;64(1):9–29. - PubMed
- Gregory PA, Bert AG, Paterson EL, Barry SC, Tsykin A, Farshid G, et al. The miR-200 family and miR-205 regulate epithelial to mesenchymal transition by targeting ZEB1 and SIP1. Nat Cell Biol. 2008;10(5):593–601. - PubMed
Publication types
MeSH terms
Substances
LinkOut - more resources
Full Text Sources
Other Literature Sources
Medical
Molecular Biology Databases
Miscellaneous
