Insulin Receptor and GPCR Crosstalk Stimulates YAP via PI3K and PKD in Pancreatic Cancer Cells - PubMed (original) (raw)
Insulin Receptor and GPCR Crosstalk Stimulates YAP via PI3K and PKD in Pancreatic Cancer Cells
Fang Hao et al. Mol Cancer Res. 2017 Jul.
Abstract
We examined the impact of crosstalk between the insulin receptor and G protein-coupled receptor (GPCR) signaling pathways on the regulation of Yes-associated protein (YAP) localization, phosphorylation, and transcriptional activity in the context of human pancreatic ductal adenocarcinoma (PDAC). Stimulation of PANC-1 or MiaPaCa-2 cells with insulin and neurotensin, a potent mitogenic combination of agonists for these cells, promoted striking YAP nuclear localization and decreased YAP phosphorylation at Ser127 and Ser397 Challenging PDAC cells with either insulin or neurotensin alone modestly induced the expression of YAP/TEAD-regulated genes, including connective tissue growth factor (CTGF), cysteine-rich angiogenic inducer 61 (CYR61), and CXCL5, whereas the combination of neurotensin and insulin induced a marked increase in the level of expression of these genes. In addition, siRNA-mediated knockdown of YAP/TAZ prevented the increase in the expression of these genes. A small-molecule inhibitor (A66), selective for the p110α subunit of PI3K, abrogated the increase in phosphatidylinositol 3,4,5-trisphosphate production and the expression of CTGF, CYR61, and CXCL5 induced by neurotensin and insulin. Furthermore, treatment of PDAC cells with protein kinase D (PKD) family inhibitors (CRT0066101 or kb NB 142-70) or with siRNAs targeting the PKD family prevented the increase of CTGF, CYR61, and CXCL5 mRNA levels in response to insulin and neurotensin stimulation. Thus, PI3K and PKD mediate YAP activation in response to insulin and neurotensin in pancreatic cancer cells.Implications: Inhibitors of PI3K or PKD disrupt crosstalk between insulin receptor and GPCR signaling systems by blocking YAP/TEAD-regulated gene expression in pancreatic cancer cells. Mol Cancer Res; 15(7); 929-41. ©2017 AACR.
©2017 American Association for Cancer Research.
Conflict of interest statement
Conflict of interest - The authors declare that they have no conflicts of interest with the contents of this article.
Figures
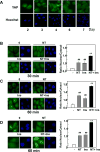
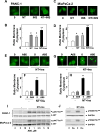
Figure 1. A combination of neurotensin and insulin promotes YAP nuclear localization in confluent PDAC cells
A, PANC-1 cells were fixed with 4% paraformaldehyde at various times after plating, as indicated. B and C, Confluent PANC-1 cells were stimulated without (−) or with 5 nM neurotensin (NT), 10 ng/ml insulin (Ins) or their combination (NT+Ins) for 30 min (B) or 60 min (C). D, Confluent MiaPaCa-2 cells were stimulated without (−) or with 5 nM neurotensin (NT), 10 ng/ml insulin (Ins) or NT+Ins for 60 min. In all cases the cultures were then washed, fixed with 4% paraformaldehyde and stained with an antibody that detects total YAP and with Hoechst 33342 to visualize the cell nuclei. Bars represent the ratio of nuclear/cytoplasm (180 to 240 cells) determined as described in Material and Methods. NT + Ins significantly increased nuclear localization of YAP as compared with untreated controls (**P < 0.01) or with either NT or Ins (##P < 0.01) as shown by one-way ANOVA with Bonferroni t-test.
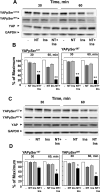
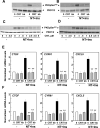
Figure 2. A combination of neurotensin and insulin potently decreases YAP phosphorylation at Ser127 and Ser397 in PDAC cells
Confluent PANC-1 cells (A and B) or MiaPaca-2 cells (C and D) were stimulated either without (−) or with 5 nM neurotensin (NT), 10 ng/ml insulin (Ins) or their combination (NT+Ins) for 30 or 60 min, as indicated. Cultures were then lysed with 2×SDS–PAGE sample buffer and analyzed by immunoblotting with antibodies that detect YAP phosphorylated at Ser127 and Ser397. Immunoblotting for total YAP and GADPH were also included. B and D, Quantification of total YAP phosphorylated at Ser127 and Ser397 was performed using Multi Gauge V3.0. The results represent the mean ± S.E.; n = 4 (independent experiments) and are expressed as percentage of the maximal level of YAP phosphorylated at Ser127 and Ser397. NT + Ins significantly decreased YAP phosphorylation at Ser127 and Ser397 as compared with untreated controls: **P < 0.01; *P < 0.05 (one-way ANOVA with Bonferroni t-test).
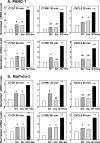
Figure 3. Neurotensin and Insulin stimulate YAP/TEAD-regulated gene expression in PDAC
Confluent PANC-1 cells (A) or MiaPaca-2 cells (B) were stimulated either without (−) or with 5 nM neurotensin (NT), 10 ng/ml insulin (Ins) or their combination (NT+Ins) for 30 or 60 min as indicated. RNA was isolated and the relative levels (n=3) of CTGF, CYR61 or CXCL5 mRNA compared with 18s mRNA was measured by RT-qPCR. Data are presented as mean ± SEM. Similar results were obtained in 3 independent experiments. NT + Ins significantly increased relative mRNA levels of CTGF, CYR61 or CXCL5 as compared with untreated controls (**P < 0.01) or with either NT or Ins (##P < 0.01; #P<0.05) as shown by one-way ANOVA with Bonferroni t-test.
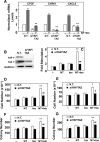
Figure 4. Neurotensin and Insulin induce increases in CTGF, CYR61 and CXCL5 gene expression and stimulate cell proliferation and colony via YAP/TAZ in PDAC cells
A and B, Cultures of PANC-1 cells were transfected with non-targeting siRNA (N. T.) or with siRNAs targeting YAP and TAZ (siYAP/TAZ). A, Cultures were then stimulated either without (−) or with NT+Ins (+) for 60 min. RNA was isolated and the relative levels (n=3) of CTGF, CYR61 or CXCL5 mRNA compared with 18s mRNA was measured by RT-qPCR. Data are presented as mean ± SEM. Similar results were obtained in 3 independent experiments. **P < 0.01, NT+I si RNA YAP/TAZ versus non-targeting siRNA (one-way ANOVA with Bonferroni t-test). B, Cultures were lysed with 2×SDS–PAGE sample buffer and analyzed by immunoblotting with antibodies that detect total YAP, TAZ and GAPDH. C, Cultures of PANC-1 cells were transfected with non-targeting siRNA (N. T.) or with siRNAs targeting YAP and TAZ (siYAP/TAZ) for 4 days. Then, the cultures were stimulated with 5 nM neurotensin (NT), 10 ng/ml insulin (Ins) or NT+Ins for 18 h and pulse-labeled with [3H]-thymidine (0.25 µCi/ml) for 6 h. The radioactivity incorporated into acid-insoluble pools was measured in a scintillation counter. Similar results were obtained in 3 independent experiments. **P < 0.01, NT+I vs control, NT or Ins; ## P< 0.001 NT+Ins YAP/TAZ siRNA versus NT+Ins non-targeting siRNA (one-way ANOVA with Bonferroni t-test). D and E, PANC-1 (D) MiaPaCa-2 (E) cells ransfected with non-targeting siRNA (N. T.) or with siRNAs targeting YAP and TAZ (siYAP/TAZ) were plated at a density of 4 × 10⁴ cells per dish. After 24 hours, the cultures were shifted to media containing 1 % FBS either without (−) or with 5 nM neurotensin (NT), 10 ng/ml insulin (Ins) or their combination (NT+Ins). After 4 days, cell numbers were determined from 3 plates per condition. Results are presented as mean ± SEM n=3, Similar results were obtained in 2 separate independent experiments. **P < 0.01, * P < 0.05, NT+I vs control, NT or Ins; ## P< 0.001, # P < 0.05, NT+Ins YAP/TAZ siRNA versus NT+Ins non-targeting siRNA (one-way ANOVA with Bonferroni t-test). F and G, Colony formation by PANC-1 (F) or MiaPaCa-2 (G) cells transfected with non-targeting siRNA (N. T.) or with siRNAs targeting YAP and TAZ (siYAP/TAZ) was performed as described in the Materials and Methods section. Results are presented as mean ± SEM n=3, **P < 0.01, NT+I vs control, NT or Ins; ## P< 0.001, NT+Ins YAP/TAZ siRNA vs NT+Ins non-targeting siRNA (one-way ANOVA with Bonferroni t-test). Similar results were obtained in 2 separate independent experiments
Figure 5. The selective PI3K inhibitor A66 suppresses PIP3 accumulation, AKT phosphorylation at Thr308 and YAP/TAZ-regulated gene expression in PDAC cells
A–D. PANC-1 (A and B) and MiaPaCa-2 cells (C and D) were transiently transfected with a plasmid encoding a fusion protein between GFP and the PH domain of Akt (Akt-PH-GFP). The cultures were then stimulated with 5 nM neurotensin (NT), 10 ng/ml insulin (Ins) or NT+Ins for 5 min. The intracellular distribution of Akt-PH-GFP was monitored under a fluorescence microscope. The cells shown in A and C were representative of 90% of GFP-positive cells. B and D, Bars represent the ratio of membrane/cytoplasm (40 to 60 cells) determined as described in Material and Methods. **P<0.001, NT+I vs control; # P< 0.05, NT+Ins vs NT or Ins (one-way ANOVA with Bonferroni t-test). E–H. PANC-1 (E and F) and MiaPaCa-2 cells (G and H), transiently transfected with Akt-PH-GFP (as above), were incubated in the absence or in the presence of A66 at 10µM in DMEM for 1h prior to stimulation with NT+Ins for 5 min. The intracellular distribution of Akt-PH-GFP was monitored under a fluorescence microscope. The selected cells shown in E and G were representative of 95% of the population of GFP-positive cells. F and H, Bars represent the ratio of membrane/cytoplasm (40 to 60 cells) determined as described in Material and Methods **P<0.001, NT+I vs NT+Ins + A66 (one-way ANOVA with Bonferroni t-test). I Confluent cultures of PANC-1 or MiaPaCa-2 cells were incubated in the absence (0) or presence of increasing concentrations of A66 for 1 h in DMEM prior to stimulation with NT+Ins for 10 min. Cultures were then lysed with 2×SDS–PAGE sample buffer and analyzed by immunoblotting with antibodies that detect AKT phosphorylated at Thr308 and total AKT. Similar results were obtained in 2 independent experiments. J Confluent cultures of PANC-1 or MiaPaCa-2 cells were incubated in the absence (0) or presence of 5 µM KU63794 for 1 h in DMEM prior to stimulation with NT+Ins for 10 min. Cultures were then lysed with 2×SDS–PAGE sample buffer and analyzed by immunoblotting with antibodies that detect p70S6K phosphorylated at Thr389 and GADPH. Similar results were obtained in 2 independent experiments. K and L, Confluent cultures of PANC-1 (K) and MiaPaCa-2 cells (L) were incubated in the absence or in the presence of A66 at 10µM in DMEM for 1h prior to stimulation with 5 nM neurotensin (NT), 10 ng/ml Insulin (Ins) or NT+Ins for 60 min. RNA was isolated and the relative levels (n=3) of CTGF, CYR61 or CXCL5 mRNA compared with 18s mRNA was measured by RT-qPCR. Data are presented as mean ± SEM n=3. Similar results were obtained in 3 independent experiments. **P<0.001, NT+I vs NT+Ins + A66 (one-way ANOVA with Bonferroni t-test).
Figure 6. Neurotensin and Insulin induce CTGF, CYR61 or CXCL5 expression through PKDs in PDAC cells
A and B, Confluent cultures of PANC-1 (A) or MiaPaCa-2 cells (B) were incubated in the absence (0) or presence of either 2.5 µM CRT0066101 (CRT) or 3.5 µM kb NB 142–70 (kB) for 1 h in DMEM prior to stimulation with 5 nM neurotensin (NT) and 10 ng/ml Insulin (Ins) for 10 min. Cultures were then lysed with 2×SDS–PAGE sample buffer and analyzed by immunoblotting with antibodies that detect PKD1 phosphorylated at Ser910 and total PKD1/2. Similar results were obtained in 3 independent experiments. C and D, Confluent cultures of PANC-1 (C) or MiaPaCa-2 cells (D) were incubated in the absence (0) or presence of increasing concentrations of CRT0066101 (CRT) for 1 h in DMEM prior to stimulation with NT+Ins for 10 min. PKD1 phosphorylation was determined as above. E and F, Confluent cultures of PANC-1 (E) and MiaPaCa-2 cells (F) were incubated in the absence (0) or presence of either 2.5 µM CRT0066101 (CRT) or 3.5 µM kb NB 142–70 (kB) for 1 h in DMEM prior to stimulation with NT+Ins for 60 min. RNA was isolated and the relative levels (n=3) of CTGF, CYR61 or CXCL5 mRNA compared with 18s mRNA was measured by RT-qPCR. Data are presented as mean ± SEM. Similar results were obtained independent experiments. Treatment with CRT0066101 or kb NB 142–70 significantly decreased relative mRNA levels of CTGF, CYR61 or CXCL5 as compared with untreated NT+Ins, **P < 0.01 as shown by one-way ANOVA with Bonferroni t-test.
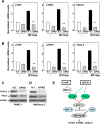
Figure 7. Knockdown of PKD family expression prevents neurotensin and insulin induced increases in CTGF, CYR61 or CXCL5 in PDAC cells
Cultures of PANC-1 (A) and MiaPaCa-2 cells (B) were transfected with non-targeting siRNA (N. T.) or with a mixture of siRNAs targeting PKD1, PKD2 and PKD3 (siPKD). The cultures were then stimulated without (−) or with 5 nM neurotensin (NT), 10 ng/ml insulin (Ins) or NT+Ins for 60 min. RNA was isolated and the relative levels (n=3) of CTGF, CYR61 or CXCL5 mRNA compared with 18s mRNA was measured by RT-qPCR. Data are presented as mean ± SEM. Similar results were obtained in 5 independent experiments for PANC-1 cells and 3 independent experiments for MiaPaCa-2 cells. siRNA transfection of PKD significantly decreased relative mRNA levels of CTGF, CYR61 or CXCL5 as compared with non-targeted controls, **P < 0.01 (one-way ANOVA with Bonferroni t-test). Cultures of PANC-1 (C) and MiaPaCa-2 (D) cells were transfected with non-targeting siRNA (N. T.) or with a mixture of siRNAs targeting PKD1, PKD2 and PKD3 (siPKD) for 4 days. Cells were then lysed with 2×SDS–PAGE sample buffer and analyzed by immunoblotting with antibodies that detect total PKD1/2, PKD3 and GAPDH. E, Scheme representing a model of YAP/TEAD activation in response to PI3K and PKD activation induced by crosstalk between insulin receptor and GPCR signaling systems in PDAC cells.
Similar articles
- Lipophilic statins inhibit YAP nuclear localization, co-activator activity and colony formation in pancreatic cancer cells and prevent the initial stages of pancreatic ductal adenocarcinoma in KrasG12D mice.
Hao F, Xu Q, Wang J, Yu S, Chang HH, Sinnett-Smith J, Eibl G, Rozengurt E. Hao F, et al. PLoS One. 2019 May 17;14(5):e0216603. doi: 10.1371/journal.pone.0216603. eCollection 2019. PLoS One. 2019. PMID: 31100067 Free PMC article. - Biphasic Regulation of Yes-associated Protein (YAP) Cellular Localization, Phosphorylation, and Activity by G Protein-coupled Receptor Agonists in Intestinal Epithelial Cells: A NOVEL ROLE FOR PROTEIN KINASE D (PKD).
Wang J, Sinnett-Smith J, Stevens JV, Young SH, Rozengurt E. Wang J, et al. J Biol Chem. 2016 Aug 19;291(34):17988-8005. doi: 10.1074/jbc.M115.711275. Epub 2016 Jul 1. J Biol Chem. 2016. PMID: 27369082 Free PMC article. - PKD, PKD2, and p38 MAPK mediate Hsp27 serine-82 phosphorylation induced by neurotensin in pancreatic cancer PANC-1 cells.
Yuan J, Rozengurt E. Yuan J, et al. J Cell Biochem. 2008 Feb 1;103(2):648-62. doi: 10.1002/jcb.21439. J Cell Biochem. 2008. PMID: 17570131 - Central role of Yes-associated protein and WW-domain-containing transcriptional co-activator with PDZ-binding motif in pancreatic cancer development.
Rozengurt E, Eibl G. Rozengurt E, et al. World J Gastroenterol. 2019 Apr 21;25(15):1797-1816. doi: 10.3748/wjg.v25.i15.1797. World J Gastroenterol. 2019. PMID: 31057295 Free PMC article. Review. - Multifaceted regulation and functions of YAP/TAZ in tumors (Review).
Liu H, Du S, Lei T, Wang H, He X, Tong R, Wang Y. Liu H, et al. Oncol Rep. 2018 Jul;40(1):16-28. doi: 10.3892/or.2018.6423. Epub 2018 May 8. Oncol Rep. 2018. PMID: 29749524 Free PMC article. Review.
Cited by
- Repurposing of Drugs Targeting YAP-TEAD Functions.
Elisi GM, Santucci M, D'Arca D, Lauriola A, Marverti G, Losi L, Scalvini L, Bolognesi ML, Mor M, Costi MP. Elisi GM, et al. Cancers (Basel). 2018 Sep 14;10(9):329. doi: 10.3390/cancers10090329. Cancers (Basel). 2018. PMID: 30223434 Free PMC article. Review. - Antibody ligation of HLA class II induces YAP nuclear localization and formation of cytoplasmic YAP condensates in human endothelial cells.
Lone M, Anwar T, Sinnett-Smith J, Jin YP, Reed EF, Rozengurt E. Lone M, et al. Immunohorizons. 2025 Jan 27;9(3):vlae008. doi: 10.1093/immhor/vlae008. Immunohorizons. 2025. PMID: 39865973 Free PMC article. - Role of Hippo-YAP1/TAZ pathway and its crosstalk in cardiac biology.
Chen X, Yuan W, Li Y, Luo J, Hou N. Chen X, et al. Int J Biol Sci. 2020 Jul 6;16(13):2454-2463. doi: 10.7150/ijbs.47142. eCollection 2020. Int J Biol Sci. 2020. PMID: 32760212 Free PMC article. Review. - An overview of the crosstalk between YAP and cGAS-STING signaling in non-small cell lung cancer: it takes two to tango.
Hao F. Hao F. Clin Transl Oncol. 2022 Sep;24(9):1661-1672. doi: 10.1007/s12094-022-02826-7. Epub 2022 Apr 3. Clin Transl Oncol. 2022. PMID: 35377059 Review. - Biological Significance of YAP/TAZ in Pancreatic Ductal Adenocarcinoma.
Hayashi H, Uemura N, Zhao L, Matsumura K, Sato H, Shiraishi Y, Baba H. Hayashi H, et al. Front Oncol. 2021 Jul 29;11:700315. doi: 10.3389/fonc.2021.700315. eCollection 2021. Front Oncol. 2021. PMID: 34395269 Free PMC article. Review.
References
- Siegel RL, Miller KD, Jemal A. Cancer statistics, 2016. CA: A Cancer Journal for Clinicians. 2016;66:7–30. - PubMed
- Mosquera C, Maglic D, Zervos EE. Molecular targeted therapy for pancreatic adenocarcinoma: A review of completed and ongoing late phase clinical trials. Cancer Genet. 2016;209:567–81. - PubMed
- Rozengurt E, Walsh JH. Gastrin, CCK, signaling, and cancer. Annu Rev Physiol. 2001;63:49–76. - PubMed
- Heasley LE. Autocrine and paracrine signaling through neuropeptide receptors in human cancer. Oncogene. 2001;20:1563–9. - PubMed
- Ryder NM, Guha S, Hines OJ, Reber HA, Rozengurt E. G protein-coupled receptor signaling in human ductal pancreatic cancer cells: Neurotensin responsiveness and mitogenic stimulation. J Cell Physiol. 2001;186:53–64. - PubMed
MeSH terms
Substances
LinkOut - more resources
Full Text Sources
Other Literature Sources
Medical
Research Materials
Miscellaneous
