Trail (TNF-related apoptosis-inducing ligand) induces an inflammatory response in human adipocytes - PubMed (original) (raw)
Trail (TNF-related apoptosis-inducing ligand) induces an inflammatory response in human adipocytes
Verena Zoller et al. Sci Rep. 2017.
Abstract
High serum concentrations of TNF-related apoptosis-inducing ligand (TRAIL), a member of the tumor necrosis factor protein family, are found in patients with increased BMI and serum lipid levels. In a model of murine obesity, both the expression of TRAIL and its receptor (TRAIL-R) is elevated in adipose tissue. Accordingly, TRAIL has been proposed as an important mediator of adipose tissue inflammation and obesity-associated diseases. The aim of this study was to investigate if TRAIL regulates inflammatory processes at the level of the adipocyte. Using human Simpson-Golabi-Behmel syndrome (SGBS) cells as a model system, we found that TRAIL induces an inflammatory response in both preadipocytes and adipocytes. It stimulates the expression of interleukin 6 (IL-6), interleukin 8 (IL-8) as well as the chemokines monocyte chemoattractant protein-1 (MCP-1) and chemokine C-C motif ligand 20 (CCL-20) in a time- and dose-dependent manner. By using small molecule inhibitors, we found that both the NFκB and the ERK1/2 pathway are crucial for mediating the effect of TRAIL. Taken together, we identified a novel pro-inflammatory function of TRAIL in human adipocytes. Our findings suggest that targeting the TRAIL/TRAIL-R system might be a useful strategy to tackle obesity-associated adipose tissue inflammation.
Conflict of interest statement
The authors declare that they have no competing interests.
Figures
Figure 1
TRAIL induces a pro-inflammatory expression profile in human preadipocytes and adipocytes. SGBS preadipocytes and adipocytes on day 14 of adipogenic differentiation were treated with TRAIL (+)(30 ng/ml) or vehicle (−) as indicated. After 12 hours, RNA was harvested and subjected to mRNA array analysis (GeneChip Human Gene 1.0 ST Array; Affymetrix). Heatmaps display the TRAIL-regulated inflammatory genes in preadipocytes (A) and adipocytes (B). An evidence-based STRING 10 analysis was performed to visualize the network of TRAIL-regulated genes in preadipocytes and in adipocytes (C).
Figure 2
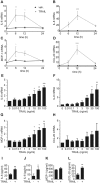
TRAIL regulates the production of cytokines and chemokines in a time- and dose-dependent manner. (A–D) SGBS adipocytes on day 14 of adipogenic differentiation were treated with TRAIL (30 ng/ml) or vehicle for 6, 12 and 24 hours. The mRNA expression of IL-6 (A), IL-8 (B), MCP-1 (C) and CCL-20 (D) was analyzed by qPCR. The mRNA levels were normalized to HPRT. Depicted are the means and SEM of 4 independent experiments. Two-way ANOVA and Sidak’s multiple comparison were used to test for statistical significance. (E–H) SGBS adipocytes on day 14 of adipogenic differentiation were treated with increasing doses of TRAIL or vehicle for 6 hours. The mRNA expression of IL-6 (E), IL-8 (F), MCP-1 (G) and CCL-20 (H) was analyzed by qPCR. The mRNA levels were normalized to HPRT. Depicted are the means and SEM of 3 independent experiments. One-way ANOVA and Dunnett’s multiple comparison were used to test for statistical significance. (I–L) SGBS adipocytes on day 14 of adipogenic differentiation were treated with TRAIL (30 ng/ml) or vehicle. After 24 hours, media supernatants were collected and IL-6 (I), IL-8 (J), MCP-1 (K) and CCL-20 (L) concentrations were determined by ELISA. Means and SEM of 3–7 independent experiments are shown. Unpaired Student’s t-tests were used to test for statistical significance. *p < 0.05, **p < 0.01, ***p < 0.001.
Figure 3
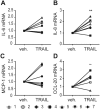
TRAIL induces the expression of cytokines and chemokines in human primary adipocytes. Human primary adipose stromal cells were isolated from white adipose tissue (n = 7) and adipogenesis was induced ex vivo. On day 14 of adipogenesis, the cells were treated with TRAIL (30 ng/ml) or vehicle for 6 hours and the gene expression of IL-6 (A), IL-8 (B), MCP-1 (C) and CCL-20 (D) was analyzed by qPCR. The mRNA levels were normalized to HPRT. Values are means and SEM of 7 independent experiments. Unpaired Student’s t-test was used to test for statistical significance. *p < 0.05, **p < 0.01.
Figure 4
TRAIL triggers caspase activation. (A) SGBS adipocytes on day 14 of adipogenic differentiation were treated with TRAIL (30 ng/ml) or vehicle and protein was isolated at different timepoints (1/4, 1/2, 1, 2 and 6 hours). Cleavage of caspase-8 and caspase-3 was analyzed by Western blot. α-tubulin was used as a loading control. One representative blot out of three performed experiments is presented. (B–E) SGBS adipocytes on day 14 of adipogenic differentiation were treated with TRAIL (30 ng/ml) or vehicle in the absence or presence of the pan-caspase inhibitor zVAD.fmk (20 μM). After 6 hours, IL-6 (B), IL-8 (C), MCP-1 (D) and CCL-20 (E) expression was analyzed by qPCR. The mRNA levels were normalized to HPRT. Depicted are the means and SEM of 3 independent experiments. One-way ANOVA and Dunnett’s multiple comparison were used to test for statistical significance. *p < 0.05, **p < 0.01, ***p < 0.001.
Figure 5
TRAIL induces the phosphorylation of IκBα. (A) SGBS adipocytes on day 14 of adipogenic differentiation were treated with TRAIL (30 ng/ml) or vehicle and protein was isolated at different timepoints (1/4, 1/2, 1, 2 and 6 hours). Cells stimulated with macrophage-conditioned medium (MaCM) were used as a positive control. The phosphorylation of IκBα was analyzed by Western blot. α-tubulin was used as a loading control. One representative blot out of three performed experiments is presented. (B) SGBS adipocytes on day 14 of adipogenic differentiation were treated for 2 hours with TRAIL (30 ng/ml), TNF-α (30 mg/ml) or vehicle and nuclear extracts were prepared. DNA binding activity of NFκB was analyzed by electrophoretic mobility shift assay (EMSA). One representative experiment out of three performed experiments is presented. (C) SGBS adipocytes on day 7 of adipogenic differentiation were transfected with NFκB Firefly luciferase reporter vector and Renilla luciferase control reporter vector. On day 9, cells were treated for 24 hours with TRAIL (30 ng/ml), TNF-α (30 mg/ml) or vehicle and luciferase activity was determined. Values are means and SEM of 3 different experiments. Unpaired Student´s t-test was used to test for statistical significance. (D-H) SGBS adipocytes on day 14 of adipogenic differentiation were treated with TRAIL (30 ng/ml) or vehicle in the absence or presence of the IKK inhibitor SC-514 (100 μM). After 6 hours, the phosphorylation of IκBα was analyzed by Western blot (D). α-tubulin was used as a loading control. One representative blot out of three performed experiments is presented. Also, the expression of IL-6 (E), IL-8 (F), MCP-1 (G) and CCL-20 (H) was assessed by qPCR. The mRNA levels were normalized to HPRT. Depicted are the means and SEM of 4 independent experiments. One-way ANOVA and Dunnett’s multiple comparison were used to test for statistical significance. *p < 0.05, **p < 0.01, ***p < 0.001.
Figure 6
TRAIL induces the phosphorylation of ERK1/2. (A) SGBS adipocytes on day 14 of adipogenic differentiation were treated with TRAIL (30 ng/ml) or vehicle and protein was isolated at different timepoints (1/4, 1/2, 1, 2 and 6 hours). The phosphorylation of ERK1/2, JNK and AKT was determined by Western blot. (B–F) SGBS adipocytes on day 14 of adipogenic differentiation were treated with TRAIL (30 ng/ml) or vehicle in the absence or presence of the MEK1/2 inhibitor PD-0325901 (100 nM). After 6 hours, the phosphorylation of ERK1/2 and IκBα was analyzed by Western blot (B). α-tubulin was used as a loading control. One representative blot out of three performed experiments is presented. Also, IL-6 (C), IL-8 (D), MCP-1 (E) and CCL-20 (F) was analyzed by qPCR. The mRNA levels were normalized to HPRT. Depicted are the means and SEM of 4 independent experiments. One-way ANOVA and Dunnett’s multiple comparison were used to test for statistical significance. *p < 0.05, **p < 0.01, ***p < 0.001.
Similar articles
- TRAIL (TNF-related apoptosis-inducing ligand) inhibits human adipocyte differentiation via caspase-mediated downregulation of adipogenic transcription factors.
Zoller V, Funcke JB, Keuper M, Abd El Hay M, Debatin KM, Wabitsch M, Fischer-Posovszky P. Zoller V, et al. Cell Death Dis. 2016 Oct 13;7(10):e2412. doi: 10.1038/cddis.2016.286. Cell Death Dis. 2016. PMID: 27735943 Free PMC article. - miR-146a-mediated suppression of the inflammatory response in human adipocytes.
Roos J, Enlund E, Funcke JB, Tews D, Holzmann K, Debatin KM, Wabitsch M, Fischer-Posovszky P. Roos J, et al. Sci Rep. 2016 Dec 6;6:38339. doi: 10.1038/srep38339. Sci Rep. 2016. PMID: 27922090 Free PMC article. - TNF-related apoptosis-inducing ligand promotes human preadipocyte proliferation via ERK1/2 activation.
Funcke JB, Zoller V, El Hay MA, Debatin KM, Wabitsch M, Fischer-Posovszky P. Funcke JB, et al. FASEB J. 2015 Jul;29(7):3065-75. doi: 10.1096/fj.14-267278. Epub 2015 Apr 9. FASEB J. 2015. PMID: 25857555 Free PMC article. - Adipocyte-Macrophage Cross-Talk in Obesity.
Engin AB. Engin AB. Adv Exp Med Biol. 2017;960:327-343. doi: 10.1007/978-3-319-48382-5_14. Adv Exp Med Biol. 2017. PMID: 28585206 Review. - 20 Years with SGBS cells - a versatile in vitro model of human adipocyte biology.
Tews D, Brenner RE, Siebert R, Debatin KM, Fischer-Posovszky P, Wabitsch M. Tews D, et al. Int J Obes (Lond). 2022 Nov;46(11):1939-1947. doi: 10.1038/s41366-022-01199-9. Epub 2022 Aug 19. Int J Obes (Lond). 2022. PMID: 35986215 Free PMC article. Review.
Cited by
- Mitochondrial VDAC1: A Potential Therapeutic Target of Inflammation-Related Diseases and Clinical Opportunities.
Hu H, Guo L, Overholser J, Wang X. Hu H, et al. Cells. 2022 Oct 10;11(19):3174. doi: 10.3390/cells11193174. Cells. 2022. PMID: 36231136 Free PMC article. Review. - A TRAIL-TL1A Paracrine Network Involving Adipocytes, Macrophages, and Lymphocytes Induces Adipose Tissue Dysfunction Downstream of E2F1 in Human Obesity.
Maixner N, Pecht T, Haim Y, Chalifa-Caspi V, Goldstein N, Tarnovscki T, Liberty IF, Kirshtein B, Golan R, Berner O, Monsonego A, Bashan N, Blüher M, Rudich A. Maixner N, et al. Diabetes. 2020 Nov;69(11):2310-2323. doi: 10.2337/db19-1231. Epub 2020 Jul 30. Diabetes. 2020. PMID: 32732304 Free PMC article. - The Role of Inflammatory Cytokines as Intermediates in the Pathway from Increased Adiposity to Disease.
Kalaoja M, Corbin LJ, Tan VY, Ahola-Olli AV, Havulinna AS, Santalahti K, Pitkänen N, Lehtimäki T, Lyytikäinen LP, Raitoharju E, Seppälä I, Kähönen M, Ripatti S, Palotie A, Perola M, Viikari JS, Jalkanen S, Maksimow M, Salomaa V, Salmi M, Raitakari OT, Kettunen J, Timpson NJ. Kalaoja M, et al. Obesity (Silver Spring). 2021 Feb;29(2):428-437. doi: 10.1002/oby.23060. Obesity (Silver Spring). 2021. PMID: 33491305 Free PMC article. - USP6 Confers Sensitivity to IFN-Mediated Apoptosis through Modulation of TRAIL Signaling in Ewing Sarcoma.
Henrich IC, Young R, Quick L, Oliveira AM, Chou MM. Henrich IC, et al. Mol Cancer Res. 2018 Dec;16(12):1834-1843. doi: 10.1158/1541-7786.MCR-18-0289. Epub 2018 Aug 21. Mol Cancer Res. 2018. PMID: 30131449 Free PMC article. - C5aR1 interacts with TLR2 in osteoblasts and stimulates the osteoclast-inducing chemokine CXCL10.
Mödinger Y, Rapp A, Pazmandi J, Vikman A, Holzmann K, Haffner-Luntzer M, Huber-Lang M, Ignatius A. Mödinger Y, et al. J Cell Mol Med. 2018 Dec;22(12):6002-6014. doi: 10.1111/jcmm.13873. Epub 2018 Sep 24. J Cell Mol Med. 2018. PMID: 30247799 Free PMC article.
References
- Pijl H. Obesity: evolution of a symptom of affluence. Neth. J. Med. 2011;69:159–166. - PubMed
Publication types
MeSH terms
Substances
Supplementary concepts
LinkOut - more resources
Full Text Sources
Other Literature Sources
Research Materials
Miscellaneous


