A novel role for osteopontin in macrophage-mediated amyloid-β clearance in Alzheimer's models - PubMed (original) (raw)
doi: 10.1016/j.bbi.2017.08.019. Epub 2017 Aug 30.
Julia Sheyn 1, Dieu-Trang Fuchs 1, David Daley 1, Brenda C Salumbides 1, Hannah E Schubloom 1, Nadav J Hart 1, Songlin Li 2, Eric Y Hayden 3, David B Teplow 3, Keith L Black 1, Yosef Koronyo 1, Maya Koronyo-Hamaoui 4
Affiliations
- PMID: 28860067
- PMCID: PMC5865478
- DOI: 10.1016/j.bbi.2017.08.019
A novel role for osteopontin in macrophage-mediated amyloid-β clearance in Alzheimer's models
Altan Rentsendorj et al. Brain Behav Immun. 2018 Jan.
Abstract
Osteopontin (OPN), a matricellular immunomodulatory cytokine highly expressed by myelomonocytic cells, is known to regulate immune cell migration, communication, and response to brain injury. Enhanced cerebral recruitment of monocytes achieved through glatiramer acetate (GA) immunization or peripheral blood enrichment with bone marrow (BM)-derived CD115+ monocytes (MoBM) curbs amyloid β-protein (Aβ) neuropathology and preserves cognitive function in murine models of Alzheimer's disease (ADtg mice). To elucidate the beneficial mechanisms of these immunomodulatory approaches in AD, we focused on the potential role of OPN in macrophage-mediated Aβ clearance. Here, we found extensive OPN upregulation along with reduction of vascular and parenchymal Aβ burden in cortices and hippocampi of GA-immunized ADtg mice. Treatment combining GA with blood-grafted MoBM further increased OPN levels surrounding residual Aβ plaques. In brains from AD patients and ADtg mice, OPN was also elevated and predominantly expressed by infiltrating GFP+- or Iba1+-CD45high monocyte-derived macrophages engulfing Aβ plaques. Following GA immunization, we detected a significant increase in a subpopulation of inflammatory blood monocytes (CD115+CD11b+Ly6Chigh) expressing OPN, and subsequently, an elevated population of OPN-expressing CD11b+Ly6C+CD45high monocyte/macrophages in the brains of these ADtg mice. Correlogram analyses indicate a strong linear correlation between cerebral OPN levels and macrophage infiltration, as well as a tight inverse relation between OPN and Aβ-plaque burden. In vitro studies corroborate in vivo findings by showing that GA directly upregulates OPN expression in BM-derived macrophages (MФBM). Further, OPN promotes a phenotypic shift that is highly phagocytic (increased uptake of Aβ fibrils and surface scavenger receptors) and anti-inflammatory (altered cell morphology, reduced iNOS, and elevated IL-10 and Aβ-degrading enzyme MMP-9). Inhibition of OPN expression in MФBM, either by siRNA, knockout (KOOPN), or minocycline, impairs uptake of Aβ fibrils and hinders GA's neuroprotective effects on macrophage immunological profile. Addition of human recombinant OPN reverses the impaired Aβ phagocytosis in KOOPN-MФBM. This study demonstrates that OPN has an essential role in modulating macrophage immunological profile and their ability to resist pathogenic forms of Aβ.
Keywords: ETA-1; Neurodegeneration; Neuroinflammation; SPP1; Vascular amyloid.
Copyright © 2017 The Author(s). Published by Elsevier Inc. All rights reserved.
Conflict of interest statement
Conflict of interest
The authors declare that they have no conflict of interest.
Figures
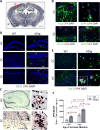
Fig. 1. OPN expression patterns in brains of ADtg and WT mice
(A) Quantification scheme for coronal brain sections. Representative Nissl-stained image of mouse brain at Bregma −2.65 mm. Scale bar: 1mm. Cingulate cortex (CC), hippocampus (HC) and entorhinal cortex (EC) were included in subsequent quantitative analyses. (B) Representative fluorescent micrographs of brains from ADtg and age-matched WT mice, immunolabeled for anti-OPN (red), anti-human Aβ (6E10; green), and nuclei (DAPI, blue). OPN immunostaining was detected within and around Aβ plaques in ADtg mice in all AD-associated brain regions (HC, CC and EC). In WT animals, no Aβ or OPN immunolabeling was detected. (C) Photomicrographs of brain sections (HC and EC) from ADtg mice show OPN immunohistochemistry by labeling with horseradish peroxidase (HRP) -conjugated secondary antibody. OPN is abundant in layers II / III of EC and often forms plaque-like structures. (D) Representative fluorescent micrographs of ADtg mouse brain sections (CC and EC) display immunostaining for OPN (red) and neuronal markers, Tuj1 or NeuN, or the astrocyte marker, GFAP. (E) OPN (red) was expressed by a subset of Iba1+ cells (green) in ADtg mice but not in WT-mice. Scale bars: 100 µm, inserts: 10 µm. (F) Quantitative ELISA analysis of OPN levels in brain lysate from ADtg and WT littermate groups at 13 and 24 months of age (equal numbers of females and males). n = 5–6 mice per group. Fold changes indicated in red. Group means, SEMs and individual data points are shown. **p<0.01, ****p<0.0001, by one-way ANOVA and Tukey’s multiple comparisons post test.
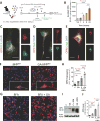
Fig. 2. Increased cerebral OPN expression associated with decreased Aβ plaque burden
(A) Fluorescent micrographs of coronal brain sections from HC (20× magnification, top panel) and CC (63×, lower panel) regions display OPN (red) and Aβ (6E10, green) aggregation patterns for all experimental ADtg mouse groups: s.c. GA immunization, GA+MoBM [GA s.c. immunization combined with i.v. adoptive transfer of bone marrow-derived CD115+ monocytes (MoBM)], and i.v. PBS injection as a control group (n=4–6 male mice/group). Nuclei stained with DAPI. Lower row displays single channels of OPN (red) and 6E10+ (Aβ, green). Scale bars: 100 µm. (B–C) Quantitative IHC analyses of 6E10+-plaque area and OPN immunoreactive area in brains of ADtg mice (n=4–6 mice/group). Data by region (HC, CC, and EC) accompanies total brain levels. (D) Quantitative ELISA analysis of OPN levels in brain lysates from all ADtg mouse groups (n=4–5 mice/group). (E) Ratio between cerebral OPN+ area and 4G8+-plaque area for all experimental groups (n=4 mice/group). (F–G) Correlation analyses between cerebral OPN and Aβ burden: (F) Inverse correlation between cortical (Ctx.) OPN+ area and 6E10+-Aβ plaque burden, and (G) inverse correlation between cerebral OPN and insoluble Aβ42 levels (ELISA). Correlation analyses performed using Pearson's coefficient (r) test (n=10–15 ADtg mice). Fold changes indicated in red. Group means, SEMs and individual data points are shown. *p<0.05, **p<0.01, ***p<0.001, ****p<0.0001, by one-way ANOVA and Tukey's or Dunnett's multiple comparisons post-tests (B–E) for comparison between experimental groups and PBS control or by two-tail unpaired Student’s t-test for analysis between two groups (C).
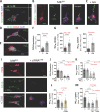
Fig. 3. Reduced cerebral vascular amyloid and Aβ40 burden correlate with increased levels of cerebral OPN
(A) Representative photomicrographs show Thioflavin-S (Thio-S)+ amyloid burden in brain parenchyma and vasculature; arrows and red delimitations indicate vascular Aβ deposits in respective cortical regions of GA-immunized (with and without grafted monocytes) vs. control (PBS-injected) ADtg mice. Thio-S staining revealed not only lesser parenchymal plaque burden in GA immunized groups but also reduction of vascular Aβ deposits. (B) Quantitative Thio-S+ CAA score assessment by brain region (HC and CC) and average in ADtg mouse groups (n=7–8 mice/group). (C–F) Correlation analyses reveal strong, significant linear correlations between vascular CAA burden and both (C) insoluble and (D) soluble Aβ40 levels in the brain (ELISA) as well as with (E) cerebral insoluble Aβ42, but no correlation with (F) soluble Aβ42 levels (ELISA). (G-I) Inverse correlations between cerebral OPN levels and (G) CAA scores, (H) soluble Aβ40, and (I) insoluble Aβ40 in ADtg mouse brains (ELISA). Correlation analyses performed using Pearson's coefficient (r) test (n=10–15 ADtg mice). Fold changes indicated in red. Group means, SEMs and individual data points are shown. **p<0.01, ***p<0.001, ****p<0.0001, by one-way ANOVA and Dunnett's multiple comparisons post-tests.
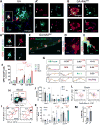
Fig. 4. Selective expression of OPN by blood monocytes and brain-infiltrating monocyte/macrophages involved in Aβ uptake following GA immunization
(A–E) Fluorescent micrographs of cortical regions of GA-immunized ADtg mice, with and without grafted GFP+-MoBM (GA+MoBM). Scale bars: 10 µm unless otherwise indicated. (A) Infiltrating Mo/MΦ identified by combined Iba1+ and CD45high immunolabeling in GA-immunized mouse brains. Cerebral OPN, Aβ (6E10) and nuclei (DAPI) also shown. (A’) Images of separate channels; arrow indicates an infiltrating OPN-expressing Iba1+CD45high MΦ engulfing Aβ. (A”) Region of interest in box above illustrates the colocalization of Aβ (6E10) with OPN-positive Iba1+CD45high MΦ. (B) Brain-infiltrating monocytes expressing OPN were also identified in GA+MoBM-treated mice through a second approach: adoptive transfer of a GFP-labeled BM-derived CD115+-monocyte subset injected into the tail vein of symptomatic ADtg mice. In EC, GFP+CD45high Mo/MΦ expressed OPN abundantly, in a manner distinct from resident microglia (GFPneg−CD45intermediate-low). Arrows indicate colocalization of OPN and GFP+CD45high Mo/MΦ. (C) OPN-expressing Iba1+ myelomonocytic cells were associated with plaques, especially at the border of EC. Scale bar = 50 µm. (D–E) Puncta staining patterns of subcellular OPN in vesicular compartments across cell body and along Iba1+ processes, with particularly intense signal in the perinuclear subregion. (F) OPN+CD45high cell count in HC, CC, EC and combined brain regions (n=4–5 ADtg mice/group). Fold increases relative to PBS controls or GA-treated group indicated in red. (G) Quantitative multifactor correlogram analysis (Pearson’s test) demonstrated significant linear association between OPN and monocyte infiltration in ADtg mice, and inverse relations to Aβ plaque burden (n=15 mice). (H-K) Flow cytometry analysis on blood monocytes isolated from additional cohort of adult ADtg and age-and gender-matched WT littermates before and after GA immunization (n=4 mice/genotype). (H) Initial gating of CD115-positive cells expressing OPN in red box. (I) OPN+ CD115-positive blood monocyte subpopulation in red box further analyzed by flow cytometry using monocyte biomarkers CD11b and Ly6C. (J–K) The OPN-expressing CD11b+CD115+Ly6C monocyte subpopulation in the blood was gated into three groups, Ly6Clow, Ly6Cmid and Ly6Chigh, showing differences in percentage of total cells before and after GA immunization in ADtg mice. Quantitative analysis of (J) mean fluorescence intensity (MFI) values and (K) proportions of cells in percentage before (b) and after immunization (GA). (L–M) Flow cytometry analysis on myelomonocytes isolated from perfused brains of GA-immunized vs. PBS-injected ADtg mice (n=3 mice/group). (L) Final gating of OPN+CD11b+ myelomonocytes in the brain into three populations of Ly6C+CD45hi, Ly6C+CD45mid and Ly6C+CD45low (shown in red ellipses). (M) Percentage of OPN+CD11b+ Ly6C+CD45hi infiltrating monocytes in the brain of GA vs. PBS control ADtg mice. Group means, SEMs and individual data points are shown. NS, no statistical significance. *p<0.05, **p<0.01, ***p<0.001, ****p<0.0001, by one-way (F) or two-way (J–K) ANOVA followed by Dunnett's or Bonferroni’s multiple comparisons post tests or two-tail unpaired Student’s t-test (M).
Fig. 5. Patterns of expression, secretion, and GA-mediated upregulation of OPN in BM-derived macrophage cultures
(A) Schematic illustration of in vitro studies: BM was isolated from WT mice (8- to 12-weeksold) and cultured for 6 or 7 days in MCSF-enriched media to differentiate into macrophages (MΦBM). On day 6, cells underwent overnight treatment with GA, siRNA or minocycline, except for untreated control cells (labeled ‘C’). On day 7, fibrillar Aβ (fAβ40 or fAβ42) was added in a subset of experiments, followed by phagocytosis assays. Brefeldin A (BFA) treatment was performed 3 hours prior to phagocytosis. (B) Constitutive secretion of OPN by MΦBM during a 24 hour period. Primary MΦBM media were collected after 15 min, and then after 1, 4, 6, and 24 hours. OPN protein levels were measured at each time point (ELISA; n=3 wells/time point, 1×10⁶ cells/well, in triplicates). (C–E) Intracellular OPN expression in MΦBM. Scale bars = 10µm. Representative fluorescent micrographs of MΦBM immunostained for OPN, (C) early endosomal antigen (EEA1) marker, (D) late endosome-lysosomal marker Ras-related protein (Rab7), or (E) Golgi marker 58K protein, and nuclei (DAPI). The merged images demonstrate subcellular OPN expression within vesicles, predominantly confined to the trans-Golgi network (yellow punctate signal). (F–J) Upregulation of OPN in MΦBM by GA treatment. (F–G) Representative fluorescent micrographs demonstrate the effect of GA treatment on MΦBM expression of OPN in the absence of Aβ, either (F) without BFA treatment or (G) with BFA pre-treatment. MΦBM were immunostained for OPN (red), which was more highly expressed following GA treatment. (F: insert) Subcellular OPN within transport vesicles in MΦBM. (G) Round-shaped MΦBM after BFA inhibition of OPN secretion. Scale bars: 20 µm, insert scale 5 µm. (H) Quantitative ICC of OPN-immunoreactive area revealed a significant upregulation of OPN in MΦBM following GA treatment, with or without BFA inhibition. Means of individual cell fluorescent areas are indicated (n=5–9 images/well, average 100 cells/image, and n = 3–5 wells/treatment group). (I) Western blot image of cell lysates from above-mentioned experimental groups. (J) Corresponding densitometry results of OPN levels in Western blots (normalized to β-actin levels; n=3 wells/group, 1×10⁶ cells/well; repeated experiments). Group means, SEMs and individual data points are shown. Fold increases in mean values compared with controls indicated in red. *p<0.05, **p<0.01, ***p<0.001, ****p<0.0001, by one-way ANOVA and Dunnett's multiple comparisons post-tests.
Fig. 6. Phagocytosis of Aβ40 and Aβ42 fibrils by BM-derived macrophages is dependent on OPN expression
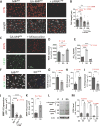
(A–H) Representative fluorescent micrographs and quantitative analyses of OPN expression and Aβ uptake in CD68+ MΦBM, in primary cultures pre-treated with GA for 24 hours and stimulated with fibrillar (f)Aβ40 or fAβ42 for 30 min. Scale bars: 10µm. (A) Higher magnification Z-stack image shows intracellular uptake of 6E10+-Aβ along with subcellular OPN expression patterns in untreated MΦBM. (B–C) Increased OPN expression and enhanced cellular uptake of fAβ42 was detected following GA treatment. (D–E) Representative images display phagocytosis of fAβ40 vs. fAβ42 by untreated MΦBM. (F-H) Quantitative ICC analysis of average OPN expression (F), intracellular fAβ40 (G), and fAβ42 (H) areas per MΦBM in GA-treated vs. untreated MΦBM. Along with increased OPN expression, MΦBM pre-treated with GA exhibit enhanced uptake of Aβ fibrils. (I) Representative micrographs of OPN-silenced MΦBM (via siRNAOPN knockdown) vs. untreated cells reveal reduced fAβ42 phagocytosis. Scale bar: 10µm. (J–K) Quantitative ICC revealed that silenced expression of OPN via siRNAOPN leads to impaired fAβ42 phagocytosis in MΦBM, regardless of GA treatment. Negative control scrambled siRNANeg affected neither OPN expression nor fAβ phagocytosis. (L–M) Additional experiment utilizing MΦBM isolated from OPN knockout (KO) mice vs. WT mice (controls, C). Quantitative ICC analysis of intracellular fAβ40 and fAβ42 uptake in control MΦBM, OPN-deficient MΦBM (KO), and GA-treated OPN-deficient MΦBM (KO+GA). OPN-deficient MΦBM exhibit impaired fAβ phagocytosis, partially restored by supplementation of human recombinant (r)OPN. Means of individual cell fluorescent areas indicated (average of n=5–10 images per well, with ~100 cells/image, n = 4–6 wells/treatment group). Group means, SEMs and individual data points are shown. Fold increases in mean values compared with controls indicated in red. *p<0.05, **p<0.01, ***p<0.001, ****p<0.0001, by one-way ANOVA and Tukey's multiple comparisons post-tests or two-tail unpaired Student’s t-test.
Fig. 7. OPN promotes an anti-inflammatory, pro-healing phenotype in BM-derived macrophages
(A) Fluorescent micrographs of MΦBM in primary cultures, either untreated, pretreated overnight with GA, or silenced with siRNAOPN, were immunostained for OPN (upper panel). Lower panel displays grayscale images of CD68+MΦBM with cell length measurements (red) by Zeiss Axiovision software. (B) Quantitative analysis of cell length measurements. Mean and individual cell lengths shown (n=20–46 counts, n=3–4 wells/group). Elongated cell processes in MΦBM are linked with polarization toward a highly phagocytic, pro-healing phenotype, resulting from amplified OPN expression following GA treatment. OPN inhibition by siRNA produced shorter cells, and under the resulting OPN deficiency, not even GA treatment could restore their elongated morphology. (C) Fluorescent images of MΦBM treated with GA or minocycline (M) for 24 hours and then exposed to fAβ42 for 30 min. Cells immunostained for inducible nitric oxide synthase (iNOS) and Aβ (6E10). (D-E) Quantitative ICC revealed that minocycline treatment increased iNOS expression, which in turn reduced fAβ42 phagocytosis. (F–J) Altered phenotype of OPN-knockout MΦBM (KOOPN). (F) Representative fluorescent micrographs of control vs. KOOPN-MΦBM labeled for Aβ (6E10), scavenger receptor CD36, and nuclei (DAPI). Reduced fAβ42 uptake in KOOPN-MΦBM is associated with significant decrease in surface CD36 expression (G). Quantitative ICC analysis of (H) iNOS, (I) interleukin 10 (IL10), and (J) matrix metalloproteinase 9 (MMP9) in control vs. KOOPN-MΦBM. Reduced OPN expression in KO-MΦBM altered their immunological profile; addition of GA did not affect MMP9 expression in KOOPN-MΦBM. (K) Quantitative ICC reveals increase in MMP-9 following GA treatment in WT MΦBM. Means of individual cell fluorescent areas are indicated (n=5–10 images/well, average 100 cells/image, n = 3–5 wells/group). (L) OPN levels as determined by Western blot with rabbit anti-OPN antibody. (M) Respective quantitative band density analysis shows elevation of OPN fragments derived from metalloproteinase (MMP) proteolysis following GA treatment, consistent with elevated MMP-9 production (normalized to β-actin input; n=4 wells/group, 1×10⁶ cells/well; repeated experiments). Secretion and proteolysis of OPN by MΦBM polarized towards an anti-inflammatory phenotype (mediated by MMP) amplified fAβ42 phagocytosis. Group means, SEMs and individual data points are shown. Fold increases in mean values compared with controls indicated in red. Scale bars: 50µm. **p<0.01, ***p<0.001, ****p<0.0001, by one-way ANOVA and Tukey's multiple comparisons post tests or two-tail unpaired Student’s t-test.
Similar articles
- Therapeutic effects of glatiramer acetate and grafted CD115⁺ monocytes in a mouse model of Alzheimer's disease.
Koronyo Y, Salumbides BC, Sheyn J, Pelissier L, Li S, Ljubimov V, Moyseyev M, Daley D, Fuchs DT, Pham M, Black KL, Rentsendorj A, Koronyo-Hamaoui M. Koronyo Y, et al. Brain. 2015 Aug;138(Pt 8):2399-422. doi: 10.1093/brain/awv150. Epub 2015 Jun 6. Brain. 2015. PMID: 26049087 Free PMC article. - Effects of IL-34 on Macrophage Immunological Profile in Response to Alzheimer's-Related Aβ42 Assemblies.
Zuroff LR, Torbati T, Hart NJ, Fuchs DT, Sheyn J, Rentsendorj A, Koronyo Y, Hayden EY, Teplow DB, Black KL, Koronyo-Hamaoui M. Zuroff LR, et al. Front Immunol. 2020 Jul 16;11:1449. doi: 10.3389/fimmu.2020.01449. eCollection 2020. Front Immunol. 2020. PMID: 32765504 Free PMC article. - Chronic Toxoplasma gondii infection enhances β-amyloid phagocytosis and clearance by recruited monocytes.
Möhle L, Israel N, Paarmann K, Krohn M, Pietkiewicz S, Müller A, Lavrik IN, Buguliskis JS, Schott BH, Schlüter D, Gundelfinger ED, Montag D, Seifert U, Pahnke J, Dunay IR. Möhle L, et al. Acta Neuropathol Commun. 2016 Mar 16;4:25. doi: 10.1186/s40478-016-0293-8. Acta Neuropathol Commun. 2016. PMID: 26984535 Free PMC article. - Clearance of cerebral Aβ in Alzheimer's disease: reassessing the role of microglia and monocytes.
Zuroff L, Daley D, Black KL, Koronyo-Hamaoui M. Zuroff L, et al. Cell Mol Life Sci. 2017 Jun;74(12):2167-2201. doi: 10.1007/s00018-017-2463-7. Epub 2017 Feb 14. Cell Mol Life Sci. 2017. PMID: 28197669 Free PMC article. Review. - The effects of enhancing angiotensin converting enzyme in myelomonocytes on ameliorating Alzheimer's-related disease and preserving cognition.
Danziger R, Fuchs DT, Koronyo Y, Rentsendorj A, Sheyn J, Hayden EY, Teplow DB, Black KL, Fuchs S, Bernstein KE, Koronyo-Hamaoui M. Danziger R, et al. Front Physiol. 2023 Jun 23;14:1179315. doi: 10.3389/fphys.2023.1179315. eCollection 2023. Front Physiol. 2023. PMID: 37427403 Free PMC article. Review.
Cited by
- Neurovascular unit, neuroinflammation and neurodegeneration markers in brain disorders.
Kempuraj D, Dourvetakis KD, Cohen J, Valladares DS, Joshi RS, Kothuru SP, Anderson T, Chinnappan B, Cheema AK, Klimas NG, Theoharides TC. Kempuraj D, et al. Front Cell Neurosci. 2024 Oct 25;18:1491952. doi: 10.3389/fncel.2024.1491952. eCollection 2024. Front Cell Neurosci. 2024. PMID: 39526043 Free PMC article. Review. - New preclinical biomarkers for prion diseases in the cerebrospinal fluid proteome revealed by mass spectrometry.
Pérez-Lázaro S, Barrio T, Bravo SB, Sevilla E, Otero A, Chantada-Vázquez MDP, Martín-Burriel I, Requena JR, Badiola JJ, Bolea R. Pérez-Lázaro S, et al. Vet Q. 2024 Dec;44(1):1-15. doi: 10.1080/01652176.2024.2424837. Epub 2024 Nov 9. Vet Q. 2024. PMID: 39520708 Free PMC article. - Blockade of brain alkaline phosphatase efficiently reduces amyloid-β plaque burden and associated cognitive impairment.
Soria-Tobar L, Román-Valero L, Sebastián-Serrano Á, Aivar P, Álvarez-Castelao B, Díaz-Hernández M. Soria-Tobar L, et al. Alzheimers Res Ther. 2024 Oct 22;16(1):233. doi: 10.1186/s13195-024-01600-x. Alzheimers Res Ther. 2024. PMID: 39438925 Free PMC article. - Exploring resveratrol against Alzheimer's disease and Parkinson's disease through integrating network pharmacology, bioinformatics, and experimental validation strategy in vitro.
Wu J, Tian Z, Wang B, Liu J, Bi R, Zhan N, Song D, He C, Zhao W. Wu J, et al. Heliyon. 2024 Sep 14;10(18):e37908. doi: 10.1016/j.heliyon.2024.e37908. eCollection 2024 Sep 30. Heliyon. 2024. PMID: 39328512 Free PMC article. - Osteopontin: A novel marker of pre-symptomatic sporadic Alzheimer's disease.
Quesnel MJ, Labonté A, Picard C, Bowie DC, Zetterberg H, Blennow K, Brinkmalm A, Villeneuve S, Poirier J; Alzheimer's Disease Neuroimaging Initiative; PREVENT‐AD Research Group. Quesnel MJ, et al. Alzheimers Dement. 2024 Sep;20(9):6008-6031. doi: 10.1002/alz.14065. Epub 2024 Jul 28. Alzheimers Dement. 2024. PMID: 39072932 Free PMC article.
References
- Agnihotri R, Crawford HC, Haro H, Matrisian LM, Havrda MC, Liaw L. Osteopontin, a novel substrate for matrix metalloproteinase-3 (stromelysin-1) and matrix metalloproteinase-7 (matrilysin) J Biol Chem. 2001;276:28261–28267. - PubMed
- Bakalash S, Pham M, Koronyo Y, Salumbides BC, Kramerov A, Seidenberg H, Berel D, Black KL, Koronyo-Hamaoui M. Egr1 expression is induced following glatiramer acetate immunotherapy in rodent models of glaucoma and Alzheimer's disease. Investigative ophthalmology & visual science. 2011;52:9033–9046. - PubMed
- Bateman RJ, Xiong C, Benzinger TL, Fagan AM, Goate A, Fox NC, Marcus DS, Cairns NJ, Xie X, Blazey TM, Holtzman DM, Santacruz A, Buckles V, Oliver A, Moulder K, Aisen PS, Ghetti B, Klunk WE, McDade E, Martins RN, Masters CL, Mayeux R, Ringman JM, Rossor MN, Schofield PR, Sperling RA, Salloway S, Morris JC. Clinical and biomarker changes in dominantly inherited Alzheimer's disease. The New England journal of medicine. 2012;367:795–804. - PMC - PubMed
- Bernstein KE, Koronyo Y, Salumbides BC, Sheyn J, Pelissier L, Lopes DH, Shah KH, Bernstein EA, Fuchs DT, Yu JJ, Pham M, Black KL, Shen XZ, Fuchs S, Koronyo-Hamaoui M. Angiotensin-converting enzyme overexpression in myelomonocytes prevents Alzheimer's-like cognitive decline. The Journal of clinical investigation. 2014;124:1000–1012. - PMC - PubMed
MeSH terms
Substances
LinkOut - more resources
Full Text Sources
Other Literature Sources
Medical
Molecular Biology Databases
Research Materials
Miscellaneous
