normalize - Normalize data - MATLAB (original) (raw)
Syntax
Description
[N](#mw%5F9405678c-6c76-491a-83e4-b928ee0b5cee) = normalize([A](#d126e1172741)) returns the vectorwise _z_-score of the data in A with center 0 and standard deviation 1.
- If
Ais a vector, thennormalizeoperates on the entire vectorA. - If
Ais a matrix, thennormalizeoperates on each column ofAseparately. - If
Ais a multidimensional array, thennormalizeoperates along the first dimension ofAwhose size does not equal 1. - If
Ais a table or timetable, thennormalizeoperates on each variable ofAseparately.
[N](#mw%5F9405678c-6c76-491a-83e4-b928ee0b5cee) = normalize([A](#d126e1172741),[dim](#mw%5Ff104f5ca-9a1b-4bb7-ad9d-6452bd07c519)) specifies the dimension of A to operate along. For example,normalize(A,2) normalizes each row.
[N](#mw%5F9405678c-6c76-491a-83e4-b928ee0b5cee) = normalize(___,[method](#mw%5F78930ffd-d2e4-41a6-9ec7-a6a00749332d)) specifies a normalization method with any of the previous syntaxes. For example,normalize(A,"norm") normalizes the data inA by the Euclidean norm (2-norm).
[N](#mw%5F9405678c-6c76-491a-83e4-b928ee0b5cee) = normalize(___,[method](#mw%5F78930ffd-d2e4-41a6-9ec7-a6a00749332d),[methodtype](#mw%5Fc53d6eba-62ae-44c6-a262-cc16fe9b5655)) specifies the type of normalization for the given method. For example,normalize(A,"norm",Inf) normalizes the data inA using the infinity norm.
[N](#mw%5F9405678c-6c76-491a-83e4-b928ee0b5cee) = normalize(___,"center",[centertype](#mw%5F5af7d9db-9955-4e5a-9cb8-9a019a1624c6),"scale",[scaletype](#mw%5F5af7d9db-9955-4e5a-9cb8-9a019a1624c6)) uses the "center" and "scale" methods at the same time. These are the only methods you can use together. If you do not specifycentertype or scaletype, thennormalize uses the default method type for that method (centering to have a mean of 0 and scaling by the standard deviation).
Use this syntax with any center and scale type to perform both methods together. For instance, N = normalize(A,"center","median","scale","mad"). You can also use this syntax to specify centering and scaling valuesC and S from a previously computed normalization. For instance, normalize one data set and save the parameters with[N1,C,S] = normalize(A1). Then, reuse those parameters on a different data set with N2 = normalize(A2,"center",C,"scale",S).
[N](#mw%5F9405678c-6c76-491a-83e4-b928ee0b5cee) = normalize(___,[Name,Value](#namevaluepairarguments)) specifies additional parameters for normalizing using one or more name-value arguments. For example, normalize(A,"DataVariables",datavars) normalizes the variables specified by datavars whenA is a table or timetable.
[[N](#mw%5F9405678c-6c76-491a-83e4-b928ee0b5cee),[C](#mw%5F5eed55d6-0907-415f-8d20-33b5c8682305),[S](#mw%5Fadd83049-8c13-478f-a91c-7ff738c5967d)] = normalize(___) additionally returns the centering and scaling values C andS used to perform the normalization. Then, you can normalize different input data using the values in C andS with N = normalize(A2,"center",C,"scale",S).
Alternative
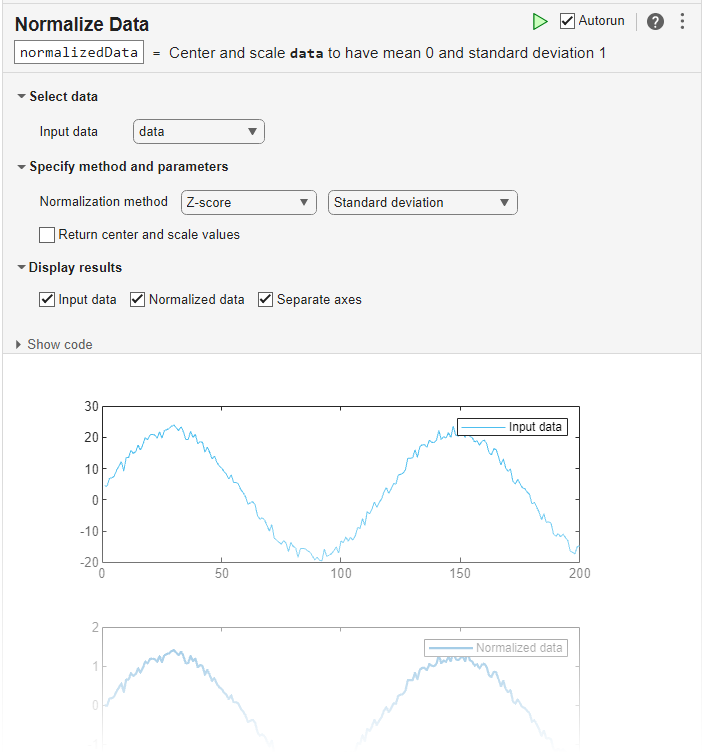
You can use normalize functionality interactively by adding the Normalize Data task to a live script.
Examples
Vector and Matrix Data
Normalize data in a vector and matrix by computing the _z_-score.
Create a vector v and compute the _z_-score, normalizing the data to have mean 0 and standard deviation 1.
v = 1:5; N = normalize(v)
N = 1×5
-1.2649 -0.6325 0 0.6325 1.2649
Create a matrix B and compute the _z_-score for each column. Then, normalize each row.
B = 3×3
 8     1     6
 3     5     7
 4     9     2
N1 = 3×3
1.1339 -1.0000 0.3780-0.7559 0 0.7559 -0.3780 1.0000 -1.1339
N2 = 3×3
0.8321 -1.1094 0.2774-1.0000 0 1.0000 -0.2774 1.1094 -0.8321
Scale Data
Scale a vector A by its standard deviation.
A = 1:5; Ns = normalize(A,"scale")
Ns = 1×5
0.6325 1.2649 1.8974 2.5298 3.1623Scale A so that its range is in the interval [0, 1].
Nr = normalize(A,"range")
Nr = 1×5
0 0.2500 0.5000 0.7500 1.0000Specify Method Type
Create a vector A and normalize it by its 1-norm.
A = 1:5; Np = normalize(A,"norm",1)
Np = 1×5
0.0667 0.1333 0.2000 0.2667 0.3333Center the data in A so that it has mean 0.
Nc = normalize(A,"center","mean")
Table Variables
Create a table containing height information for five people.
LastName = ["Sanchez";"Johnson";"Lee";"Diaz";"Brown"]; Height = [71;69;64;67;64]; T = table(LastName,Height)
T=5×2 table LastName Height _________ ______
"Sanchez"      71
"Johnson"      69
"Lee"          64
"Diaz"         67
"Brown"        64
Normalize the height data by the maximum height.
N = normalize(T,"norm",Inf,"DataVariables","Height")
N=5×2 table LastName Height _________ _______
"Sanchez"          1
"Johnson"    0.97183
"Lee"        0.90141
"Diaz"       0.94366
"Brown"      0.90141
Complex Vector
Create a vector containing real and imaginary components.
a = [1; 2; 3; 4]; b = [2; -2; 7; -7]; z = complex(a,b)
z = 4×1 complex
1.0000 + 2.0000i 2.0000 - 2.0000i 3.0000 + 7.0000i 4.0000 - 7.0000i
Normalize the complex vector. To scale the magnitude while maintaining the phase, scale by the infinity norm, or the largest magnitude. Specify the Inf option with the norm method. The function returns a complex unit vector.
N = normalize(z,"norm",Inf)
N = 4×1 complex
0.1240 + 0.2481i 0.2481 - 0.2481i 0.3721 + 0.8682i 0.4961 - 0.8682i
Verify that the normalized vector is within the complex unit circle.
Verify that the ratios between the corresponding elements of the normalized and original vectors are the same.
r = 4×1
0.1240
0.1240
0.1240
0.1240
Verify that the phase angle of the normalized vector is the same as the phase angle of the original vector.
ztheta = 4×1
1.1071-0.7854 1.1659 -1.0517
Ntheta = 4×1
1.1071-0.7854 1.1659 -1.0517
Normalize Multiple Data Sets with Same Parameters
Normalize a data set, return the computed parameter values, and reuse the parameters to apply the same normalization to another data set.
Create a timetable with two variables: Temperature and WindSpeed. Then create a second timetable with the same variables, but with the samples taken a year later.
rng default Time1 = (datetime(2019,1,1):days(1):datetime(2019,1,10))'; Temperature = randi([10 40],10,1); WindSpeed = randi([0 20],10,1); T1 = timetable(Temperature,WindSpeed,'RowTimes',Time1)
T1=10×2 timetable Time Temperature WindSpeed ___________ ___________ _________
01-Jan-2019        35             3
02-Jan-2019        38            20
03-Jan-2019        13            20
04-Jan-2019        38            10
05-Jan-2019        29            16
06-Jan-2019        13             2
07-Jan-2019        18             8
08-Jan-2019        26            19
09-Jan-2019        39            16
10-Jan-2019        39            20
Time2 = (datetime(2020,1,1):days(1):datetime(2020,1,10))'; Temperature = randi([10 40],10,1); WindSpeed = randi([0 20],10,1); T2 = timetable(Temperature,WindSpeed,'RowTimes',Time2)
T2=10×2 timetable Time Temperature WindSpeed ___________ ___________ _________
01-Jan-2020        30            14
02-Jan-2020        11             0
03-Jan-2020        36             5
04-Jan-2020        38             0
05-Jan-2020        31             2
06-Jan-2020        33            17
07-Jan-2020        33            14
08-Jan-2020        22             6
09-Jan-2020        30            19
10-Jan-2020        15             0
Normalize the first timetable. Specify three outputs: the normalized table, and also the centering and scaling parameter values C and S that the function uses to perform the normalization.
[T1_norm,C,S] = normalize(T1)
T1_norm=10×2 timetable Time Temperature WindSpeed ___________ ___________ _________
01-Jan-2019      0.57687       -1.4636
02-Jan-2019        0.856       0.92885
03-Jan-2019      -1.4701       0.92885
04-Jan-2019        0.856       -0.4785
05-Jan-2019     0.018609       0.36591
06-Jan-2019      -1.4701       -1.6044
07-Jan-2019      -1.0049      -0.75997
08-Jan-2019     -0.26052       0.78812
09-Jan-2019      0.94905       0.36591
10-Jan-2019 0.94905 0.92885 C=1×2 table Temperature WindSpeed ___________ _________
28.8 13.4 S=1×2 table Temperature WindSpeed ___________ _________
10.748 7.1056 Now normalize the second timetable T2 using the parameter values from the first normalization. This technique ensures that the data in T2 is centered and scaled in the same manner as T1.
T2_norm = normalize(T2,"center",C,"scale",S)
T2_norm=10×2 timetable Time Temperature WindSpeed ___________ ___________ _________
01-Jan-2020      0.11165      0.084441
02-Jan-2020      -1.6562       -1.8858
03-Jan-2020      0.66992       -1.1822
04-Jan-2020        0.856       -1.8858
05-Jan-2020       0.2047       -1.6044
06-Jan-2020      0.39078       0.50665
07-Jan-2020      0.39078      0.084441
08-Jan-2020      -0.6327       -1.0414
09-Jan-2020      0.11165       0.78812
10-Jan-2020       -1.284       -1.8858
By default, normalize operates on any variables in T2 that are also present in C and S. To normalize a subset of the variables in T2, specify the variables to operate on with the DataVariables name-value argument. The subset of variables you specify must be present in C and S.
Specify WindSpeed as the data variable to operate on. normalize operates on that variable and returns Temperature unchanged.
T2_partial = normalize(T2,"center",C,"scale",S,"DataVariables","WindSpeed")
T2_partial=10×2 timetable Time Temperature WindSpeed ___________ ___________ _________
01-Jan-2020        30         0.084441
02-Jan-2020        11          -1.8858
03-Jan-2020        36          -1.1822
04-Jan-2020        38          -1.8858
05-Jan-2020        31          -1.6044
06-Jan-2020        33          0.50665
07-Jan-2020        33         0.084441
08-Jan-2020        22          -1.0414
09-Jan-2020        30          0.78812
10-Jan-2020        15          -1.8858
Input Arguments
A — Input data
scalar | vector | matrix | multidimensional array | table | timetable
Input data, specified as a scalar, vector, matrix, multidimensional array, table, or timetable.
If A is a numeric array and has typesingle, then the output also has typesingle. Otherwise, the output has typedouble.
normalize ignores NaN values inA.
Data Types: double | single | table | timetable
Complex Number Support: Yes
dim — Operating dimension
positive integer scalar
Operating dimension, specified as a positive integer scalar. If no value is specified, then the default is the first array dimension whose size does not equal 1.
For table or timetable input data, dim is not supported and operation is along each table or timetable variable separately.
method — Normalization method
"zscore" (default) | "norm" | "scale" | "range" | "center" | "medianiqr"
Normalization method, specified as one of the options in this table.
| Method | Description |
|---|---|
| "zscore" | Compute the _z_-score. Center data to have mean 0, and scale data to have standard deviation 1. |
| "norm" | Scale data by the 2-norm, also known as the Euclidean norm. |
| "scale" | Scale data to have standard deviation 1. |
| "range" | Rescale range of data to [0, 1]. |
| "center" | Center data to have mean 0. |
| "medianiqr" | Center data to have median 0, and scale data to have interquartile range 1. |
To return the parameters the function uses to normalize the data, specify theC and S output arguments.
methodtype — Method type
array | table | two-element row vector | type name
Method type, specified as an array, table, two-element row vector, or type name, depending on the specified method.
| Method | Method Type Options | Description |
|---|---|---|
| "zscore" | "std" (default) | Compute the _z_-score. Center data to have mean 0, and scale data to have standard deviation 1. |
| "robust" | Compute the _z_-score. Center data to have mean 0, and scale data to have median absolute deviation 1. | |
| "norm" | Positive numeric scalar (default is 2) | Scale data by the _p_-norm, where_p_ is a positive numeric scalar. |
| Inf | Scale data by the _p_-norm, where_p_ is Inf. The infinity norm, or maximum norm, is the same as the largest magnitude of the elements in the data. | |
| "scale" | "std" (default) | Scale data to have standard deviation 1. |
| "mad" | Scale data to have median absolute deviation 1. | |
| "first" | Scale data by the first element of the data. | |
| "iqr" | Scale data to have interquartile range 1. | |
| Numeric array | Scale data by an array of numeric values. The array must have acompatible size with input A. | |
| Table | Scale data by variables in a table. Each table variable in the input data A is scaled using the value in the similarly named variable in the scaling table. | |
| "range" | 2-element row vector (default is [0 1]) | Rescale range of data to [a b], where a < b. |
| "center" | "mean" (default) | Center data to have mean 0. |
| "median" | Center data to have median 0. | |
| Numeric array | Shift center by an array of numeric values. The array must have a compatible size with input A. | |
| Table | Shift center by variables in a table. Each table variable in the input data A is centered using the value in the similarly named variable in the centering table. |
To return the parameters the function uses to normalize the data, specify theC and S output arguments.
centertype, scaletype — Center and scale method types
array | table | type name
Center and scale method types, specified as any valid methodtype option for the "center" or "scale" methods, respectively. See the methodtype argument description for a list of available options for each of the methods.
Example: N = normalize(A,"center",C,"scale",S)
Name-Value Arguments
Specify optional pairs of arguments asName1=Value1,...,NameN=ValueN, where Name is the argument name and Value is the corresponding value. Name-value arguments must appear after other arguments, but the order of the pairs does not matter.
Example: normalize(T,ReplaceValues=false)
Before R2021a, use commas to separate each name and value, and enclose Name in quotes.
Example: normalize(T,"ReplaceValues",false)
DataVariables — Table variables to operate on
table variable name | scalar | vector | cell array | pattern | function handle | table vartype subscript
Table variables to operate on, specified as one of the options in this table. The DataVariables value indicates which variables of the input table to fill.
Other variables in the table not specified byDataVariables pass through to the output without being normalized.
| Indexing Scheme | Values to Specify | Examples |
|---|---|---|
| Variable names | A string scalar or character vectorA string array or cell array of character vectorsA pattern object | "A" or 'A' — A variable named A["A" "B"] or {'A','B'} — Two variables named A andB"Var"+digitsPattern(1) — Variables named"Var" followed by a single digit |
| Variable index | An index number that refers to the location of a variable in the tableA vector of numbersA logical vector. Typically, this vector is the same length as the number of variables, but you can omit trailing0 (false) values. | 3 — The third variable from the table[2 3] — The second and third variables from the table[false false true] — The third variable |
| Function handle | A function handle that takes a table variable as input and returns a logical scalar | @isnumeric — All the variables containing numeric values |
| Variable type | A vartype subscript that selects variables of a specified type | vartype("numeric") — All the variables containing numeric values |
Example: normalize(T,"DataVariables",["Var1" "Var2" "Var4"])
ReplaceValues — Replace values indicator
true or1 (default) | false or 0
Replace values indicator, specified as one of these values whenA is a table or timetable:
trueor1— Replace input table variables with table variables containing normalized data.falseor0— Append input table variables with table variables containing normalized data.
For vector, matrix, or multidimensional array input data,ReplaceValues is not supported.
Example: normalize(T,"ReplaceValues",false)
Output Arguments
N — Normalized values
array | table | timetable
Normalized values, returned as an array, table, or timetable.
N is the same size as A unless the value of ReplaceValues is false. If the value of ReplaceValues is false, then the width of N is the sum of the input data width and the number of data variables specified.
normalize generally operates on all variables of input tables and timetables, except in these cases:
- If you specify
DataVariables, thennormalizeoperates on only the specified variables. - If you use the syntax
normalize(T,"center",C,"scale",S)to normalize a table or timetableTusing previously computed parametersCandS, thennormalizeautomatically uses the variable names inCandSto determine the data variables inTto operate on.
C — Centering values
array | table
Centering values, returned as an array or table.
When A is an array, normalize returns C and S as arrays such thatN = (A - C) ./ S. Each value in C is the centering value used to perform the normalization along the specified dimension. For example, if A is a 10-by-10 matrix of data and normalize operates along the first dimension, thenC is a 1-by-10 vector containing the centering value for each column in A.
When A is a table or timetable,normalize returns C andS as tables containing the centers and scales for each table variable that was normalized, N.Var = (A.Var - C.Var) ./ S.Var. The table variable names of C andS match corresponding table variables in the input. Each variable in C contains the centering value used to normalize the similarly named variable in A.
S — Scaling values
array | table
Scaling values, returned as an array or table.
When A is an array, normalize returns C and S as arrays such thatN = (A - C) ./ S. Each value in S is the scaling value used to perform the normalization along the specified dimension. For example, if A is a 10-by-10 matrix of data and normalize operates along the first dimension, thenS is a 1-by-10 vector containing the scaling value for each column in A.
When A is a table or timetable,normalize returns C andS as tables containing the centers and scales for each table variable that was normalized, N.Var = (A.Var - C.Var) ./ S.Var. The table variable names of C andS match corresponding table variables in the input. Each variable in S contains the scaling value used to normalize the similarly named variable in A.
More About
_Z_-Score
_z_-scores measure the distance of a data point from the mean in terms of the standard deviation. The standardized data set has mean 0 and standard deviation 1, and retains the shape properties of the original data set (same skewness and kurtosis).
For a random variable X with mean μ and standard deviation σ, the _z_-score of a value x is z=(x−μ)σ. For sample data with mean X¯ and standard deviation S, the_z_-score of a data point x is z=(x−X¯)S.
_P_-Norm
The general definition for the _p_-norm of a vector v that has N elements is
where p is any positive real value,Inf, or -Inf. Some common values of_p_ are 1, 2, and Inf.
- If p is 1, then the resulting 1-norm is the sum of the absolute values of the vector elements.
- If p is 2, then the resulting 2-norm gives the vector magnitude or Euclidean length of the vector.
- If p is
Inf, then ‖v‖∞=maxi(|v(i)|).
Rescaling
Rescaling changes the distance between the min and max values in a data set by stretching or squeezing the points along the number line. The_z_-scores of the data are preserved, so the shape of the distribution remains the same.
The equation for rescaling data X to an arbitrary interval [a b] is
If A is constant, then normalize returns the lower bound of the interval (0 by default) or NaN (when the specified interval contains Inf).
While the normalize and rescale functions can both rescale data to any arbitrary interval,rescale also permits clipping the input data to specified minimum and maximum values.
Interquartile Range
The interquartile range (IQR) of a data set describes the range of the middle 50% of values when the values are sorted. If Q1 is the 25th percentile of the data and Q3 is the 75th percentile of the data, then IQR = Q3 - Q1.
If A is constant, then the interquartile range of A is 0, but if the values are missing or infinite, then the interquartile range ofA is NaN.
The IQR is generally preferred over looking at the full range of the data when the data contains outliers (very large or very small values) because the IQR excludes the largest 25% and smallest 25% of values in the data.
Median Absolute Deviation
The median absolute deviation (MAD) of a data set is the median value of the absolute deviations from the median X˜ of the data: MAD=median(|x−X˜|). Therefore, the MAD describes the variability of the data in relation to the median.
The MAD is generally preferred over using the standard deviation of the data when the data contains outliers (very large or very small values) because the standard deviation squares deviations from the mean, giving outliers an unduly large impact. Conversely, the deviations of a small number of outliers do not affect the value of the MAD.
Extended Capabilities
Tall Arrays
Calculate with arrays that have more rows than fit in memory.
Thenormalize function supports tall arrays with the following usage notes and limitations:
- The outputs
CandSare not supported. - The
"center"and"scale"methods cannot be specified at the same time. - The supported method types for
"center"are:"mean","median", or a numeric scalar. - The supported method types for
"scale"are:"std","mad","first", or a numeric scalar. - The
DataVariablesname-value argument cannot specify a function handle. - Normalization methods that require calculation of the median or interquartile range along the first dimension only support tall column vector data. This includes the methods
normalize(___,"zscore","robust"),normalize(___,"scale","mad"),normalize(___,"scale","iqr"),normalize(___,"center","median"), andnormalize(___,"medianiqr").
For more information, see Tall Arrays.
C/C++ Code Generation
Generate C and C++ code using MATLAB® Coder™.
Usage notes and limitations:
- When the method types for
"center"and"scale"are both tables andDataVariablesis not provided, the method types must have table variable names in the same order.
Thread-Based Environment
Run code in the background using MATLAB® backgroundPool or accelerate code with Parallel Computing Toolbox™ ThreadPool.
This function fully supports thread-based environments. For more information, see Run MATLAB Functions in Thread-Based Environment.
GPU Arrays
Accelerate code by running on a graphics processing unit (GPU) using Parallel Computing Toolbox™.
The normalize function fully supports GPU arrays. To run the function on a GPU, specify the input data as a gpuArray (Parallel Computing Toolbox). For more information, see Run MATLAB Functions on a GPU (Parallel Computing Toolbox).
Distributed Arrays
Partition large arrays across the combined memory of your cluster using Parallel Computing Toolbox™.
Usage notes and limitations:
- The syntax
normalize(___,"medianiqr")is not supported. - The syntax
normalize(___,"scale","iqr")is not supported.
For more information, see Run MATLAB Functions with Distributed Arrays (Parallel Computing Toolbox).
Version History
Introduced in R2018a
R2022a: Append normalized values
You can now append, instead of replace, input table variables with table variables containing normalized data by setting the ReplaceValues name-value argument to false.
The ReplaceValues name-value argument is supported only for table and timetable input data.
R2021a: Normalize multiple data sets with same parameters
Return and reuse the centering and scaling normalization parameter values to normalize subsequent data sets. For example, normalize array A and then normalize array B with the same parameters.
[Anorm,C,S] = normalize(A); Bnorm = normalize(B,"center",C,"scale",S);
The new outputs, centering value C and scaling parameterS, allow for reuse in a later normalization step. Specify the"center" and "scale" normalization methods at the same time. These are the only two normalization methods that you can specify together.
When method is "center" or"scale", the possible values of methodtype include arrays and tables. While these methodtype values are intended to work with the new outputs C and S, you also can compute your own normalization parameters to specify.