Autoencoder.predict - Reconstruct the inputs using trained autoencoder - MATLAB (original) (raw)
Class: Autoencoder
Reconstruct the inputs using trained autoencoder
Syntax
Description
Y = predict(autoenc,X) returns the predictions Y for the input data X, using the autoencoder autoenc. The result Y is a reconstruction of X.
Input Arguments
Trained autoencoder, returned as an object of the Autoencoder class.
Data Types: single | double | cell
Output Arguments
Predictions for the input data Xnew, returned as a matrix or a cell array of image data.
- If Xnew is a matrix, then
Yis also a matrix, where each column corresponds to a single sample (observation or example). - If
Xnewis a cell array of image data, thenYis also a cell array of image data, where each cell contains the data for a single image. - If
Xnewis an array of a single image data, thenYis also an array of a single image data.
Examples
Load the training data.
The training data contains measurements on four attributes of iris flowers: Sepal length, sepal width, petal length, petal width.
Train an autoencoder on the training data using the positive saturating linear transfer function in the encoder and linear transfer function in the decoder.
autoenc = trainAutoencoder(X,'EncoderTransferFunction',... 'satlin','DecoderTransferFunction','purelin');
Reconstruct the measurements using the trained network, autoenc.
xReconstructed = predict(autoenc,X);
Plot the predicted measurement values along with the actual values in the training dataset.
for i = 1:4 h(i) = subplot(1,4,i); plot(X(i,:),'r.'); hold on plot(xReconstructed(i,:),'go'); hold off; end title(h(1),{'Sepal';'Length'}); title(h(2),{'Sepal';'Width'}); title(h(3),{'Petal';'Length'}); title(h(4),{'Petal';'Width'});
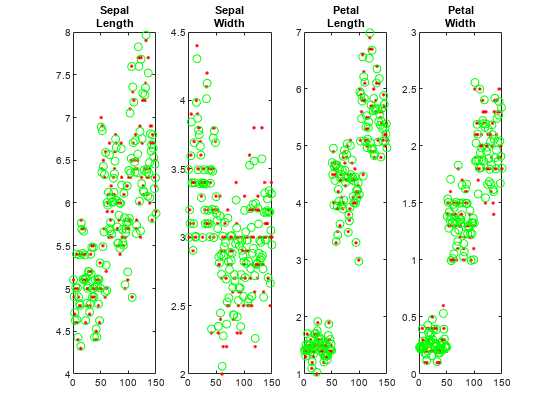
The red dots represent the training data and the green circles represent the reconstructed data.
Load the training data.
XTrain = digitTrainCellArrayData;
The training data is a 1-by-5000 cell array, where each cell containing a 28-by-28 matrix representing a synthetic image of a handwritten digit.
Train an autoencoder with a hidden layer containing 25 neurons.
hiddenSize = 25; autoenc = trainAutoencoder(XTrain,hiddenSize,... 'L2WeightRegularization',0.004,... 'SparsityRegularization',4,... 'SparsityProportion',0.15);
Load the test data.
XTest = digitTestCellArrayData;
The test data is a 1-by-5000 cell array, with each cell containing a 28-by-28 matrix representing a synthetic image of a handwritten digit.
Reconstruct the test image data using the trained autoencoder, autoenc.
xReconstructed = predict(autoenc,XTest);
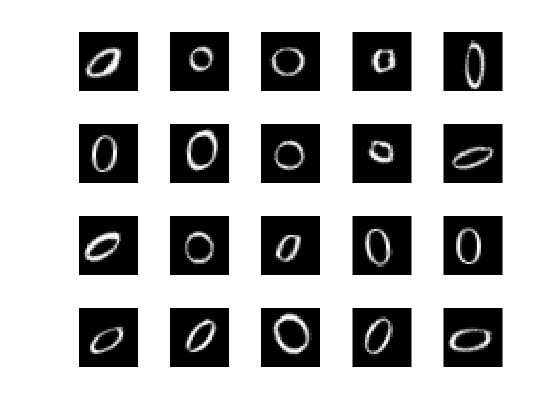
View the actual test data.
figure; for i = 1:20 subplot(4,5,i); imshow(XTest{i}); end
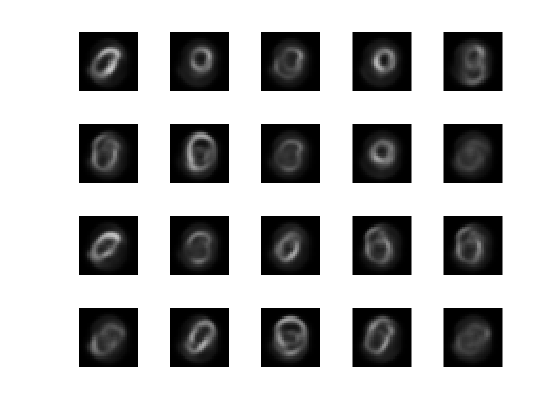
View the reconstructed test data.
figure; for i = 1:20 subplot(4,5,i); imshow(xReconstructed{i}); end
Version History
Introduced in R2015b