rocmetrics - Receiver operating characteristic (ROC) curve and performance metrics for binary and
multiclass classifiers - MATLAB ([original](http://www.mathworks.com/help/deeplearning/ref/rocmetrics.html)) ([raw](?raw))Receiver operating characteristic (ROC) curve and performance metrics for binary and multiclass classifiers
Since R2022b
Description
Create a rocmetrics object to evaluate the performance of a classification model using receiver operating characteristic (ROC) curves or other performance metrics. rocmetrics supports both binary and multiclass problems.
For each class, rocmetrics computes performance metrics for a one-versus-all ROC curve. You can compute metrics for an average ROC curve by using the average function. After computing metrics for ROC curves, you can plot them by using the plot function.
By default, rocmetrics computes the false positive rates (FPR) and the true positive rates (TPR) to obtain a ROC curve. You can compute additional metrics by specifying the AdditionalMetrics name-value argument when you create an object or by calling the addMetrics function after you create an object. A rocmetrics object stores the computed metrics in the Metrics properties.
In R2024b: You can find the area under the ROC curve (AUC) using the auc function.
rocmetrics computes pointwise confidence intervals for the performance metrics when you set the NumBootstraps value to a positive integer or when you specify cross-validated data for the true class labels (Labels), classification scores (Scores), and observation weights (Weights). For details, see Pointwise Confidence Intervals.Using confidence intervals requires Statistics and Machine Learning Toolbox™.
Creation
Syntax
Description
`rocObj` = rocmetrics([Labels](#mw%5F912e6ff2-fab8-4c1d-bea2-8ef5c586c89a),[Scores](#mw%5F0427e60a-2d72-4ea7-b4d9-18033c8ff346),[ClassNames](#mw%5Fb23b5282-5cec-4ff7-9ffd-c3c4778bc3f7)) creates a rocmetrics object using the true class labels inLabels and the classification scores inScores. Specify Labels as a vector of length n, and specify Scores as a matrix of sizen-by-K, where n is the number of observations, and K is the number of classes.ClassNames specifies the column order inScores.
The Metrics property contains the performance metrics for each class for which you specifyScores and ClassNames.
If you specify cross-validated data in Labels andScores as cell arrays, then rocmetrics computes confidence intervals for the performance metrics. Using cross-validated data requires Statistics and Machine Learning Toolbox.
`rocObj` = rocmetrics(___,[Name=Value](#namevaluepairarguments)) specifies options using one or more name-value arguments in addition to any of the input argument combinations in the previous syntaxes. For example, Prior="uniform" sets all class probabilities to be equal.
Input Arguments
True class labels, specified as a numeric vector, logical vector, categorical vector, character array, string array, or cell array of character vectors. You can also specify Labels as a cell array of one of these types for cross-validated data.
- For data that is not cross-validated, the length of
Labelsand the number of rows in Scores must be equal. - For cross-validated data, you must specify
Labels,Scores, and Weights as cell arrays with the same number of elements.rocmetricstreats an element in the cell arrays as data from one cross-validation fold and computes pointwise confidence intervals for the performance metrics. The length ofLabels{i}and the number of rows inScores{i}must be equal. Using cross-validated data requires Statistics and Machine Learning Toolbox.
Each row of Labels or Labels{i} represents the true label of one observation.
This argument sets the Labels property.
Data Types: single | double | logical | char | string | cell
Classification scores, specified as a numeric matrix or a cell array of numeric matrices.
Each row of the matrix in Scores contains the classification scores of one observation for all classes specified in ClassNames. The column order of Scores must match the class order inClassNames.
- For a matrix input,
Score(j,k)is the classification score of observationjfor classClassNames(k). For example, predict returns predicted class scores as an_n_-by-K matrix, where_n_ is the number of observations and_K_ is the number classes. Pass the output torocmetrics.
The number of rows inScoresand the length ofLabels must be equal.rocmetricsadjusts scores for each class relative to the scores for the rest of the classes. For details, see Adjusted Scores for Multiclass Classification Problem. - For a vector input,
Score(j)is the classification score of observationjfor the class specified inClassNames.ClassNamesmust contain only one class.- Prior must be a two-element vector with
Prior(1)representing the prior probability for the specified class. - Cost must be a
2-by-2matrix containing[Cost(P|P),Cost(N|P);Cost(P|N),Cost(N|N)], wherePis a positive class (the class for which you specify classification scores), andNis a negative class. - The length of
Scoresand the length ofLabelsmust be equal.
If you want to display the model operating point when you plot the ROC curve using the plot function, the values inScore(j)must be the posterior probability. This restriction applies only to a vector input.
- For cross-validated data, you must specify
Labels,Scores, and Weights as cell arrays with the same number of elements.rocmetricstreats an element in the cell arrays as data from one cross-validation fold and computes pointwise confidence intervals for the performance metrics.Score{i}(j,k)is the classification score of observationjin elementifor classClassNames(k). The number of rows inScores{i}and the length ofLabels{i}must be equal. Using cross-validated data requires Statistics and Machine Learning Toolbox.
For more information, see Classification Score Input for rocmetrics.
This argument sets the Scores property.
Data Types: single | double | cell
Class names, specified as a numeric vector, logical vector, categorical vector, character array, string array, or cell array of character vectors. ClassNames must have the same data type as the true labels in Labels. The values in ClassNames must appear in Labels.
- If you specify classification scores for only one class in
Scores,ClassNamesspecifies only the name of this class. - Otherwise,
ClassNamesspecifies the order of the classes in Scores,Cost, andPrior.
This argument sets the ClassNames property.
Data Types: single | double | logical | cell | categorical
Name-Value Arguments
Specify optional pairs of arguments asName1=Value1,...,NameN=ValueN, where Name is the argument name and Value is the corresponding value. Name-value arguments must appear after other arguments, but the order of the pairs does not matter.
Example: FixedMetric="FalsePositiveRate",FixedMetricValues=0:0.01:1 holds the FPR values fixed at 0:0.01:1.
Performance Metrics
Additional model performance metrics to compute, specified as a character vector or string scalar of the built-in metric name, string array of names, function handle (@metricName), or cell array of names or function handles. Arocmetrics object always computes the false positive rates (FPR) and the true positive rates (TPR) to obtain a ROC curve. Therefore, you do not have to specify to compute FPR and TPR.
- Built-in metrics — Specify one of the following built-in metric names by using a character vector or string scalar. You can specify more than one by using a string array.
Name Description "TruePositives" or"tp" Number of true positives (TP) "FalseNegatives" or"fn" Number of false negatives (FN) "FalsePositives" or"fp" Number of false positives (FP) "TrueNegatives" or"tn" Number of true negatives (TN) "SumOfTrueAndFalsePositives" or"tp+fp" Sum of TP and FP "RateOfPositivePredictions" or"rpp" Rate of positive predictions (RPP),(TP+FP)/(TP+FN+FP+TN) "RateOfNegativePredictions" or"rnp" Rate of negative predictions (RNP),(TN+FN)/(TP+FN+FP+TN) "Accuracy" or"accu" Accuracy, (TP+TN)/(TP+FN+FP+TN) "FalseNegativeRate","fnr", or"miss" False negative rate (FNR), or miss rate,FN/(TP+FN) "TrueNegativeRate","tnr", or"spec" True negative rate (TNR), or specificity,TN/(TN+FP) "PositivePredictiveValue","ppv", "prec", or"precision" Positive predictive value (PPV), or precision,TP/(TP+FP) "NegativePredictiveValue" or"npv" Negative predictive value (NPV),TN/(TN+FN) "ExpectedCost" or"ecost" Expected cost,(TP*cost(P|P)+FN*cost(N "f1score" F1 score, 2*TP/(2*TP+FP+FN) You can obtain all of the previous metrics by specifying "all". You cannot specify "all" in conjunction with any other metric. The software computes the scale vector using the prior class probabilities (Prior) and the number of classes in Labels, and then scales the performance metrics according to this scale vector. For details, see Performance Metrics. - Custom metric — Specify a custom metric by using a function handle. A custom function that returns a performance metric must have this form:
metric = customMetric(C,scale,cost)- The output argument
metricis a scalar value. - A custom metric is a function of the confusion matrix (
C), scale vector (scale), and cost matrix (cost). The software finds these input values for each one-versus-all binary problem. For details, see Performance Metrics.
*Cis a2-by-2confusion matrix consisting of[TP,FN;FP,TN].
*scaleis a2-by-1scale vector.
*costis a2-by-2misclassification cost matrix.
- The output argument
The software does not support cross-validation for a custom metric. Instead, you can specify to use bootstrap when you create arocmetrics object.
Note that the positive predictive value (PPV) isNaN for the reject-all threshold for which TP = FP = 0, and the negative predictive value (NPV) is NaN for the accept-all threshold for which TN = FN = 0. For more details, see Thresholds, Fixed Metric, and Fixed Metric Values.
Example: AdditionalMetrics=["Accuracy","PositivePredictiveValue"]
Example: AdditionalMetrics={"Accuracy",@m1,@m2} specifies the accuracy metric and the custom metrics m1 andm2 as additional metrics. rocmetrics stores the custom metric values as variables named CustomMetric1 andCustomMetric2 in the Metrics property.
Data Types: char | string | cell | function_handle
Fixed metric, specified as "Thresholds","FalsePositiveRate" (or "fpr"),"TruePositiveRate" (or "tpr"), or a metric specified by the AdditionalMetrics name-value argument. To hold a custom metric fixed, specifyFixedMetric as "CustomMetricN", whereN is the number that refers to the custom metric. For example, specify "CustomMetric1" to use the first custom metric specified byAdditionalMetrics as the fixed metric.
rocmetrics finds the ROC curves and other metric values that correspond to the fixed values (FixedMetricValues) of the fixed metric (FixedMetric), and stores the values in theMetrics property as a table. For more details, see Thresholds, Fixed Metric, and Fixed Metric Values.
If rocmetrics computes confidence intervals, it uses one of two methods for the computation, depending on the FixedMetric value:
- If
FixedMetricis"Thresholds"(default),rocmetricsuses threshold averaging. - If
FixedMetricis a nondefault value,rocmetricsuses vertical averaging.
For details, see Pointwise Confidence Intervals.
Using confidence intervals requires Statistics and Machine Learning Toolbox.
Example: FixedMetric="TruePositiveRate"
Data Types: char | string
Values for the fixed metric (FixedMetric), specified as "all" or a numeric vector.
rocmetrics finds the ROC curves and other metric values that correspond to the fixed values (FixedMetricValues) of the fixed metric (FixedMetric), and stores the values in the Metrics property as a table.
The default FixedMetric value is "Thresholds", and the default FixedMetricValues value is "all". For each class, rocmetrics uses all distinct adjusted score values as threshold values and computes the performance metrics using the threshold values. Depending on the UseNearestNeighbor setting, rocmetrics uses the exact threshold values corresponding to the fixed values or the nearest threshold values. For more details, see Thresholds, Fixed Metric, and Fixed Metric Values.
If rocmetrics computes confidence intervals, it holds FixedMetric fixed at FixedMetricValues.
FixedMetricvalue is"Thresholds", andFixedMetricValuesis"all"—rocmetricscomputes confidence intervals at the values corresponding to all distinct threshold values.FixedMetricvalue is a performance metric, andFixedMetricValuesis"all"—rocmetricsfinds the metric values corresponding to all distinct threshold values, and computes confidence intervals at the values corresponding to the metric values.
For details, see Pointwise Confidence Intervals.Using confidence intervals requires Statistics and Machine Learning Toolbox.
Example: FixedMetricValues=0:0.01:1
Data Types: single | double
NaN condition, specified as "omitnan" or "includenan".
"omitnan"—rocmetricsignores allNaNscore values in the input Scores and the corresponding values in Labels and Weights."includenan"—rocmetricsuses theNaNscore values in the inputScoresfor the calculation. The function adds the observations withNaNscores to false classification counts in the respective class. That is, the function counts observations withNaNscores from the positive class as false negative (FN), and counts observations withNaNscores from the negative class as false positive (FP).
For more details, see NaN Score Values.
Example: NaNFlag="includenan"
Data Types: char | string
Indicator to use the nearest metric values, specified as a numeric or logical0 (false) or 1 (true).
- logical
0(false) —rocmetricsuses the exact threshold values corresponding to the specified fixed metric values in FixedMetricValues for FixedMetric. - logical
1(true) — Among the adjusted input scores,rocmetricsfinds a value that is the nearest to the threshold value corresponding to each specified fixed metric value.
For more details, see Thresholds, Fixed Metric, and Fixed Metric Values.
The UseNearestNeighbor value must be false ifrocmetrics computes confidence intervals. Otherwise, the default value is true.
Using confidence intervals requires Statistics and Machine Learning Toolbox.
Example: UseNearestNeighbor=false
Data Types: single | double | logical
Options for Classification
Since R2024a
Flag to apply misclassification costs to scores for appropriate models, specified as a numeric or logical 0 (false) or1 (true). SetApplyCostToScores to true only when you specify scores for a _k_-nearest neighbor (KNN), discriminant analysis, or naive Bayes model with nondefault misclassification costs. These models use expected classification costs rather than scores to predict labels.
If you specify ApplyCostToScores as true, the software changes the scores to S*(-C), where the scoresS are specified by the Scores argument, and the misclassification cost matrix C is specified by the Cost name-value argument. The rocmetrics object stores the transformed scores in theScores property.
If you specify ApplyCostToScores as false, the software stores the untransformed scores in the Scores property of the rocmetrics object.
Example: ApplyCostToScores=true
Data Types: single | double | logical
Misclassification cost, specified as a _K_-by-K square matrix C, where K is the number of unique classes in Labels.C(i,j) is the cost of classifying a point into classj if its true class is i (that is, the rows correspond to the true class and the columns correspond to the predicted class).ClassNames specifies the order of the classes.
rocmetrics converts the K-by-K matrix to a 2-by-2 matrix for each one-versus-all binary problem. For details, see Misclassification Cost Matrix.
If you specify classification scores for only one class in Scores, theCost value must be a2-by-2 matrix containing[0,cost(N|P);cost(P|N),0], where P is a positive class (the class for which you specify classification scores), andN is a negative class. cost(N|P) is the cost of misclassifying a positive class as a negative class, and cost(P|N) is the cost of misclassifying a negative class as a positive class.
The default value is C(i,j)=1 if i~=j, and C(i,j)=0 if i=j. The diagonal entries of a cost matrix must be zero.
This argument sets the Cost property.
Note
If you specify a misclassification cost matrix when you use scores for a KNN, discriminant analysis, or naive Bayes model, set ApplyCostToScores totrue. These models use expected classification costs rather than scores to predict labels. (since R2024a)
Example: Cost=[0 2;1 0]
Data Types: single | double
Prior class probabilities, specified as one of the following:
"empirical"determines class probabilities from class frequencies in the true class labels Labels. If you pass observation weights (Weights),rocmetricsalso uses the weights to compute the class probabilities."uniform"sets all class probabilities to be equal.- Vector of scalar values, with one scalar value for each class. ClassNames specifies the order of the classes.
If you specify classification scores for only one class in Scores, thePriorvalue must be a two-element vector withPrior(1)representing the prior probability for the specified class.
This argument sets the Prior property.
Example: Prior="uniform"
Data Types: single | double | char | string
Observation weights, specified as a numeric vector of positive values or a cell array containing numeric vectors of positive values.
- For data that is not cross-validated, specify
Weightsas a numeric vector that has the same length as Labels. - For cross-validated data, you must specify
Labels,Scores, andWeightsas cell arrays with the same number of elements.rocmetricstreats an element in the cell arrays as data from one cross-validation fold and computes pointwise confidence intervals for the performance metrics. The length ofWeights{i}and the length ofLabels{i}must be equal. Using cross-validated data requires Statistics and Machine Learning Toolbox.
rocmetrics weighs the observations in Labels andScores with the corresponding values inWeights. If you set the NumBootstraps value to a positive integer, rocmetrics draws samples with replacement, using the weights as multinomial sampling probabilities. Using theNumBootstraps name-value argument requires Statistics and Machine Learning Toolbox.
By default, Weights is a vector of ones or a cell array containing vectors of ones.
This argument sets the Weights property.
Data Types: single | double | cell
Options for Confidence Intervals
Significance level for the pointwise confidence intervals, specified as a scalar in the range (0,1).
If you specify Alpha as α, thenrocmetrics computes 100×(1 – α)% pointwise confidence intervals for the performance metrics.
This argument is related to computing confidence intervals. Therefore, it is valid only when you specify cross-validated data for Labels, Scores, andWeights, or when you set the NumBootstraps value to a positive integer.
This option requires Statistics and Machine Learning Toolbox.
Example: Alpha=0.01 specifies 99% confidence intervals.
Data Types: single | double
Bootstrap options for parallel computation, specified as a structure.
You can specify options for computing bootstrap iterations in parallel and setting random numbers during the bootstrap sampling. Create the BootstrapOptions structure with statset (Statistics and Machine Learning Toolbox). This table lists the option fields and their values.
| Field Name | Field Value | Default |
|---|---|---|
| UseParallel | Set this value to true to compute bootstrap iterations in parallel. | false |
| UseSubstreams | Set this value to true to run computations in parallel in a reproducible manner.To compute reproducibly, set Streams to a type that allows substreams: "mlfg6331_64" or "mrg32k3a". | false |
| Streams | Specify this value as a RandStream object or cell array of such objects. Use a single object except when the UseParallel value is true and the UseSubstreams value is false. In that case, use a cell array that has the same size as the parallel pool. | If you do not specify Streams, then rocmetrics uses the default stream or streams. |
This argument is valid only when you specify NumBootstraps as a positive integer to compute confidence intervals using bootstrapping.
This option requires Statistics and Machine Learning Toolbox, and parallel computation requires Parallel Computing Toolbox™.
Example: BootstrapOptions=statset(UseParallel=true)
Data Types: struct
Bootstrap confidence interval type, specified as one of the values in this table.
| Value | Description |
|---|---|
| "bca" | Bias corrected and accelerated percentile method [8][9]. This method Involves a_z0_ factor computed using the proportion of bootstrap values that are less than the original sample value. To produce reasonable results when the sample is lumpy, the software computes_z0_ by including half of the bootstrap values that are the same as the original sample value. |
| "corrected percentile" or"cper" | Bias corrected percentile method [10] |
| "normal" or "norm" | Normal approximated interval with bootstrapped bias and standard error [11] |
| "percentile" or "per" | Basic percentile method |
| "student" or "stud" | Studentized confidence interval [8] |
This argument is valid only when you specify NumBootstraps as a positive integer to compute confidence intervals using bootstrapping.
This option requires Statistics and Machine Learning Toolbox.
Example: BootstrapType="student"
Data Types: char | string
Number of bootstrap samples to draw for computing pointwise confidence intervals, specified as a nonnegative integer scalar.
If you specify NumBootstraps as a positive integer, thenrocmetrics uses NumBootstraps bootstrap samples. To create each bootstrap sample, the function randomly selectsn out of the n rows of input data with replacement. The default value 0 implies thatrocmetrics does not use bootstrapping.
rocmetrics computes confidence intervals by using either cross-validated data or bootstrap samples. Therefore, if you specify cross-validated data for Labels, Scores, andWeights, thenNumBootstraps must be 0.
For details, see Pointwise Confidence Intervals.
This option requires Statistics and Machine Learning Toolbox.
Example: NumBootstraps=500
Data Types: single | double
Number of bootstrap samples to draw for the studentized standard error estimate, specified as a positive integer scalar.
This argument is valid only when you specify NumBootstraps as a positive integer and BootstrapType as"student" to compute studentized bootstrap confidence intervals.rocmetrics estimates the studentized standard error estimate by using NumBootstrapsStudentizedSE bootstrap data samples.
This option requires Statistics and Machine Learning Toolbox.
Example: NumBootstrapsStudentizedSE=500
Data Types: single | double
Properties
Performance Metrics
This property is read-only.
Performance metrics, specified as a table.
The table contains performance metric values for all classes, vertically concatenated according to the class order in ClassNames. The table has a row for each unique threshold value for each class.rocmetrics determines the threshold values to use based on the value of FixedMetric,FixedMetricValues, and UseNearestNeighbor. For details, see Thresholds, Fixed Metric, and Fixed Metric Values.
The number of rows for each class in the table is the number of unique threshold values.
Each row of the table contains these variables: ClassName,Threshold, FalsePositiveRate, andTruePositiveRate, as well as a variable for each additional metric specified in AdditionalMetrics. If you specify a custom metric, rocmetrics names the metric"CustomMetricN", where N is the number that refers to the custom metric. For example, "CustomMetric1" corresponds to the first custom metric specified by AdditionalMetrics.
Each variable in the Metrics table contains a vector or a three-column matrix.
- If
rocmetricsdoes not compute confidence intervals, each variable contains a vector. - If
rocmetricscomputes confidence intervals, bothClassNameand the variable for FixedMetric (Threshold,FalsePositiveRate,TruePositiveRate, or an additional metric) contain a vector, and the other variables contain a three-column matrix. The first column of the matrix corresponds to the metric values, and the second and third columns correspond to the lower and upper bounds, respectively.
Using confidence intervals requires Statistics and Machine Learning Toolbox.
Data Types: table
Classification Model Properties
You can specify the following properties when creating a rocmetrics object.
This property is read-only.
Class names, specified as a numeric vector, logical vector, categorical vector, or cell array of character vectors.
For details, see the input argument ClassNames, which sets this property. (The software treats character or string arrays as cell arrays of character vectors.)
Data Types: single | double | logical | cell | categorical
This property is read-only.
Misclassification cost, specified as a square matrix.
For details, see the Cost name-value argument, which sets this property.
Data Types: single | double
This property is read-only.
True class labels, specified as a numeric vector, logical vector, categorical vector, cell array of character vectors, or cell array of one of these types for cross-validated data.
For details, see the input argument Labels, which sets this property. (The software treats character or string arrays as cell arrays of character vectors.)
Data Types: single | double | logical | cell | categorical
This property is read-only.
Prior class probabilities, specified as a numeric vector.
For details, see the Prior name-value argument, which sets this property. If you specify this argument as a character vector or string scalar ("empirical" or "uniform"),rocmetrics computes the prior probabilities and stores thePrior property as a numeric vector.
Data Types: single | double
This property is read-only.
Classification scores, specified as a numeric matrix or a cell array of numeric matrices.
For details, see the input argument Scores, which sets this property.
Note
If you specify the ApplyCostToScores name-value argument as true, the software stores the transformed scores S*(-C), where the scores S are specified by the Scores argument, and the misclassification cost matrix C is specified by the Cost name-value argument. (since R2024a)
Data Types: single | double | cell
This property is read-only.
Observation weights, specified as a numeric vector of positive values or a cell array containing numeric vectors of positive values.
For details, see the Weights name-value argument, which sets this property.
Data Types: single | double | cell
Object Functions
| addMetrics | Compute additional classification performance metrics |
|---|---|
| auc | Area under the ROC curve or area under the PR (precision-recall) curve |
| average | Compute performance metrics for average receiver operating characteristic (ROC) curve in multiclass problem |
| modelOperatingPoint | Operating point of rocmetrics object |
| plot | Plot receiver operating characteristic (ROC) curves and other performance curves |
Examples
Load a sample of predicted classification scores and true labels for a classification problem.
load('flowersDataResponses.mat')
trueLabels is the true labels for an image classification problem and scores is the softmax prediction scores. scores is an N-by-K array where N is the number of observations and K is the number of classes.
trueLabels = flowersData.trueLabels; scores = flowersData.scores;
Load the class names. The column order of scores follows the class order stored in classNames.
classNames = flowersData.classNames;
Create a rocmetrics object by using the true labels in trueLabels and the classification scores in scores. Specify the column order of scores using classNames.
rocObj = rocmetrics(trueLabels,scores,classNames);
rocObj is a rocmetrics object that stores performance metrics for each class in the property. Compute the AUC for all the model classes by calling auc on the object.
a = 1×5 single row vector
0.9781 0.9889 0.9728 0.9809 0.9732Plot the ROC curve for each class. The plot function also returns the AUC values for the classes.
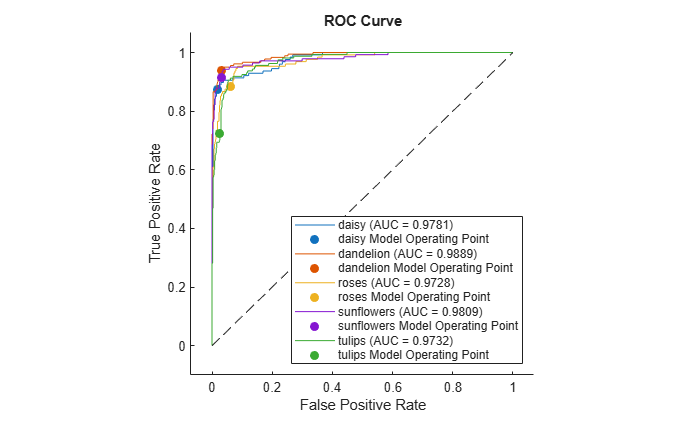
The filled circle markers indicate the model operating points. The legend displays the class name and AUC value for each curve.
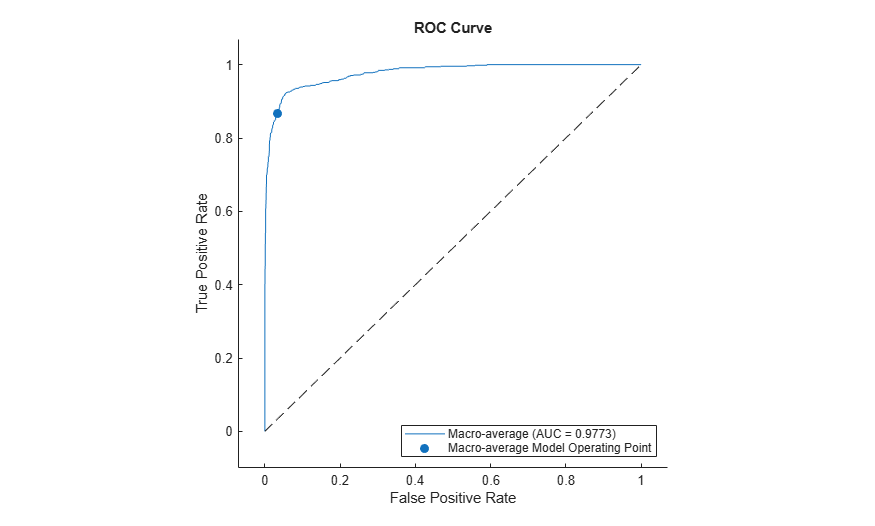
Plot the macro average ROC curve.
plot(rocObj,AverageCurveType=["macro"],ClassNames=[])
Compute the confidence intervals for FPR and TPR for fixed threshold values by using bootstrap samples, and plot the confidence intervals for TPR on the ROC curve by using the plot function. This examples requires Statistics and Machine Learning Toolbox™.
Load a sample of true labels and the prediction scores for a classification problem. For this example, there are five classes: daisy, dandelion, roses, sunflowers, and tulips. The class names are stored in classNames. The scores are the softmax prediction scores generated using the predict function. scores is an N-by-K array where N is the number of observations and K is the number of classes. The column order of scores follows the class order stored in classNames.
load('flowersDataResponses.mat')
scores = flowersData.scores; trueLabels = flowersData.trueLabels; predLabels = flowersData.predictedLabels;
classNames = flowersData.classNames;
Create a rocmetrics object by using the true labels in trueLabels and the classification scores in scores. Specify the column order of scores using classNames. Specify NumBootstraps as 100 to use 100 bootstrap samples to compute the confidence intervals.
rocObj = rocmetrics(trueLabels,scores,classNames,NumBootstraps=100);
Find the rows for the second class in the table of the Metrics property, and display the first eight rows.
idx = rocObj.Metrics.ClassName ==classNames(2); head(rocObj.Metrics(idx,:))
ClassName    Threshold    FalsePositiveRate          TruePositiveRate
_________    _________    _________________    _____________________________

dandelion        1           0    0    0             0          0          0
dandelion        1           0    0    0       0.23889    0.17858    0.31326
dandelion        1           0    0    0       0.26111    0.20107    0.34007
dandelion        1           0    0    0       0.27222    0.21829    0.35778
dandelion        1           0    0    0       0.28889    0.22739    0.36583
dandelion        1           0    0    0       0.29444    0.23682    0.41685
dandelion        1           0    0    0           0.3    0.24296    0.42567
dandelion        1           0    0    0       0.31111    0.24964    0.42614
Each row of the table contains the metric value and its confidence intervals for FPR and TPR for a fixed threshold value. The Threshold variable is a column vector, and the FalsePositiveRate and TruePositiveRate variables are three-column matrices. The first column of the matrices corresponds to the metric values, and the second and third columns correspond to the lower and upper bounds, respectively.
Plot the ROC curve and the confidence intervals for TPR. Specify ShowConfidenceIntervals=true to show the confidence intervals.
plot(rocObj,ShowConfidenceIntervals=true)

The shaded area around the ROC curve indicates the confidence intervals. The confidence intervals represent the uncertainty of the curve due to the variance in the data set for the trained model.
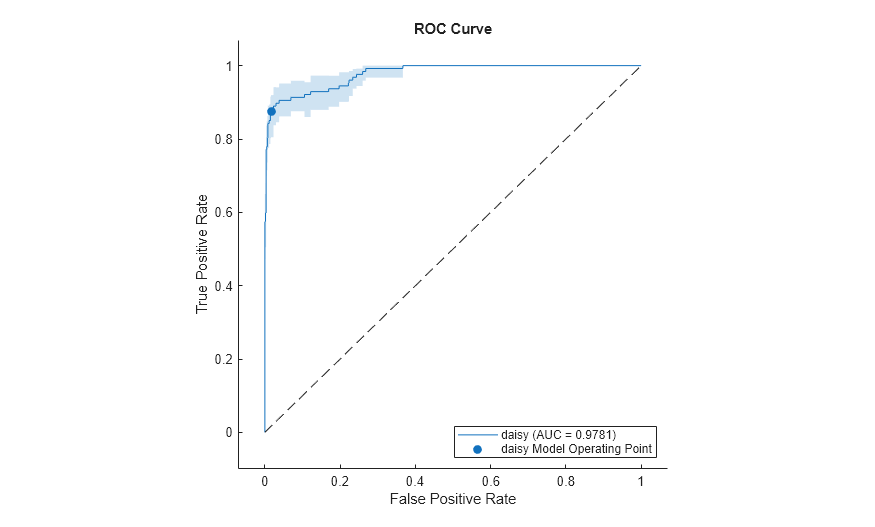
Specify one class to plot by using the ClassNames name-value argument.
plot(rocObj,ShowConfidenceIntervals=true,ClassNames="daisy")
More About
A ROC curve shows the true positive rate versus the false positive rate for different thresholds of classification scores.
The true positive rate and the false positive rate are defined as follows:
- True positive rate (TPR), also known as recall or sensitivity —
TP/(TP+FN), where TP is the number of true positives and FN is the number of false negatives - False positive rate (FPR), also known as fallout or 1-specificity —
FP/(TN+FP), where FP is the number of false positives and TN is the number of true negatives
Each point on a ROC curve corresponds to a pair of TPR and FPR values for a specific threshold value. You can find different pairs of TPR and FPR values by varying the threshold value, and then create a ROC curve using the pairs. For each class,rocmetrics uses all distinct adjusted score values as threshold values to create a ROC curve.
For a multiclass classification problem, rocmetrics formulates a set of one-versus-all binary classification problems to have one binary problem for each class, and finds a ROC curve for each class using the corresponding binary problem. Each binary problem assumes one class as positive and the rest as negative.
For a binary classification problem, if you specify the classification scores as a matrix, rocmetrics formulates two one-versus-all binary classification problems. Each of these problems treats one class as a positive class and the other class as a negative class, and rocmetrics finds two ROC curves. Use one of the curves to evaluate the binary classification problem.
For more details, see ROC Curve and Performance Metrics.
The area under a ROC curve (AUC) corresponds to the integral of a ROC curve (TPR values) with respect to FPR from FPR = 0 to FPR = 1.
The AUC provides an aggregate performance measure across all possible thresholds. The AUC values are in the range 0 to 1, and larger AUC values indicate better classifier performance.
The one-versus-all (OVA) coding design reduces a multiclass classification problem to a set of binary classification problems. In this coding design, each binary classification treats one class as positive and the rest of the classes as negative.rocmetrics uses the OVA coding design for multiclass classification and evaluates the performance on each class by using the binary classification that the class is positive.
For example, the OVA coding design for three classes formulates three binary classifications:
Each row corresponds to a class, and each column corresponds to a binary classification problem. The first binary classification assumes that class 1 is a positive class and the rest of the classes are negative. rocmetrics evaluates the performance on the first class by using the first binary classification problem.
The model operating point represents the FPR and TPR corresponding to the typical threshold value.
The typical threshold value depends on the input format of the Scores argument (classification scores) specified when you create arocmetrics object:
- If you specify
Scoresas a matrix, rocmetrics assumes that the values inScoresare the scores for a multiclass classification problem and uses adjusted score values. A multiclass classification model classifies an observation into a class that yields the largest score, which corresponds to a nonnegative score in the adjusted scores. Therefore, the threshold value is0. - If you specify
Scoresas a column vector,rocmetricsassumes that the values inScoresare posterior probabilities of the class specified in ClassNames. A binary classification model classifies an observation into a class that yields a higher posterior probability, that is, a posterior probability greater than0.5. Therefore, the threshold value is0.5.
For a binary classification problem, you can specify Scores as a two-column matrix or a column vector. However, if the classification scores are not posterior probabilities, you must specify Scores as a matrix. A binary classifier classifies an observation into a class that yields a larger score, which is equivalent to a class that yields a nonnegative adjusted score. Therefore, if you specifyScores as a matrix for a binary classifier,rocmetrics can find a correct model operating point using the same scheme that it applies to a multiclass classifier. If you specify classification scores that are not posterior probabilities as a vector, rocmetrics cannot identify a correct model operating point because it always uses 0.5 as a threshold for the model operating point.
The plot function displays a filled circle marker at the model operating point for each ROC curve (see ShowModelOperatingPoint). The function chooses a point corresponding to the typical threshold value. If the curve does not have a data point for the typical threshold value, the function finds a point that has the smallest threshold value greater than the typical threshold. The point on the curve indicates identical performance to the performance of the typical threshold value.
Algorithms
For each class, rocmetrics adjusts the classification scores (input argumentScores of rocmetrics) relative to the scores for the rest of the classes if you specify Scores as a matrix. Specifically, the adjusted score for a class given an observation is the difference between the score for the class and the maximum value of the scores for the rest of the classes.
For example, if you have [_s_1,_s_2,_s_3] in a row of Scores for a classification problem with three classes, the adjusted score values are [_s_1-max(_s_2,_s_3),_s_2-max(_s_1,_s_3),_s_3-max(_s_1,_s_2)].
rocmetrics computes the performance metrics using the adjusted score values for each class.
For a binary classification problem, you can specify Scores as a two-column matrix or a column vector. Using a two-column matrix is a simpler option because the predict function of a classification object returns classification scores as a matrix, which you can pass to rocmetrics. If you pass scores in a two-column matrix, rocmetrics adjusts scores in the same way that it adjusts scores for multiclass classification, and it computes performance metrics for both classes. You can use the metric values for one of the two classes to evaluate the binary classification problem. The metric values for a class returned byrocmetrics when you pass a two-column matrix are equivalent to the metric values returned by rocmetrics when you specify classification scores for the class as a column vector.
References
[1] Fawcett, T. “ROC Graphs: Notes and Practical Considerations for Researchers”, Machine Learning 31, no. 1 (2004): 1–38.
[2] Zweig, M., and G. Campbell. “Receiver-Operating Characteristic (ROC) Plots: A Fundamental Evaluation Tool in Clinical Medicine.” Clinical Chemistry 39, no. 4 (1993): 561–577.
[3] Davis, J., and M. Goadrich. “The Relationship Between Precision-Recall and ROC Curves.” Proceedings of ICML ’06, 2006, pp. 233–240.
[4] Moskowitz, C. S., and M. S. Pepe. “Quantifying and Comparing the Predictive Accuracy of Continuous Prognostic Factors for Binary Outcomes.” Biostatistics 5, no. 1 (2004): 113–27.
[5] Huang, Y., M. S. Pepe, and Z. Feng. “Evaluating the Predictiveness of a Continuous Marker.” U. Washington Biostatistics Paper Series, 2006, 250–61.
[6] Briggs, W. M., and R. Zaretzki. “The Skill Plot: A Graphical Technique for Evaluating Continuous Diagnostic Tests.”Biometrics 64, no. 1 (2008): 250–256.
[7] Bettinger, R. “Cost-Sensitive Classifier Selection Using the ROC Convex Hull Method.” SAS Institute, 2003.
[8] DiCiccio, Thomas J., and Bradley Efron. “Bootstrap Confidence Intervals.” Statistical Science 11, no. 3 (1996): 189–228.
[9] Efron, Bradley, and Robert J. Tibshirani. An Introduction to the Bootstrap. New York: Chapman & Hall, 1993.
[10] Efron, Bradley. The Jackknife, the Bootstrap and Other Resampling Plans. Philadelphia: The Society for Industrial and Applied Mathematics, 1982.
[11] Davison, A. C., and D. V. Hinkley. Bootstrap Methods and Their Applications. Cambridge University Press, 1997.
Version History
Introduced in R2022b
rocmetrics has several changes and extensions:
- The new
aucfunction computes the AUC of some named curves. Arocmetricsobject no longer has anAUCproperty. - The new
modelOperatingPointfunction returns the model performance for each class. - The
AverageROCTypename-value argument of theplotfunction is renamedAverageCurveType, and applies to non-ROC curves as well as ROC curves. - The model operating point can be plotted using the
ShowModelOperatingPointname-value argument of theplotfunction. The operating point is displayed for averaged curves as well as nonaveraged curves. - The
averagefunction is extended to compute the average of any two metrics. - The
AdditionalMetricsname-value argument ofrocmetricshas new values:'f1score', which computes the F1 score;'precision', which is the same as'ppv'and'prec'; and'all', which computes all supported metrics. - The
metricsinput argument of theaddMetricsfunction takes the same new values as theAdditionalMetricsname-value argument ofrocmetrics.
If you use nondefault misclassification costs by specifying the Cost name-value argument, and you use scores for a KNN, discriminant analysis, or naive Bayes model, set the ApplyCostToScores name-value argument to true. Because these models use expected classification costs rather than scores to predict labels, this setting enables the function to transform the scores appropriately.