Array Plot - Display vectors or arrays - Simulink (original) (raw)
Display vectors or arrays

Libraries:
DSP System Toolbox / Sinks
Description
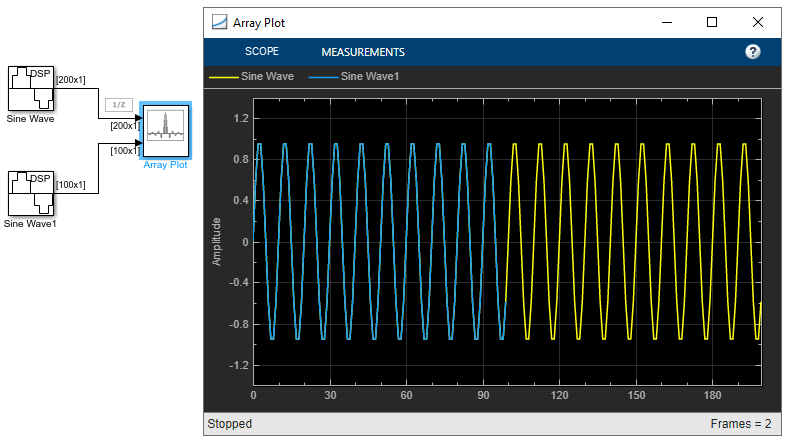
The Array Plot block plots vectors or arrays of data.
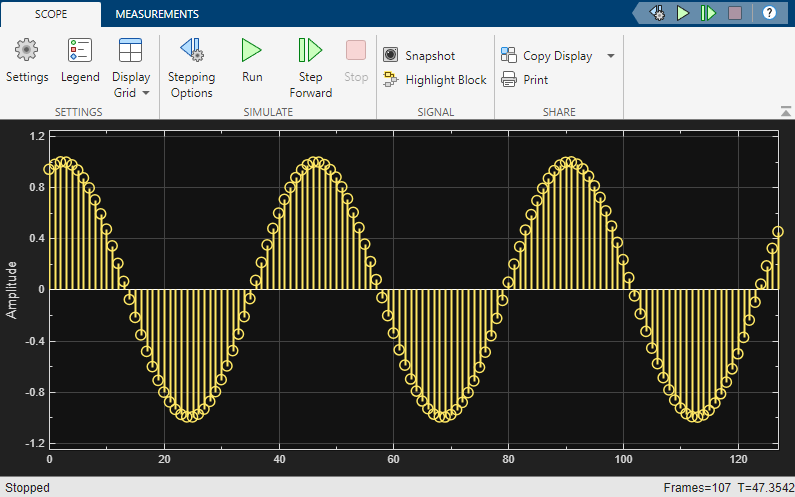
The Array Plot is a vector plot where data is uniformly spaced along the _x_-axis. To modify the spacing, change the Sample Increment property.
Measurements available:
- Data Cursors — Measure signal values using vertical and horizontal cursors.
- Signal Statistics — Display the maximum, minimum, peak-to-peak difference, mean, median, and RMS values of a selected signal.
- Peak Finder — Find maxima, showing the _x_-axis values at which they occur.
Examples
Ports
Input
Connect the signals you want to visualize. You can have up to 96 input ports. Input signals must have these characteristics:
- Fixed number of channels, but size can be variable
- Discrete, continuous, or constant sample time
- Real or complex values
- Floating- or fixed-point data type
- 2-D and nonscalar
The Array Plot block supports inputs with different frame lengths.
This block accepts fixed-point input, but converts it todouble for display.
Data Types: single | double | int8 | int16 | int32 | int64 | uint8 | uint16 | uint32 | uint64 | Boolean | fixed point | enumerated
Complex Number Support: Yes
Properties
For information about how to configure the Array Plot and use the toolstrip, see Configure Array Plot.
Scope
Select this option to show the legend on the plot. The names listed in the legend are taken from the Channel Names property.
From the legend, you can control which signals are visible. This control is equivalent to changing the visibility in the Color and Styling properties. In the scope legend, click a signal name to hide the signal in the scope. To show the signal, click the signal name again. To show only one signal, right-click the signal name, which hides all other signals. To show all signals, pressEsc.
Note
The legend only shows the first 20 signals. Any additional signals cannot be controlled from the legend.
Tunable: Yes
Programmatic Use
| Block Parameter: ShowLegend |
|---|
| Type: logical |
Since R2024b
Click Display Grid and select a grid to specify the layout of the display. When you select a 2-by-2 layout, for example, the scope shows four displays arranged in a 2-by-2 matrix. The grid can have a maximum of five rows and five columns.
If you create a grid of multiple axes, to modify the settings of the individual axes, use the Active Display property in the Array Plot settings.
Tunable: Yes
Programmatic Use
| Block Parameter: LayoutDimensions |
|---|
| Type: character vector or string scalar |
| Values: two-element vector |
Click this button to copy the scope display to the clipboard. You can preserve the color in the display by selecting Preserve Colors in theCopy to Clipboard drop down.
When you copy the display to the clipboard using the Copy to Clipboard and the Print options in theScope tab > Share section, select this parameter for the scope to preserve the colors.
To access Preserve Colors, click the drop-down arrow for Copy to Clipboard.
Tunable: Yes
Click this button to save the scope display as an image or a PDF or to print the display.
Settings
Data and Axes
Select the type of spacing to use between _x_-axis data values.
- Increment and Offset — Use the Sample Increment and X-Offset values to specify _x_-axis data.
- Custom — Specify a custom spacing between data values using the Custom X-Data property.
Programmatic Use
| Block Parameter: XDataMode |
|---|
| Type: character vector or string scalar |
| Values: 'Sample increment and X-offset' |'Custom' |
Specify the spacing between samples along the_x_-axis as a finite numeric scalar. The input signal is only _y_-axis data. _x_-axis data is set automatically based on both the Sample Increment and X-Offset values.
Example: When X-Offset is 0 and Sample Increment is 1, the _x_-axis values are set to 0, 1, 2, 3, 4, … .
Example: When X-Offset is -1 and Sample Increment is 0.25, the _x_-axis values are set to -1, -0.75, -0.5, -0.25, 0, … .
Tunable: Yes
Dependencies
To use this property, set X-Data Mode to Increment and Offset.
Programmatic Use
| Block Parameter: SampleIncrement |
|---|
| Type: character vector or string scalar |
| Values: scalar |
Specify the offset to apply to the _x_-axis, as a numeric scalar. _x_-axis data is set automatically based on both the Sample Increment andX-Offset values. The x-offset represents the first value on the _x_-axis.
Example: When X-Offset is 0 and Sample Increment is 1, the _x_-axis values are set to 0, 1, 2, 3, 4, … .
Example: When X-Offset is -1 and Sample Increment is 0.25, the _x_-axis values are set to -1, -0.75, -0.5, -0.25, 0, … .
Tunable: Yes
Dependencies
To use this property, set X-Data Mode to Increment and Offset.
Programmatic Use
| Block Parameter: XOffset |
|---|
| Type: character vector or string scalar |
| Values: scalar |
Specify the _x_-axis data values as a vector equal in length to the frame length of the inputs. If you use the default (empty vector) value, the _x_-axis data is uniformly spaced over the interval (0:_L_-1), where L is the frame length.
Example: A custom logarithmic _x_-axis data scaling is[0:log10(44100/2):1024]
Tunable: Yes
Dependencies
To use this property, set X-Data Mode to Custom.
Programmatic Use
| Block Parameter: CustomXData |
|---|
| Type: character vector or string scalar |
| Values: scalar |
| Default: '[]' |
The number of input ports to the block, specified as an integer between 1 and 96. To change the number of input ports, drag a new input signal line to the block and the block automatically creates new ports.
Programmatic Use
| Block Parameter: NumInputPorts |
|---|
| Type: character vector or string scalar |
| Values: scalar between 1 and 96 |
Select this parameter to automatically open the Array Plot window when you run the simulation.
Tunable: Yes
Programmatic Use
| Block Parameter: OpenAtSimulationStart |
|---|
| Type: logical |
Display and Labels
Select Linear or Log as the_x_-axis scale.
Tunable: Yes
Dependencies
If X-Offset is a negative value, you cannot set this parameter to Log.
Programmatic Use
| Block Parameter: XScale |
|---|
| Type: character vector or string scalar |
Select Linear or Log as the_y_-axis scale.
Tunable: Yes
Programmatic Use
| Block Parameter: YScale |
|---|
| Type: character vector or string scalar |
Since R2024b
Specify the precision of numeric values in the scope display as a positive integer in the range [1, 15].
Tunable: Yes
Since R2024b
Specify the active display as an integer display number. The settings in the Y-Limits, X-Label,Y-Label, Show Legend,Show Grid, Title, andMagnitude Phase Plot properties affect only the active display.
The number of the display corresponds to the row-wise placement index of the display. To control the layout of the display, clickDisplay Grid in the Scope tab and select a layout.
Tunable: Yes
Programmatic Use
| Block Parameter: ActiveDisplay |
|---|
| Type: character vector or string scalar |
| Values: integer display number ≥ 1 |
Specify the text for the scope to display below the_x_-axis.
Tunable: Yes
Programmatic Use
| Block Parameter: XLabel |
|---|
| Type: character vector or string scalar |
| Default: '' |
Specify the text to display on the _y_-axis. To display signal units, add (%<SignalUnits>) to the label. At the beginning of a simulation, Simulink replaces (%<SignalUnits>) with the units associated with the signals.
Example: For a velocity signal with units of m/s, enter Velocity (%<SignalUnits>).
Tunable: Yes
Dependencies
If you select Magnitude Phase Plot in the scope settings, this property does not apply. The_y_-axes are labeledMagnitude andPhase.
Programmatic Use
| Block Parameter: YLabel |
|---|
| Type: character vector or string scalar |
| Default: '' |
Specify a title for display. To use the input signal name for the title, enter %<SignalLabel>.
Tunable: Yes
Programmatic Use
| Block Parameter: Title |
|---|
| Type: character vector or string scalar |
| Default: '' |
Specify the _y_-axis limits as a two-element numeric vector, [ymin, ymax].
If you clear Magnitude Phase Plot, the default is[-10,10]. If the magnitude/phase plot is on, the default is [0,10].
Tunable: Yes
Dependencies
When you select Magnitude Phase Plot, this property specifies the _y_-axis limits of only the magnitude plot. The _y_-axis limits of the phase plot are always [-180,180].
Programmatic Use
| Block Parameter: YLimits |
|---|
| Type: character vector or string scalar |
| Value: two-element numeric vector |
Since R2024b
on— The scope displays magnitude and phase plots. If the signal is real, the scope plots the absolute value of the signal for the magnitude. The phase is 0 degrees for positive values and 180 degrees for negative values. This feature is useful for complex-valued input signals. If the input is a real-valued signal, selecting this parameter returns the absolute value of the signal for the magnitude.off— The scope displays a signal plot. If the signal is complex, the scope plots the real and imaginary parts on the same _y_-axis.
Tunable: Yes
Programmatic Use
| Block Parameter: PlotAsMagnitudePhase |
|---|
| Type: logical |
Since R2024b
Select this parameter to display the legend in the scope.
Tunable: Yes
Programmatic Use
| Block Parameter: ShowLegend |
|---|
| Type: logical |
Select this option to show grid lines on the plot.
Tunable: Yes
Programmatic Use
| Block Parameter: ShowGrid |
|---|
| Type: logical |
Color and Styling
Specify the type of plot for each channel as one of these:
Stem— Stem graph displayed as circles at the input value with vertical lines to the_x_-axis.Line— Line graph.Stairs— Stair-step graph. A stair-step graph is made up of only horizontal and vertical lines. Each horizontal line represents the signal value for a discrete sample period and is connected to two vertical lines. Each vertical line represents the change in the signal value occurring at a specific sample time.Bar–– Bar plot. (since R2024b)
You can individually control the type of plot for each line. To control the type of plot for a line, select the line and set the Plot Type parameter accordingly. (since R2025a)
Tunable: Yes
Programmatic Use
| Block Parameter: PlotType |
|---|
| Type: character vector or string scalar |
Specify the font size of labels in the display as a finite positive real scalar in the range [1,100].
Tunable: Yes
Specify the background color in the scope figure.
Tunable: Yes
Specify the background color of the axes.
Tunable: Yes
Specify the color of the labels, grid, and the channel names in the legend.
Tunable: Yes
Specify the channel for which you want to modify the visibility, line color, style, width, and marker properties.
Tunable: Yes
Select this check box to display the channel you have selected. If you clear this check box, the selected channel is no longer visible. You can also click the signal name in the legend to control its visibility. For more details, see Legend.
Tunable: Yes
Specify the line style for the selected channel.
Tunable: Yes
Dependencies
To enable this property, select Plot Type toBar. (since R2024b)
Specify the line width for the selected channel when you selectPlot Type to Line,Stairs, orStem. The default value of line width is1.5.
When you set Plot Type to Bar, you can use this property to specify the relative width of individual bars for the selected channel. The value of this property can be a scalar in the range [0,1]. Use this property to control the separation of bars within a display. At the default value of 0.9, the scope separates the bars slightly. If you set this property to1, then adjacent bars touch. (since R2024b)
Tunable: Yes
Specify a data point marker for the selected channel. This parameter is similar to the Marker property for plots. You can choose any of the marker symbols from the drop-down list.
Tunable: Yes
Dependencies
To enable this property, select Plot Type toBar. (since R2024b)
Specify the line color for the selected channel.
Tunable: Yes
Property Inspector Only
Input channel names, specified as a character vector, string, or array of either. The names appear in the legend,Settings, and Measurements panels. If you do not specify names, the channels are labeled asChannel 1, Channel 2, etc.
Example: ["A","B"]
Dependencies
To see channel names, set Legend to true.
Programmatic Use
| Block Parameter: ChannelNames |
|---|
| Type: cell array of character vectors or string array |
Auto— If Title and Y-Label properties are not specified, maximize all plots.On— Maximize all plots. Values inTitle and Y-label are hidden.Off— Do not maximize plots.
Hover over the array plot to see the maximize axes button![]() .
.
Tunable: Yes
Programmatic Use
| Block Parameter: MaximizeAxes |
|---|
| Type: character vector or string scalar |
OnceAtStop— Scale_y_-axis after the simulation is finished.Manual— Manually scale_y_-axis range with the Scale Y-axis Limits toolbar button.Auto— Scale _y_-axis range during and after simulation.Updates— Scale _y_-axis after the number of time steps specified in the Number of Updates text box (100by default). Scaling occurs only once during each run.
Tunable: Yes
Programmatic Use
| Block Parameter: AxesScaling |
|---|
| Type: character vector or string scalar |
Set this property to delay auto scaling the y-axis.
Tunable: Yes
Dependencies
To enable this property, set Axes Scaling to Updates.
Programmatic Use
| Block Parameter: AxesScalingNumUpdates |
|---|
| Type: character vector or string scalar |
| Values: scalar |
Block Characteristics
| Data Types | Boolean | double | enumerated | fixed point | half | integer | single |
|---|---|---|---|---|---|---|
| Direct Feedthrough | no | |||||
| Multidimensional Signals | yes | |||||
| Variable-Size Signals | yes | |||||
| Zero-Crossing Detection | no |
Extended Capabilities
This block can be used for simulation visibility in systems that generate code, but is not included in the generated code.
Version History
Introduced in R2015b
You can now individually control the type of plot for each line. To control the type of plot for a line, select the line and set the Plot Type parameter accordingly.
The Array Plot block now supports bar plots. To view data using a bar plot, set Plot Type to Bar in Array Plot settings > Color and Styling.
Click the new Display Grid property in theScope tab to specify the layout of the Array Plot scope display. When you select a 2-by-2 layout, for example, the scope shows four displays arranged in a 2-by-2 matrix. The display grid can have a maximum of five rows and five columns.
You can now specify the active display using the Active Display property in the Array Plot settings > Display and Labels. The settings in the Y-Limits,X-Label, Y-Label, Show Legend, Show Grid, Title, and Magnitude Phase Plot properties affect only the active display.
You can now increase the display precision to 15 digits using the Display Precision property in the scope settings under Display and Labels. This precision affects all the measurements and data that the scope displays on its status bar.
The Preserve colors for copy to clipboard property has been renamed to Preserve Colors and is now available in the scope toolstrip under Copy Display.
The Magnitude Phase property has been renamed toMagnitude Phase Plot and is now available in the Array Plot settings > Display and Labels.
The Show Legend property is now also available in the Array Plot settings > Display and Labels. To control the legend display, you can select Legend in theScope tab of the Array Plot toolstrip or select theShow Legend property.
The Plot tab in array plot has been renamed asScope tab.