coder.profile.test.runTests - Automate execution-time or stack usage analysis of code generated from Simulink models or MATLAB functions - MATLAB (original) (raw)
Automate execution-time or stack usage analysis of code generated from Simulink models or MATLAB functions
Since R2024a
Syntax
Description
[resultsSet](#mw%5F3a30e124-ff66-4817-a118-7ac8855ecb70) = coder.profile.test.runTests([testComponent](#mw%5Fcc8d1e72-581a-43ac-a05b-896a49fd13e2)) runs software-in-the-loop (SIL) or processor-in-the-loop (PIL) tests of the Simulink® model, testComponent, by using inputs provided by the model. The function runs in two stages. First, the function runs the tests with only task profiling enabled. Then, the function runs the most demanding tests again with detailed function profiling enabled.
In the first stage, runTests captures the execution times of tasks for the given inputs. In the second stage, runTests identifies how code is executed. For example, it generates a visualization of the function-call stack.runTests does not run detailed profiling in the first stage because instrumentation overhead can be significant and invalidate the acquired time measurements.
The function stores execution-time results in the resultsSet object. Use the Code Profile Analyzer app to analyze the results.
For information about importing test cases into a model, see Overview of Signal Loading Techniques andLoad Input Data for Basic Test Cases.
[resultsSet](#mw%5F3a30e124-ff66-4817-a118-7ac8855ecb70) = coder.profile.test.runTests([testComponent](#mw%5Fcc8d1e72-581a-43ac-a05b-896a49fd13e2),CodeMetric="stack") runs software-in-the-loop (SIL) or processor-in-the-loop (PIL) tests of the Simulink model and stores stack usage results in the resultsSet object. For stack usage analysis, there is only one stage because instrumentation does not affect the results. Use the Code Profile Analyzer app to analyze the results.
[resultsSet](#mw%5F3a30e124-ff66-4817-a118-7ac8855ecb70) = coder.profile.test.runTests([testComponent](#mw%5Fcc8d1e72-581a-43ac-a05b-896a49fd13e2),TestFile="myTestFile") runs software-in-the-loop (SIL) or processor-in-the-loop (PIL) tests of the model by using test cases in the Simulink Test™ file myTestFile. As explained previously, the function runs in two stages to reduce the impact of instrumentation overhead.
If the test cases cover system requirements and exercise as many as possible code paths, you can use the function and the Code Profile Analyzer app to identify and analyze performance hotspots in the generated code.
[resultsSet](#mw%5F3a30e124-ff66-4817-a118-7ac8855ecb70) = coder.profile.test.runTests([testComponent](#mw%5Fcc8d1e72-581a-43ac-a05b-896a49fd13e2),MATLABConfig=objConfig,MATLABInputs=inputSource) runs software-in-the-loop (SIL) or processor-in-the-loop (PIL) tests of the MATLAB® function, _`testComponent`_, by using inputs provided by _`inputSource`_.
objConfig is a MATLAB configuration object for code generation.
[[resultsSet](#mw%5F3a30e124-ff66-4817-a118-7ac8855ecb70) [secondResultsSet](#mw%5Fc701b556-3a1d-4337-bbe0-078213523150)] = coder.profile.test.runTests(___,OverrideSettings=keyValueMapping) runs two SIL or PIL tests using keyValueMapping, aMap object that maps model configuration parameters to pairs of values. For the first test, the function uses the first value of each pair. For the second test, the function uses the second value of each pair. The function returns two sets of results,resultsSet and secondResultsSet.
[resultsSet](#mw%5F3a30e124-ff66-4817-a118-7ac8855ecb70) = coder.profile.test.runTests(___,[Name=Value](#namevaluepairarguments)) runs software-in-the-loop (SIL) or processor-in-the-loop (PIL) tests of the Simulink model or MATLAB function using one or more name-value arguments.
Examples
You can use coder.profile.test.runTests and the Code Profile Analyzer app to identify and analyze performance hotspots in generated code.
This example shows how you can perform execution-time and stack usage profiling of code generated from a MATLAB function.
Open the example that contains the required files.
openExample('ecoder/KalmanFilterExample')
Load the inputs.
load position.mat numPts = 300; inputs = cell(1, numPts); for idx = 1: numPts inputs{idx} = {position(:,idx)}; end
Create a MATLAB configuration object.
config = coder.config('lib'); config.VerificationMode = 'SIL'; config.EnableOpenMP = false;
Run tests with execution-time and stack usage profiling enabled.
myFcn = 'kalman01';
resTime = coder.profile.test.runTests(myFcn, ... MATLABConfig=config, ... MATLABInputs=inputs, ... NumIterations=5);
resStack = coder.profile.test.runTests(myFcn, ... CodeMetric="stack", ... MATLABConfig=config, ... MATLABInputs=inputs);
To view execution-time results in the Code Profile Analyzer app, run:
coder.profile.show(resTime);
The Cumulative Results tab displays the Task Summary and Test Details views. When you select a function in the Task Summary view, the Test Details view lists the SIL tests performed in order of execution time.
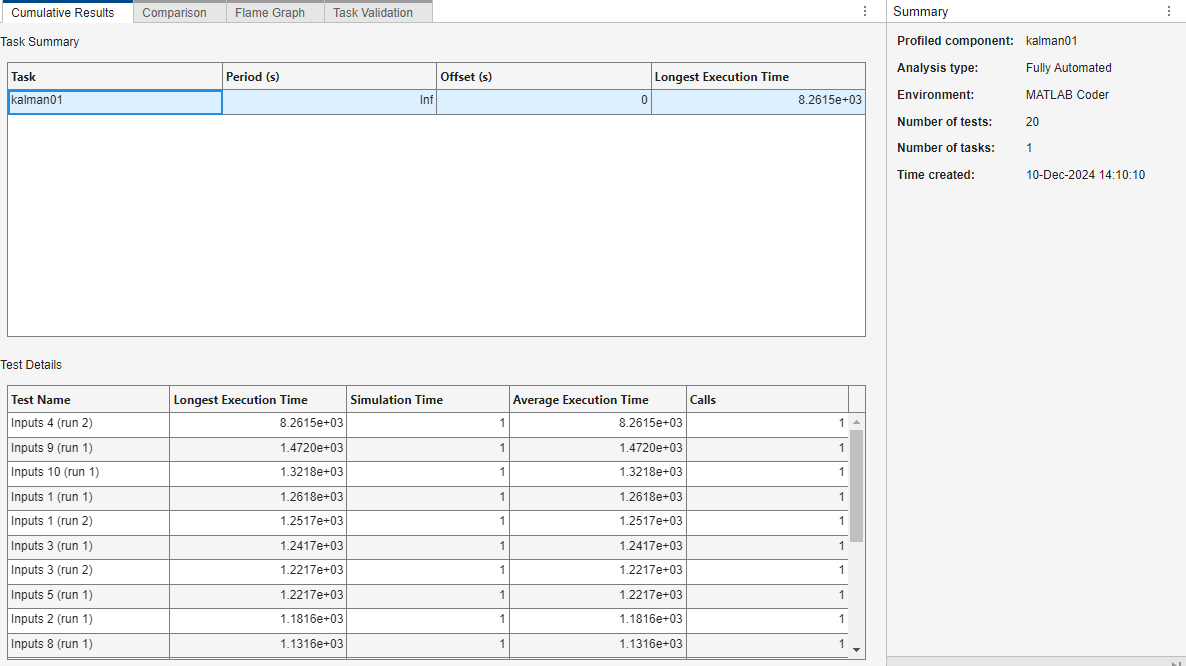
For more information about analyzing execution-time results, see Automate Identification of Hotspots in Generated Code.
To view stack usage results in the Code Profile Analyzer app, run:
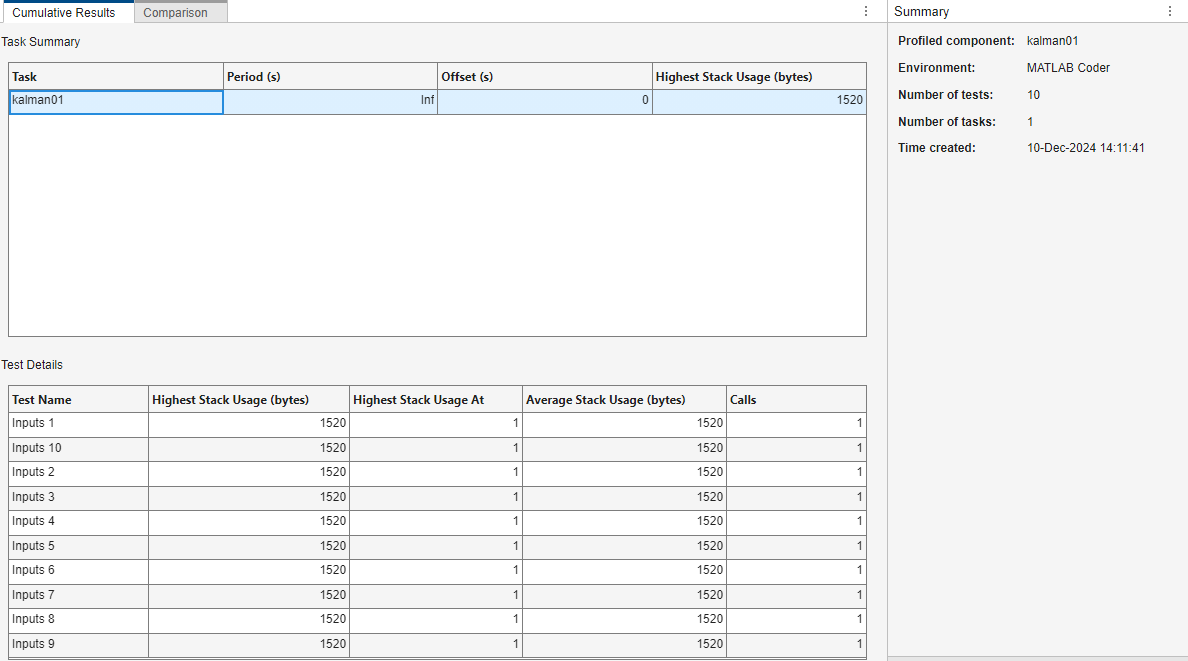
coder.profile.show(resStack);
The Cumulative Results tab displays the Task Summary and Test Details views. If you selectkalman01 in the Task Summary view, theTest Details view shows constant stack usage for the SIL tests.
This example shows how you can use key-value mapping to loop over pairs of configuration parameter options.
Open the model SILTopModel.
openExample('ecoder/SILPILVerificationExample', ... supportingFile='SILTopModel.slx') model = bdroot;
Disable Simulink Coverage™ and third-party code coverage analysis.
set_param(model,'CovEnable','off'); covSettings = get_param(model,'CodeCoverageSettings'); covSettings.CoverageTool = 'None'; set_param(model,'CodeCoverageSettings',covSettings);
Use key-value mapping to specify loop-over values for theBuildConfiguration configuration parameter.
params = containers.Map('KeyType','char', 'ValueType','any'); params("BuildConfiguration") = {"Faster Builds", "Faster Runs"};
Run SIL tests with execution-time profiling enabled.
[resTime1, resTime2] = coder.profile.test.runTests(model, ... OverrideSettings=params);
To compare execution-time results, use the Code Profile Analyzer app. Display the first set of results.
coder.profile.show(resTime1)
On the Time Profiling tab, select theComparison tab. From the Select a profile variable list, choose resTime2, which contains the second set of results. Then, click Compare.
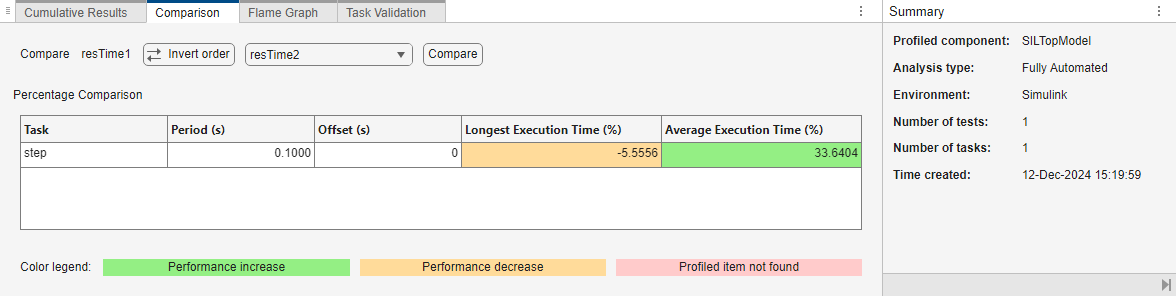
The values in the Longest Execution Time (%) andAverage Execution Time (%) cells indicate that, whenBuildConfiguration is set to "Faster Runs", the longest step execution time is slightly longer but the average step execution time is significantly reduced.
Specify loop-over values for an additional configuration parameter.
params("MaxStackSize") = {"64","256"};
Run SIL tests with stack usage profiling enabled.
[resStack1, resStack2] = coder.profile.test.runTests(model, ... CodeMetric="stack", ... OverrideSettings=params);
Display the first set of results.
coder.profile.show(resStack1)
On the Memory Profiling tab, select theComparison tab. From the Select a profile variable list, choose resStack2, which contains the second set of results. Then, click Compare.
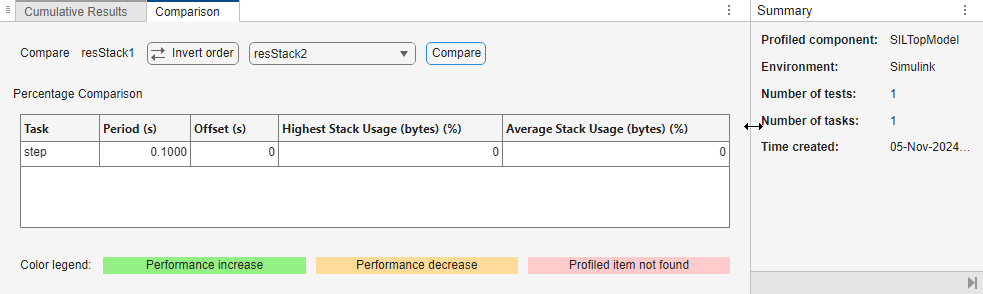
The display shows values of zero in the Highest Stack Usage (bytes) (%) and Average Stack Usage (bytes) (%) cells. In this example, changing the configuration parameter combination fromBuildConfiguration="Faster Builds" andMaxStackSize="64" to BuildConfiguration="Faster Runs" and MaxStackSize="256" does not affect stack usage metrics for the generated code.
This example shows how you can use a coder.profile.test.TestHook object to customize automated execution-time profiling.
Open the model SILTopModel.
openExample('ecoder/SILPILVerificationExample', ... supportingFile='SILTopModel.slx') model = bdroot;
Disable Simulink Coverage and third-party code coverage analysis.
set_param(model,'CovEnable','off'); covSettings = get_param(model,'CodeCoverageSettings'); covSettings.CoverageTool = 'None'; set_param(model,'CodeCoverageSettings',covSettings);
In your working folder, provide MATLAB code that specifies a subclass ofcoder.profile.test.TestHook and defines functionality for hooks. For example, myTestHook.m.
classdef myTestHook < coder.profile.test.TestHook methods(Access = public) function TestSetup(this) disp("-------------> PRETESTS_START_HOOK"); end function TestStart(this, modelName, isTaskProfilingStage) disp("-------------> PRETEST_RUN_HOOK"); end function TestEnd(this, modelName, isTaskProfilingStage) disp("-------------> POSTTEST_RUN_HOOK"); end function TestCleanup(this, aggregatedResults) disp("-------------> POSTTESTS_PREEXIT_HOOK"); aggregatedResults.addDetails("Item1","Description for Item1"); aggregatedResults.addDetails("Item2","Description for Item2"); end end end
Run coder.profile.test.runTests, which invokes the test hooks.
resTime = coder.profile.test.runTests(model, ... "TestHooks", myTestHook());
-------------> PRETESTS_START_HOOK -------------> PRETEST_RUN_HOOK
Searching for referenced models in model 'SILTopModel'.
Total of 1 models to build.
Starting build procedure for: SILTopModel
Successful completion of build procedure for: SILTopModel
Build Summary
Top model targets:
Model Build Reason Status Build Duration
SILTopModel Generated code was out of date. Code generated and compiled. 0h 0m 9.7842s
1 of 1 models built (0 models already up to date) Build duration: 0h 0m 10.145s
Preparing to start SIL simulation ...
Building with 'Microsoft Visual C++ 2022 (C)'. MEX completed successfully.
Starting SIL simulation for component: SILTopModel
Application stopped
Stopping SIL simulation for component: SILTopModel
-------------> POSTTEST_RUN_HOOK -------------> PRETEST_RUN_HOOK
Searching for referenced models in model 'SILTopModel'.
Total of 1 models to build.
Starting build procedure for: SILTopModel
Successful completion of build procedure for: SILTopModel
Build Summary
Top model targets:
Model Build Reason Status Build Duration
SILTopModel Generated code was out of date. Code generated and compiled. 0h 0m 10.157s
1 of 1 models built (0 models already up to date) Build duration: 0h 0m 10.448s
Preparing to start SIL simulation ...
Building with 'Microsoft Visual C++ 2022 (C)'. MEX completed successfully.
Starting SIL simulation for component: SILTopModel
Application stopped
Stopping SIL simulation for component: SILTopModel
-------------> POSTTEST_RUN_HOOK -------------> POSTTESTS_PREEXIT_HOOK
The build output contains hook messages.
To view results in the Code Profile Analyzer app, run:
coder.profile.show(resTime)
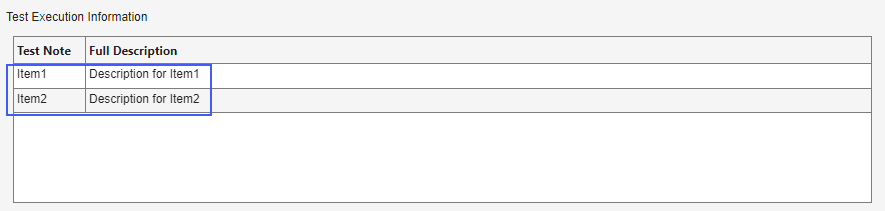
On the Cumulative Results tab, the Test Execution Information section displays the information that you provided through theaddDetails function.
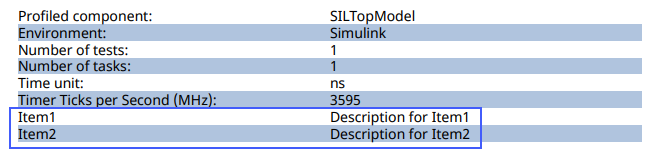
In the Results section of the toolstrip, click Create PDF. The PDF report displays the information that you supplied through theaddDetails function.
Input Arguments
Name of Simulink model or MATLAB function that produces generated code. For a MATLAB function, you must also specify the MATLABConfig andMATLABInputs name-value arguments.
Example: runTests('myModel');
Name-Value Arguments
Specify optional pairs of arguments asName1=Value1,...,NameN=ValueN, where Name is the argument name and Value is the corresponding value. Name-value arguments must appear after other arguments, but the order of the pairs does not matter.
Example: runTests('myModel', Testfile="myTestFile");
Simulink Test file for model.
Example: runTests('myModel', Testfile="myTestFile");
Type of code profiling metric to analyze for generated code:
"time"— Execution-time metrics"stack"— Stack usage metrics
Example: runTests('myModel', CodeMetric="stack");
Investigate the effect of specific parameters on code execution-time and stack usage. Using a Map object, specify::
- As keys, model configuration parameters that you want to override
- For each key, a two-element cell array that contains two parameter values
The function runs two SIL or PIL tests using the Map object. For the first test, the function uses the first value of each key. For the second test, the function uses the second value of each key. The function returns two sets of results.
Example: runTests('myModel', OverrideSettings=containers.Map("MaxStackSize",{"64","256"}));
Specify MATLAB configuration object to use for code generation during SIL or PIL test.
Example: runTests("myFunction.m", MATLABConfig=myConfigObj, MATLABInputs=myInputSource);
Specify input source for SIL or PIL testing of MATLAB function.
Example: runTests("myFunction.m", MATLABConfig=myConfigObj, MATLABInputs=myInputSource);
For advanced target applications, increasing the number of SIL or PIL tests can yield more stable execution times. If you have a Simulink model or MATLAB function that you consider a benchmark, use this argument to specify the number of times the function runs the SIL or PIL test.
Applies only if CodeMetric is "time" andTestfile is empty.
Example: runTests("myFunction.m",MATLABConfig=cfg,MATLABInputs=in,NumIterations=10);
Object that analysis adds results to. If you do not specify an object, the function creates a new object.
Example: runTests('myModel', AppendResultsTo=myNameObject);
Number of most demanding tests to rerun for each task with detailed profiling enabled. Applies to execution-time analysis only.
Example: runTests('myModel', NumTestsForDetailedProfiling=6);
Specify a custom object that inherits fromcoder.profile.test.TestHook. The function invokes object methods at predefined moments during the SIL or PIL test.
Example: runTests('myModel',TestHooks=myTestHook());
Verbosity for debugging:
false— No messages shown during analysis.true— Diagnostic message shown after each step.
Example: runTests('myModel', Verbose=true);
Output Arguments
Object that stores test results returned by SIL or PIL tests. If you specifyOverrideSettings, object stores results from the first input set. Object type is:
coder.profile.ExecutionTimeSetifCodeMetricis"time"coder.profile.ExecutionStackSetifCodeMetricis"stack"
If you specify OverrideSettings, object stores results from the second input set. Object type is:
coder.profile.ExecutionTimeSetifCodeMetricis"time"coder.profile.ExecutionStackSetifCodeMetricis"stack"
If you do not specify OverrideSettings, object is empty.
Version History
Introduced in R2024a
To enhance automated code execution-time and stack usage profiling workflows, the function supports these name-value arguments:
OverrideSettingsMATLABConfigMATLABInputsNumIterationsTestHooks
The function can also return a second output argumentsecondResultsSet.