Analyzing Network Performance Using the Deep Learning Dashboard - MATLAB & Simulink (original) (raw)
You can identify performance bottlenecks in deep learning network code by using the Deep Learning Dashboard to analyze the runtime statistics of the network. The dashboard includes:
- An overview of the network execution
- A layer-level breakdown of the network runtime
- Diagnostic messages that identify possible bottlenecks
Use the dashboard to identify bottlenecks and improve the performance of the generated code.
To generate a report that includes the Deep Learning Dashboard, see Analyze Performance of Code Generated for Deep Learning Networks.
Opening the Deep Learning Dashboard
To open the Deep Learning Dashboard, generate a GPU Performance Analyzer report for an entry-point function using the gpuPerformanceAnalyzer function. When the entry-point function contains a deep learning network, the app enables the Show Predict Functions button.
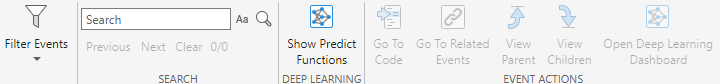
The report indicates deep learning inference functions with the network icon. To see all deep learning inference functions, clickShow Predict Functions. The Profiling Timeline pane shows the deep learning functions in the Functions row. In this example, there is only one predict function, dlnetwork_predict.
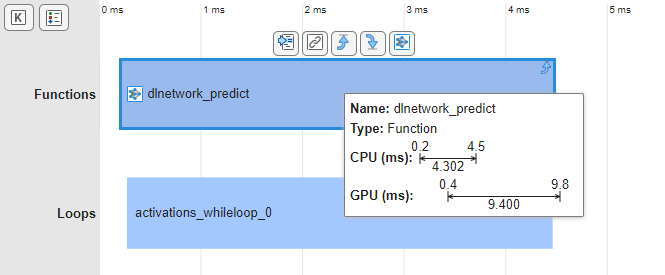
To open the dashboard, in the Profiling Timeline, click the predict function, dlnetwork_predict. Then, in the toolstrip, clickOpen Deep Learning Dashboard. Alternatively, in the toolbar above the event in the Profiling Timeline, click the Network button. The Deep Learning Dashboard shows the runtime data for the predict function.
Assessing Network Performance
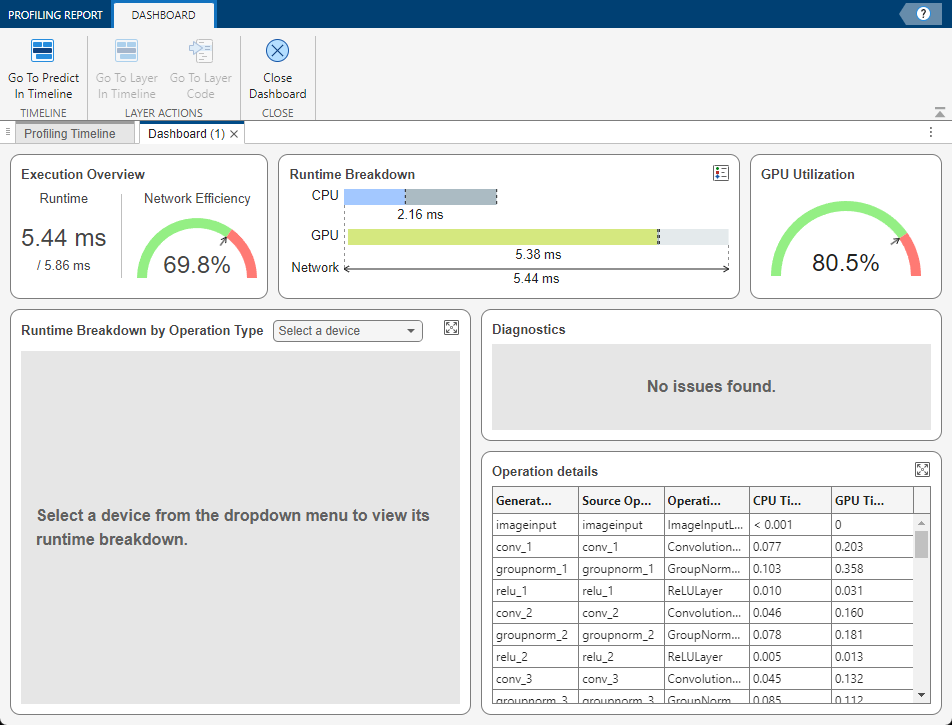
The dashboard summarizes the network execution, runtime, and GPU utilization. Use theExecution Overview, Runtime Breakdown, andGPU Utilization panes to assess the performance of the network.
Examine Execution Overview Pane
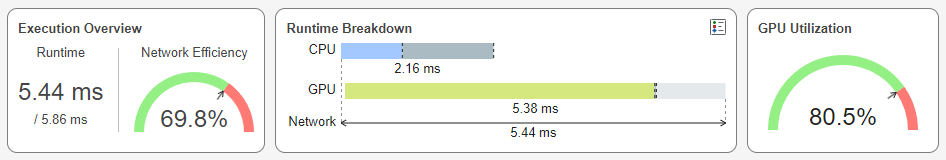
The Execution Overview pane contains the execution time of the inference and the percent efficiency. The Runtime section shows the execution time of the inference over the execution time of the entry-point function. TheNetwork Efficiency section estimates the efficiency as a percent based on the runtime data. A low efficiency indicates you can optimize the network to improve its performance.
Examine the Runtime Breakdown
The Runtime Breakdown pane graphs the CPU and GPU activities over the course of the network runtime. The breakdown captures events such as:
- CPU and GPU computations
- Memory transfers
- CPU Overhead
- CPU and GPU idle time
Point to an event in the Runtime Breakdown to display the amount of time the event takes.
The breakdown uses color to distinguish between types of events. Click the Legend button to display the event types.
Measure GPU Utilization
The GPU Utilization pane displays the percent of the network runtime during which the GPU executed a kernel.
Examining Layer Metrics
To identify bottlenecks that decrease the network efficiency, use the Runtime Breakdown by Operation Type, Diagnostics, andOperation details panes to examine the layer-level metrics. You can use these panes to identify bottlenecks, visualize layer-level performance, and view the performance data for each layer in the network.
Diagnostics Pane
The Diagnostics pane highlights layers that may be bottlenecks. The dashboard uses runtime metrics to detect whether a layer is a bottleneck and suggests ways to optimize the performance, if possible.
Runtime Breakdown by Operation Type pane
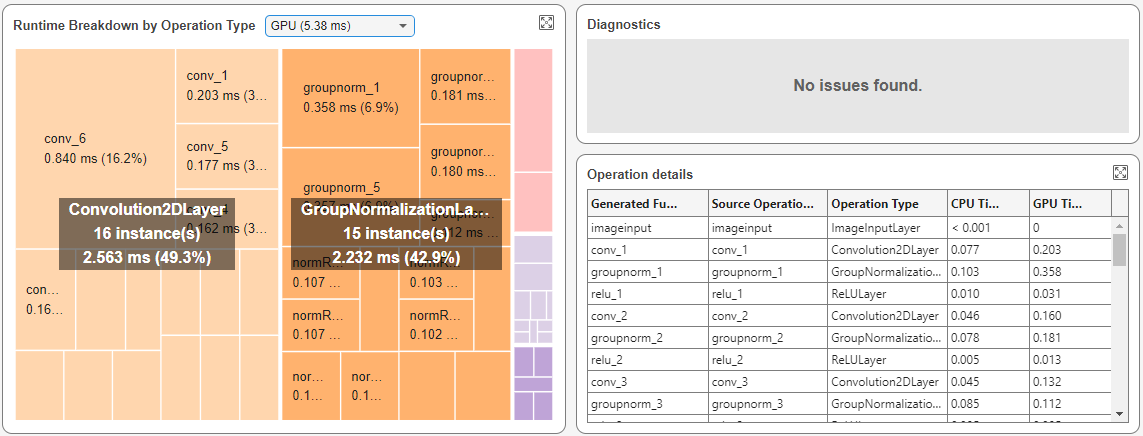
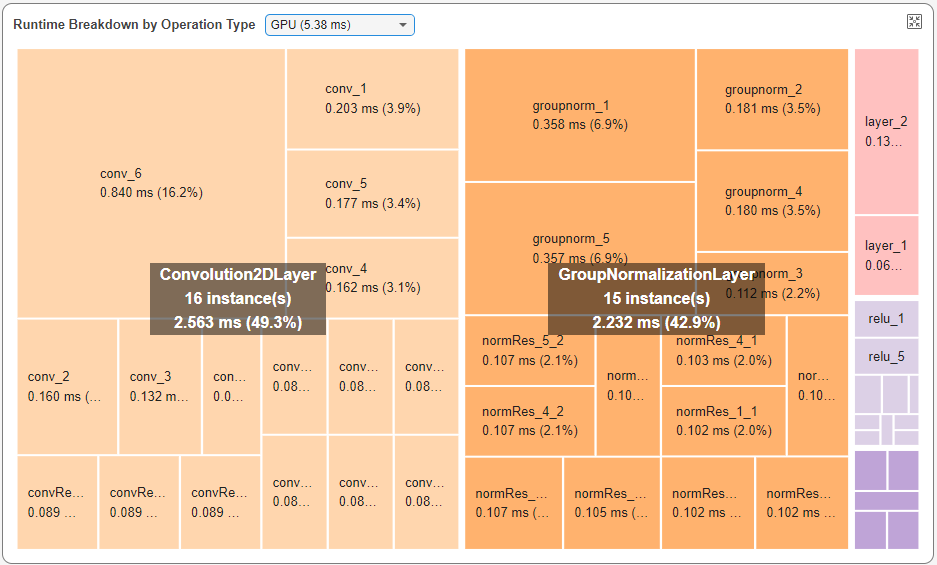
To identify layers that slow down the deep learning network, use the Runtime Breakdown by Operation Type pane. The pane uses a tree map to group layers by type and display layers that take longer with more area.
Use the Select a device list to view the layer performance on the CPU or the GPU. The breakdown highlights 2-D convolution layers as the operation type that takes the longest time. For example, this image shows a network where 2-D convolution layers took the most time on the GPU followed by group normalization layers.
Operation Details pane
To view layer runtime statistics, use the table in the Operation Details pane. The table collects performance data for each layer, including CPU and GPU execution times.
Tracing Between Layers and Profiling Timeline
You can trace a layer in the dashboard to the Profiling Timeline tab to view the events taking place on the CPU and GPU during the layer execution. To view a layer in the Profiling Timeline tab, select the layer in theRuntime Breakdown by Operation Type pane. Selecting a layer enables the Layer Actions section of the toolstrip to trace the layer to the timeline and code. For example, this image shows a layer namedconv_6.
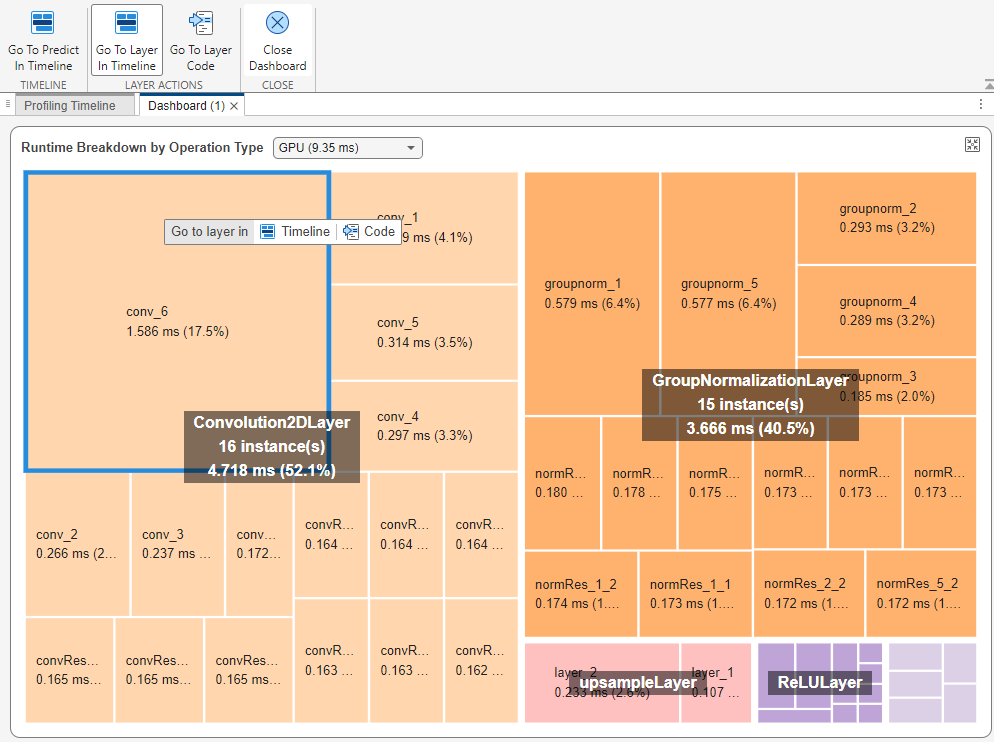
In the Layer Actions section, click Go To Layer In Timeline to open the Profiling Timeline and select the layer. The timeline zooms in to the conv_6 layer in theFunctions row.
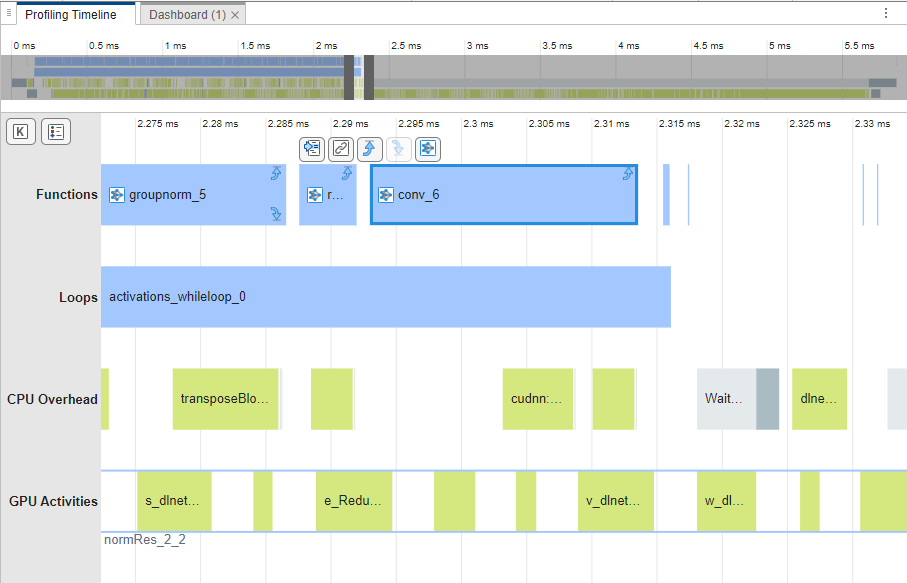
To return to the Deep Learning Dashboard, open theDashboard tab. Alternatively, you can select the layer to reopen the dashboard. For example, you can select the conv_6 layer, and, in the toolstrip, click Open Deep Learning Dashboard. The report opens the dashboard for the inference that calls conv_6.