GPU Performance Analyzer - MATLAB & Simulink (original) (raw)
The GPU Performance Analyzer presents GPU and CPU activities, events, and performance metrics from generated CUDA® code in a chronological timeline plot. The Performance Analyzer visualizes the events with detailed performance data to highlight potential bottlenecks. Use the Performance Analyzer report to understand and address performance bottlenecks in your design.

This topic shows an example GPU Performance Analyzer report. To generate a GPU Performance Analyzer report, see Analyze Performance of Generated CUDA Code.
Profiling Timeline
The Profiling Timeline tab shows the trace of the events. The timeline displays these events:
- Functions
- Deep learning layers
- Loops
- Memory transfers between the CPU and GPU
- GPU memory allocation and deallocation
- Kernels
This screenshot shows part of a profiling trace.

You can use the mouse wheel or a touchpad to zoom into and out of the timeline. Alternatively, you can use the timeline summary at the top of the tab to zoom and navigate the timeline plot. Use the Key Bindings button to display the bindings for the GPU Performance Analyzer. Use the Legend button to display the meanings of the colors.
The tooltips on each event show the start time, end time, and duration of the selected event on the CPU and the GPU. To learn more about an event, click the event. In the toolstrip, the Event Actions section shows the actions you can take, such as tracing generated code, viewing related events, or, for deep learning events, to open the Deep Learning Dashboard. For more information about theDeep Learning Dashboard, see Analyzing Network Performance Using the Deep Learning Dashboard.
By default, the timeline shows the results from the final run of the profiling session. To see profiling data for a previous iteration, in the toolstrip, in theFilters section, enable Show single run and select the number of the run. To view profiling data for the entire profiling session, including initialization and termination, select Show entire profiling session.
Profiling Summary
The Profiling Summary pane displays the GPU and CPU activities in the timeline. The GPU Activities and CPU Activities charts show the proportion of time the GPU and CPU spent on different events, respectively. To view summary data for a specific range of time, zoom in to the range in the Profiling Timeline tab. TheProfiling Summary summarizes the region shown in the timeline.
This image shows the Profiling Summary pane for the region selected on the timeline.

Examine Event Statistics
The Event Statistics pane shows additional information for the selected event. For example, suppose your project contains a kernel namedfog_rectification_kernel1. If you selectfog_rectification_kernel1 in the Profiling Timeline pane, the Event Statistics pane displays more information about it:

Investigate Performance Analyzer Diagnostics
Since R2025a
The GPU Performance Analyzer automatically detects common performance bottlenecks when you profile code using the gpuPerformanceAnalyzer function. TheProfiling Timeline marks the bottlenecks with a warning icon. If the Performance Analyzer detects a bottleneck, the Diagnostics pane includes:
- The location of the bottleneck in the generated CUDA code
- The events that cause the bottleneck
- The cause of the slowdown
- If possible, suggestions to improve the performance of the generated code
Use the diagnostics to rewrite your MATLAB® functions. After you rewrite your function, profile the generated code with the gpuPerformanceAnalyzer function to check whether the performance improved.
Navigate Call Tree
The Call Tree pane lists the GPU events called from the CPU. Each event in the call tree shows the execution times as percentages of the caller function. You can use this metric to identify performance bottlenecks in generated code. You can also navigate to specific events on the profiling timeline by clicking on the corresponding events in the call tree.
Trace Generated Code
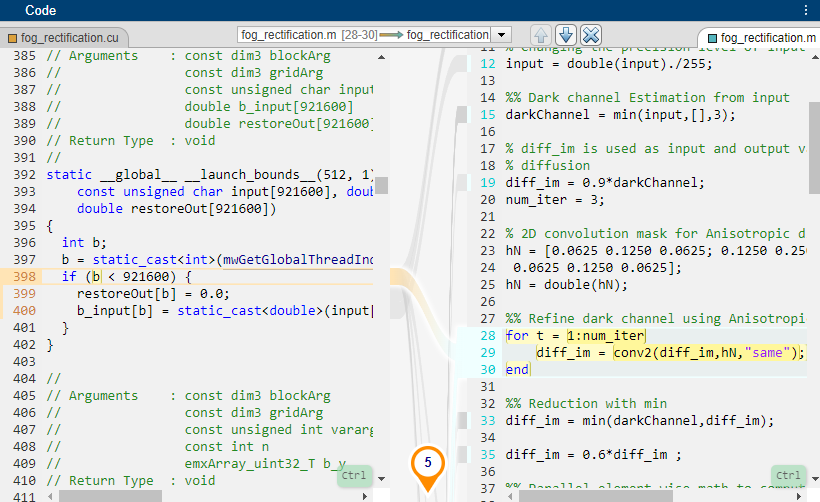
You can use the Code pane to trace from the MATLAB code to the CUDA code or from the CUDA code to the MATLAB code. Traceable code is blue on the side that you trace from and orange on the side that you trace to. As you move your pointer to the traceable code, the pane highlights the code in purple and traces the corresponding code on the other side. When you select a code section, the pane highlights the code in yellow. The code remains selected until you press Esc or select different code. To change the side that you trace, select code on the other side.
Set Up Filters
You can use the Filters section of the toolstrip to filter the report the events in the report and select which run to view.
- Show entire profiling session — Use this option to view profiling results for the entire application, including initialization and termination.
- Show single run — Use this option to view profiling results for a single iteration of the generated code. By default, the Performance Analyzer shows the results from the last run of the generated code.
- Under Filter Events:
- Threshold (ms) — Skip events shorter than the given threshold.
- Memory Allocation/Free — Show GPU device memory allocation and deallocation related events on the CPU activities bar.
- Memory Transfer — Show memory transfers to the host or device.
- Kernel — Show CPU kernel launches and GPU kernel activities.
- Other Event — Show other GPU related events such as synchronization and waiting for GPU.
Reopen a Performance Analyzer Report
To reopen an existing report, open the gpuProfiler.mldatx file generated by the gpuPerformanceAnalyzer function. By default, the gpuPerformanceAnalyzer function generates the report file in this folder:
codegen/target/fcnname/html
where target is:
mexfor CUDA MEXlibfor CUDA librariesdllfor CUDA dynamic libraries
fcnname is the name of the MATLAB entry-point function. Each time you call gpuPerformanceAnalyzer, it replaces existing files in the file location. If you want to preserve files from a previous build, before starting another build, copy them to a different location.
Limitations
- On the Functions and Loops rows, you can navigate between caller and callee functions and loops using the up and down arrows on the right side of the event bar. For short events, it may not be possible to navigate back to the calling function or loop by using the up and down arrows. In such cases, use the call tree to navigate to the functions or loops.
- GPU Performance Analyzer displays the row header even if the row does not contain an event.
- At low zoom levels, GPU Performance Analyzer represents a densely populated area of short events separated by short distances as a single event. At higher levels of zoom, GPU Performance Analyzer displays the individual events. However, if the event duration is extremely short, it may not be possible to render this event on the timeline plot, even at high zoom levels.
- GPU Performance Analyzer uses a single row to represent all the GPU events. In case of multiple CUDA streams, the GPU Activities row may contain overlapping events and the calculation in the Profiling Summary panel may be inaccurate. For example, deep learning libraries such as cuDNN may use multiple CUDA streams.