addpoints - Add points to animated line - MATLAB (original) (raw)
Add points to animated line
Syntax
Description
addpoints([an](#bufcs6p-h),[x](#bufcs6p-x),[y](#bufcs6p-y)) adds points defined by x and y to the animated line specified by an. Create an animated line with the animatedline function. To display the updates on the screen, use drawnow or drawnow limitrate. New points automatically connect to previous points.
addpoints([an](#bufcs6p-h),[x](#bufcs6p-x),[y](#bufcs6p-y),[z](#bufcs6p-z)) adds points defined by x, y, andz to the 3-D animated line specified byan.
Examples
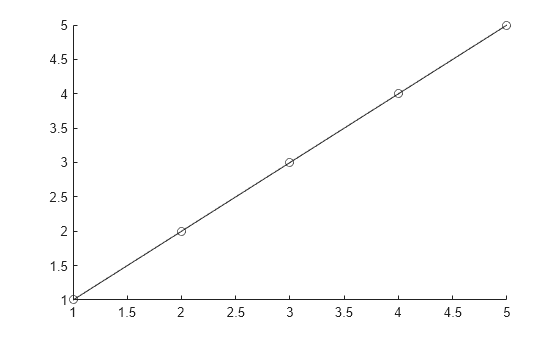
Create an animated line object with no data. Then, add five points to the line. Use a circle to mark each point.
h = animatedline('Marker','o'); x = 1:5; y = 1:5; addpoints(h,x,y)
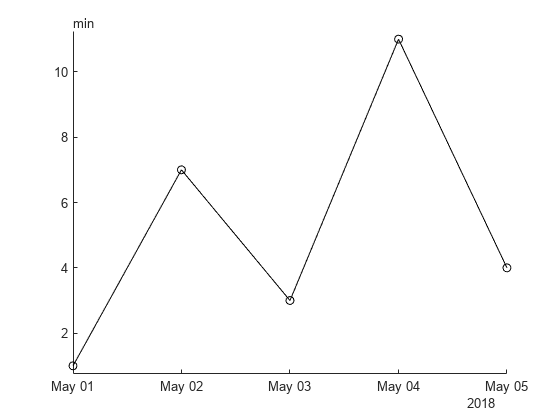
To plot nonnumeric points, such as datetime and duration values, start by initializing the animated line with values of the type you want to plot. You can specify either the first point in your plot or placeholder values such as NaT or NaN.
For example, plot datetime values on the _x_-axis and duration values (minutes) on the _y_-axis. Initialize the animated line with a NaT value and a minutes(NaN) value. Then create a datetime vector (x) and a duration vector (y) and add the points in those vectors to the animated line.
an = animatedline(NaT,minutes(NaN),"Marker","o"); x = datetime(2018,5,1:5); y = minutes([1 7 3 11 4]); addpoints(an,x,y)
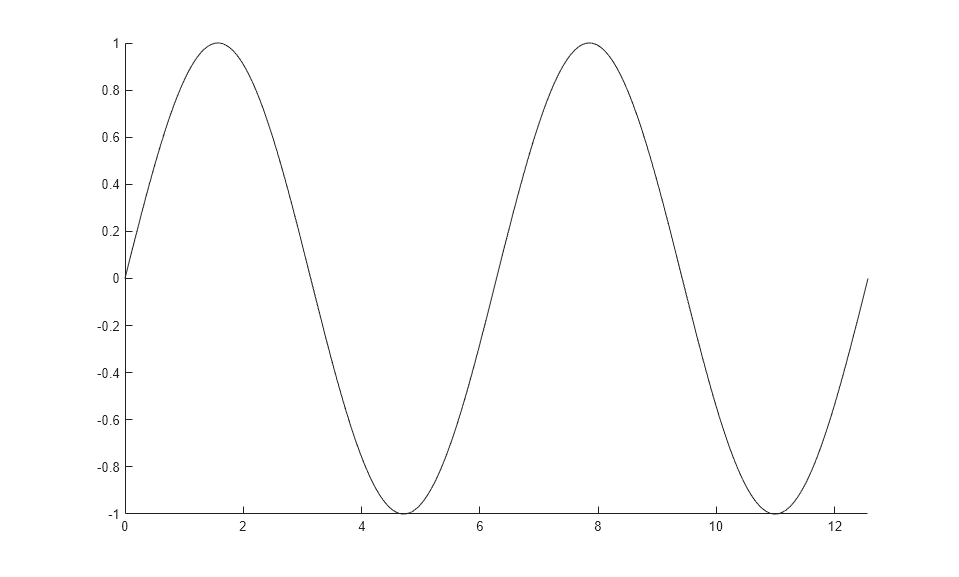
Create an animated line using the animatedline function. Then, add points to the line within a loop to create an animation. Set the axis limits before the loop to prevent the limits from changing.
figure h = animatedline; axis([0 4*pi -1 1])
for x = linspace(0,4*pi,10000) y = sin(x); addpoints(h,x,y) drawnow limitrate end
Input Arguments
AnimatedLine object. Create an AnimatedLine object using the animatedline function.
First coordinate values, specified as a scalar or a vector. For Cartesian axes, the first coordinate is _x_-axis position. For geographic axes, the first coordinate is latitude in degrees.
The length of x must equal the length ofy.
Example: 11:20
Data Types: single | double | int8 | int16 | int32 | int64 | uint8 | uint16 | uint32 | uint64 | datetime | duration
Second coordinate values, specified as a scalar or a vector. For Cartesian axes, the second coordinate is _y_-axis position. For geographic axes, the second coordinate is longitude in degrees.
The length of y must equal the length ofx.
Example: 11:20
Data Types: single | double | int8 | int16 | int32 | int64 | uint8 | uint16 | uint32 | uint64 | datetime | duration
Third coordinate values, specified as a scalar or a vector. For Cartesian axes, the third coordinate is _z_-axis position.
The length of z must equal the length ofx and y.
Example: 11:20
Data Types: single | double | int8 | int16 | int32 | int64 | uint8 | uint16 | uint32 | uint64 | datetime | duration
Extended Capabilities
The addpoints function supports GPU array input with these usage notes and limitations:
- This function accepts GPU arrays, but does not run on a GPU.
For more information, see Run MATLAB Functions on a GPU (Parallel Computing Toolbox).
Version History
Introduced in R2014b
Add points to animated lines using single, double, integer, datetime, or duration data for the _x_-, _y_-, and_z_-coordinates.