Compute by Group - Summarize, transform, or filter by group in the Live Editor - MATLAB (original) (raw)
Summarize, transform, or filter by group in the Live Editor
Since R2021b
Description
The Compute by Group task lets you interactively group data and compute summary statistics, perform transformations, or apply filters for each group. The task automatically generates MATLAB® code for your live script.
Using this task, you can:
- Define groups of data in an array, table, or timetable.
- Summarize, transform, or filter the data based on each grouping.
- Output a new table or timetable with the results of the computation.
Open the Task
To add the Compute by Group task to a live script in the MATLAB Editor:
- On the Live Editor tab, select > .
- In a code block in the script, type a relevant keyword, such as
group. SelectCompute by Groupfrom the suggested command completions.
Examples
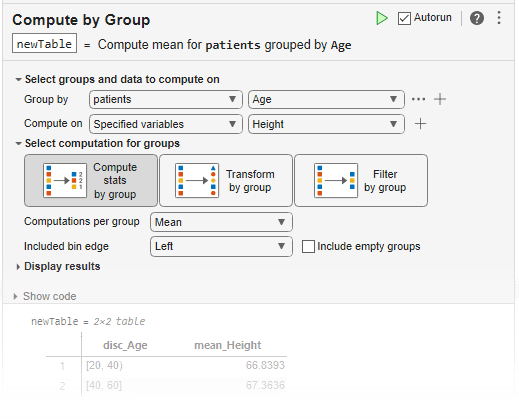
Summarize data by interactively grouping the data, specifying variables to operate on, and computing statistics using the Compute by Group task in the Live Editor.
Create a timetable using the sample file outages.csv. The file contains six columns of data representing electric utility outages. Convert the Region and Cause column-oriented variables to categorical arrays and display the timetable.
outages = readtimetable("outages.csv"); outages.Region = categorical(outages.Region); outages.Cause = categorical(outages.Cause)
outages=1468×5 timetable
OutageTime Region Loss Customers RestorationTime Cause
________________ _________ ______ __________ ________________ _______________
2002-02-01 12:18 SouthWest 458.98 1.8202e+06 2002-02-07 16:50 winter storm
2003-01-23 00:49 SouthEast 530.14 2.1204e+05 NaT winter storm
2003-02-07 21:15 SouthEast 289.4 1.4294e+05 2003-02-17 08:14 winter storm
2004-04-06 05:44 West 434.81 3.4037e+05 2004-04-06 06:10 equipment fault
2002-03-16 06:18 MidWest 186.44 2.1275e+05 2002-03-18 23:23 severe storm
2003-06-18 02:49 West 0 0 2003-06-18 10:54 attack
2004-06-20 14:39 West 231.29 NaN 2004-06-20 19:16 equipment fault
2002-06-06 19:28 West 311.86 NaN 2002-06-07 00:51 equipment fault
2003-07-16 16:23 NorthEast 239.93 49434 2003-07-17 01:12 fire
2004-09-27 11:09 MidWest 286.72 66104 2004-09-27 16:37 equipment fault
2004-09-05 17:48 SouthEast 73.387 36073 2004-09-05 20:46 equipment fault
2004-05-21 21:45 West 159.99 NaN 2004-05-22 04:23 equipment fault
2002-09-01 18:22 SouthEast 95.917 36759 2002-09-01 19:12 severe storm
2003-09-27 07:32 SouthEast NaN 3.5517e+05 2003-10-04 07:02 severe storm
2003-11-12 06:12 West 254.09 9.2429e+05 2003-11-17 02:04 winter storm
2004-09-18 05:54 NorthEast 0 0 NaT equipment fault
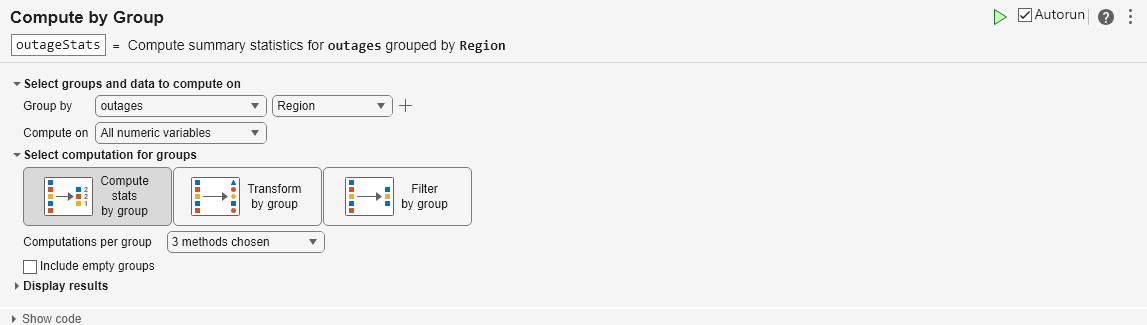
⋮Open the Compute by Group task in the Live Editor. To group the data by the five regions where the outages occurred, select outages as the input data and group by unique values of the Region variable. Then, compute on the Loss and Customers variables by selecting All numeric variables in the Compute on field.
The Compute by Group task can perform three different types of computations for groups. To summarize the outage data, set the computation type to Compute stats by group. Then, to compute the mean and maximum values for the numeric variables Loss and Customers, use the Computations per group field to select the Mean and Maximum methods.
The resulting timetable contains the group observation count, mean power loss, maximum power loss, mean number of affected customers, and maximum number of affected customers for the outages in each region.
outageStats=5×6 table Region GroupCount mean_Loss max_Loss mean_Customers max_Customers _________ __________ _________ ________ ______________ _____________
MidWest         142         1137.7        23141       2.4015e+05        3.972e+06
NorthEast       557         551.65        23418       1.4917e+05       5.9689e+06
SouthEast       389         495.35       8767.3       1.6776e+05       2.2249e+06
SouthWest        26         493.88         2796       2.6975e+05       1.8202e+06
West            354         433.37        16659       1.5201e+05         4.26e+06
Improve the interpretability or appearance of data by interactively grouping data, specifying variables to operate on, and applying a transformation operation using the Compute by Group task in the Live Editor.
Create a timetable using the sample file outages.csv. The file contains six columns of data representing electric utility outages. Convert the Region and Cause column-oriented variables to categorical arrays and display the timetable.
outages = readtimetable("outages.csv"); outages.Region = categorical(outages.Region); outages.Cause = categorical(outages.Cause)
outages=1468×5 timetable
OutageTime Region Loss Customers RestorationTime Cause
________________ _________ ______ __________ ________________ _______________
2002-02-01 12:18    SouthWest    458.98    1.8202e+06    2002-02-07 16:50    winter storm
2003-01-23 00:49    SouthEast    530.14    2.1204e+05                 NaT    winter storm
2003-02-07 21:15    SouthEast     289.4    1.4294e+05    2003-02-17 08:14    winter storm
2004-04-06 05:44    West         434.81    3.4037e+05    2004-04-06 06:10    equipment fault
2002-03-16 06:18    MidWest      186.44    2.1275e+05    2002-03-18 23:23    severe storm
2003-06-18 02:49    West              0             0    2003-06-18 10:54    attack
2004-06-20 14:39    West         231.29           NaN    2004-06-20 19:16    equipment fault
2002-06-06 19:28    West         311.86           NaN    2002-06-07 00:51    equipment fault
2003-07-16 16:23    NorthEast    239.93         49434    2003-07-17 01:12    fire
2004-09-27 11:09    MidWest      286.72         66104    2004-09-27 16:37    equipment fault
2004-09-05 17:48    SouthEast    73.387         36073    2004-09-05 20:46    equipment fault
2004-05-21 21:45    West         159.99           NaN    2004-05-22 04:23    equipment fault
2002-09-01 18:22    SouthEast    95.917         36759    2002-09-01 19:12    severe storm
2003-09-27 07:32    SouthEast       NaN    3.5517e+05    2003-10-04 07:02    severe storm
2003-11-12 06:12    West         254.09    9.2429e+05    2003-11-17 02:04    winter storm
2004-09-18 05:54    NorthEast         0             0                 NaT    equipment fault
  ⋮
Open the Compute by Group task in the Live Editor. To group the data by the ten causes by which the outages occurred, select outages as the input data and group by unique values of the Cause variable. Then, set Compute on as the Loss variable.
The Compute by Group task can perform three different types of computations for groups. To transform the outage data, set the computation type to Transform by group. Then, to fill missing power loss values, set Computation per group as the Fill missing with group mean method.
The resulting timetable contains the outage data with missing power loss replaced with the mean power loss for outages with the same cause.

outageTransform=1468×5 timetable
OutageTime Region Loss Customers RestorationTime Cause
________________ _________ ______ __________ ________________ _______________
2002-02-01 12:18    SouthWest    458.98    1.8202e+06    2002-02-07 16:50    winter storm
2003-01-23 00:49    SouthEast    530.14    2.1204e+05                 NaT    winter storm
2003-02-07 21:15    SouthEast     289.4    1.4294e+05    2003-02-17 08:14    winter storm
2004-04-06 05:44    West         434.81    3.4037e+05    2004-04-06 06:10    equipment fault
2002-03-16 06:18    MidWest      186.44    2.1275e+05    2002-03-18 23:23    severe storm
2003-06-18 02:49    West              0             0    2003-06-18 10:54    attack
2004-06-20 14:39    West         231.29           NaN    2004-06-20 19:16    equipment fault
2002-06-06 19:28    West         311.86           NaN    2002-06-07 00:51    equipment fault
2003-07-16 16:23    NorthEast    239.93         49434    2003-07-17 01:12    fire
2004-09-27 11:09    MidWest      286.72         66104    2004-09-27 16:37    equipment fault
2004-09-05 17:48    SouthEast    73.387         36073    2004-09-05 20:46    equipment fault
2004-05-21 21:45    West         159.99           NaN    2004-05-22 04:23    equipment fault
2002-09-01 18:22    SouthEast    95.917         36759    2002-09-01 19:12    severe storm
2003-09-27 07:32    SouthEast    697.41    3.5517e+05    2003-10-04 07:02    severe storm
2003-11-12 06:12    West         254.09    9.2429e+05    2003-11-17 02:04    winter storm
2004-09-18 05:54    NorthEast         0             0                 NaT    equipment fault
  ⋮
Focus on specific information in a data set by interactively grouping data, specifying variables to operate on, and applying a group filter with Compute by Group.
Create a timetable using the sample file outages.csv. The file contains six columns of data representing electric utility outages. Convert the Region and Cause column-oriented variables to categorical arrays and display the timetable.
outages = readtimetable("outages.csv"); outages.Region = categorical(outages.Region); outages.Cause = categorical(outages.Cause)
outages=1468×5 timetable
OutageTime Region Loss Customers RestorationTime Cause
________________ _________ ______ __________ ________________ _______________
2002-02-01 12:18 SouthWest 458.98 1.8202e+06 2002-02-07 16:50 winter storm
2003-01-23 00:49 SouthEast 530.14 2.1204e+05 NaT winter storm
2003-02-07 21:15 SouthEast 289.4 1.4294e+05 2003-02-17 08:14 winter storm
2004-04-06 05:44 West 434.81 3.4037e+05 2004-04-06 06:10 equipment fault
2002-03-16 06:18 MidWest 186.44 2.1275e+05 2002-03-18 23:23 severe storm
2003-06-18 02:49 West 0 0 2003-06-18 10:54 attack
2004-06-20 14:39 West 231.29 NaN 2004-06-20 19:16 equipment fault
2002-06-06 19:28 West 311.86 NaN 2002-06-07 00:51 equipment fault
2003-07-16 16:23 NorthEast 239.93 49434 2003-07-17 01:12 fire
2004-09-27 11:09 MidWest 286.72 66104 2004-09-27 16:37 equipment fault
2004-09-05 17:48 SouthEast 73.387 36073 2004-09-05 20:46 equipment fault
2004-05-21 21:45 West 159.99 NaN 2004-05-22 04:23 equipment fault
2002-09-01 18:22 SouthEast 95.917 36759 2002-09-01 19:12 severe storm
2003-09-27 07:32 SouthEast NaN 3.5517e+05 2003-10-04 07:02 severe storm
2003-11-12 06:12 West 254.09 9.2429e+05 2003-11-17 02:04 winter storm
2004-09-18 05:54 NorthEast 0 0 NaT equipment fault
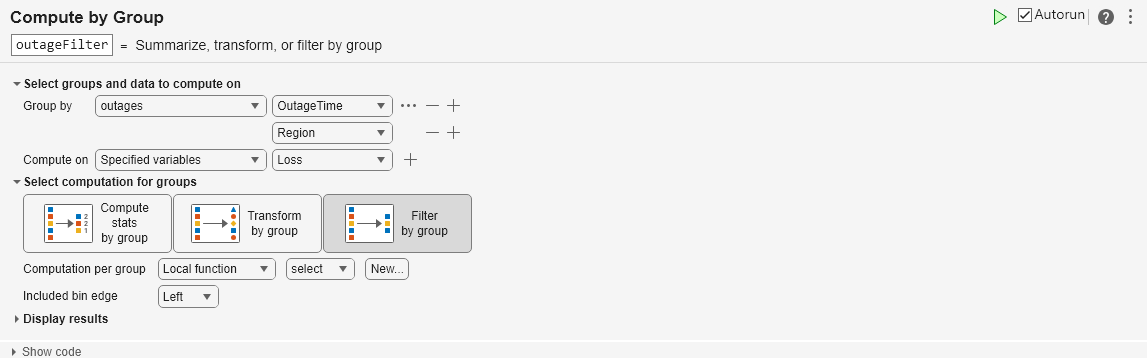
⋮Open the Compute by Group task in the Live Editor. To group the data by the year and region in which the outages occurred, use Group by to bin the OutageTime variable by year and group the Region variable by unique values. Then, compute on the power loss by selecting the Loss variable in the Compute on field.
The Compute by Group task can perform three different types of computations for groups. To filter the outage data, set the computation type to Filter by group. Then, set Computation per group as a new local function and customize the filter by writing a function which gives a true result for the outlier data to keep and a false result for non-outlier data to be filtered out.
The resulting timetable contains only outlier outage data, where the power loss is outside of three standard deviations from the mean of the losses for the year and region.
outageFilter=159×6 timetable OutageTime Region Loss Customers RestorationTime Cause year_OutageTime ________________ _________ ______ __________ ________________ _______________ _______________
2004-04-06 05:44    West         434.81    3.4037e+05    2004-04-06 06:10    equipment fault         2004
2002-06-06 19:28    West         311.86           NaN    2002-06-07 00:51    equipment fault         2002
2005-03-08 16:37    SouthEast    1339.2    4.3003e+05    2005-03-10 20:42    winter storm            2005
2004-07-02 09:16    MidWest       15128    2.0104e+05    2004-07-06 14:11    thunder storm           2004
2002-04-20 16:46    MidWest       23141           NaN                 NaT    unknown                 2002
2002-12-10 10:45    MidWest       14493    3.0879e+06    2002-12-11 18:06    unknown                 2002
2002-05-18 11:04    MidWest      1389.1    1.3447e+05    2002-05-21 01:22    unknown                 2002
2003-09-22 00:53    MidWest      3995.8    6.7808e+05    2003-09-23 03:45    unknown                 2003
2005-11-05 12:46    NorthEast    2966.1           NaN    2005-11-06 21:40    unknown                 2005
2002-08-17 09:05    NorthEast     21673           NaN    2002-08-19 21:45    unknown                 2002
2004-09-16 19:42    NorthEast      4718           NaN                 NaT    unknown                 2004
2002-05-20 10:57    NorthEast    9116.6    2.4983e+06    2002-05-21 15:22    unknown                 2002
2003-09-05 20:15    SouthEast    1700.1    1.6393e+05    2003-09-10 19:59    thunder storm           2003
2004-09-20 12:37    SouthEast    8767.3    2.2249e+06    2004-10-02 06:00    severe storm            2004
2005-09-14 15:45    SouthEast    1839.2    3.4144e+05                 NaT    severe storm            2005
2003-09-14 16:09    NorthEast    2011.3    6.9368e+05    2003-09-24 07:44    severe storm            2003
  ⋮
function tf = myFilterFcn(x) % x is the data in a group from one computation variable % tf is true, false, or a logical column vector with the same height as x tf = isoutlier(x); end
Related Examples
- Add Interactive Tasks to a Live Script
- Summarize or Pivot Data in Tables Using Groups
- Clean Messy Data and Locate Extrema Using Live Editor Tasks
Parameters
Specify groups by selecting valid workspace grouping variables from theGroup by drop-down list. When the data is contained in a table or timetable, additionally select the table variables to group by. You can group by unique values or specify how to bin the data.
From the Compute on drop-down list, select the workspace data to compute on. When the data is contained in a table or timetable, select the table variables to compute on.
Select one of these computation options:
| Computation Type | Description |
|---|---|
| Compute stats by group | A summary (or aggregate) of data, such as a mean or maximum. You can also supply a custom function by providing a local function name or a function handle. The function must return one entity per group whose first dimension has length 1. For more information, see groupsummary. |
| Transform by group | Transform the data, for example, scale the data by the 2-norm or fill missing data. You can also supply a custom function by providing a local function name or a function handle. The function must return one entity whose first dimension has length 1 or has the same number of rows as the input data. For more information, see grouptransform. |
| Filter by group | Filter members from each group by providing a local function or function handle that defines the filtering computation. The function must return a logical scalar or a logical column vector with the same number of rows as the data indicating which group members to select. If the function returns a logical scalar, then either all members of the group are filtered (when the value is false) or none are (when the value istrue). If the function returns a logical vector, then members of groups are filtered when the corresponding element isfalse. Members are kept when the corresponding element istrue. For more information, see groupfilter. |
For all computation types, you can click New to create a new function in the Live Script that defines the computation. ClickingNew automatically inserts an example function into the Live Script that uses the appropriate syntax for the selected computation type. If you change the name of the example function, to use the new function name, reselect the method from the drop-down list in the live task.
Version History
Introduced in R2021b
Compute the number of distinct nonmissing elements in each group of data. SelectCompute stats by group, and then specify the or computation method.
This Live Editor task does not run automatically if the inputs have more than 1 million rows. In previous releases, the task always ran automatically for inputs of any size. If the inputs have a large number of rows, then the code generated by this task can take a noticeable amount of time to run (more than a few seconds).
When a task does not run automatically, the Autorun indicator is disabled. You can either run the task manually when needed or choose to enable the task to run automatically.