mesh - Mesh surface plot - MATLAB (original) (raw)

Syntax
Description
mesh([X](#mw%5Fc9089399-37d6-4ce1-bd8e-3ac4f619e0b3),[Y](#mw%5F628157f3-09c5-409e-ba42-56e5fc4a2d8f),[Z](#mw%5F4fb02eee-3c68-4a1f-a6c1-0058dfde3626)) creates a mesh plot, which is a three-dimensional surface that has solid edge colors and no face colors. The function plots the values in matrixZ as heights above a grid in the_x_-y plane defined byX and Y. The edge colors vary according to the heights specified by Z.
mesh([Z](#mw%5F4fb02eee-3c68-4a1f-a6c1-0058dfde3626)) creates a mesh plot and uses the column and row indices of the elements in Z as the_x_- and _y_-coordinates.
mesh([Z](#mw%5F4fb02eee-3c68-4a1f-a6c1-0058dfde3626),[C](#mw%5F21620dd2-fd0e-42e6-8c3a-aa1d4cba88c6)) additionally specifies the color of the edges.
mesh(___,[C](#mw%5F21620dd2-fd0e-42e6-8c3a-aa1d4cba88c6)) additionally specifies the color of the edges.
mesh([ax](#bquiipx-18%5Fsep%5Fmw%5F4edf80de-1d31-452b-bde6-1d90f125b88d),___) plots into the axes specified by ax instead of the current axes. Specify the axes as the first input argument.
mesh(___,[Name,Value](#namevaluepairarguments)) specifies surface properties using one or more name-value pair arguments. For example, 'FaceAlpha',0.5 creates a semitransparent mesh plot.
s = mesh(___) returns the chart surface object. Use s to modify the mesh plot after it is created. For a list of properties, see Surface Properties.
Examples
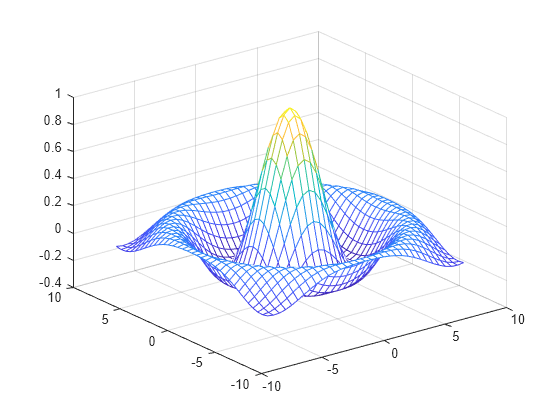
Create three matrices of the same size. Then plot them as a mesh plot. The plot uses Z for both height and color.
[X,Y] = meshgrid(-8:.5:8); R = sqrt(X.^2 + Y.^2) + eps; Z = sin(R)./R; mesh(X,Y,Z)
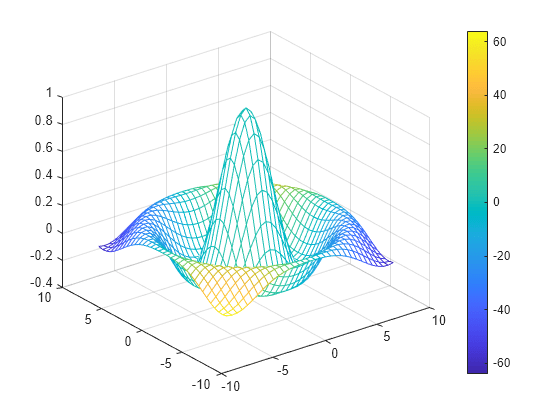
Specify the colors for a mesh plot by including a fourth matrix input, C. The mesh plot uses Z for height and C for color. Specify the colors using a colormap, which uses single numbers to stand for colors on a spectrum. When you use a colormap, C is the same size as Z. Add a color bar to the graph to show how the data values in C correspond to the colors in the colormap.
[X,Y] = meshgrid(-8:.5:8); R = sqrt(X.^2 + Y.^2) + eps; Z = sin(R)./R; C = X.*Y; mesh(X,Y,Z,C) colorbar
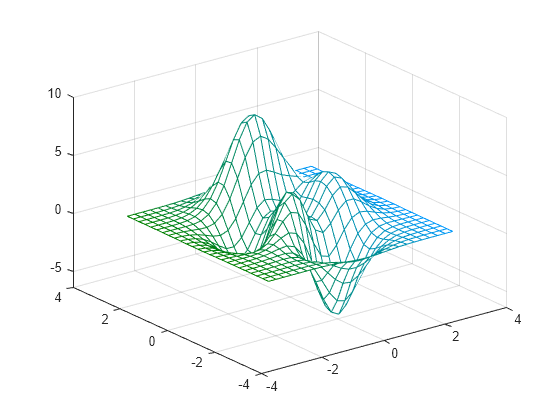
Specify the colors for a mesh plot by including a fourth matrix input, CO. The mesh plot uses Z for height and CO for color. Specify the colors using truecolor, which uses triplets of numbers to stand for all possible colors. When you use truecolor, if Z is m-by-n, then CO is m-by-n-by-3. The first page of the array indicates the red component for each color, the second page indicates the green component, and the third page indicates the blue component.
[X,Y,Z] = peaks(25); CO(:,:,1) = zeros(25); % red CO(:,:,2) = ones(25).*linspace(0.5,0.6,25); % green CO(:,:,3) = ones(25).*linspace(0,1,25); % blue mesh(X,Y,Z,CO)
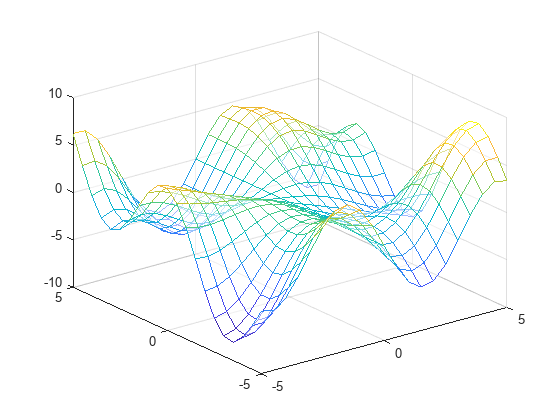
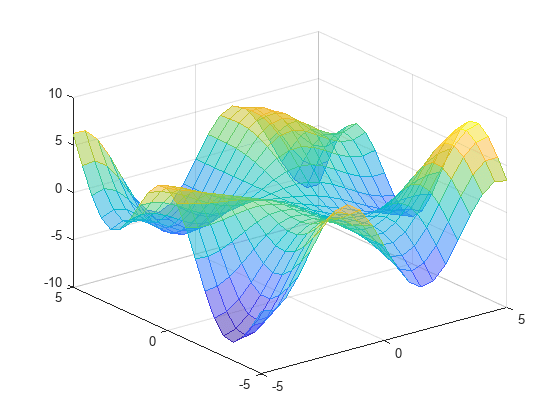
Create a semitransparent mesh surface by specifying the FaceAlpha name-value pair with 0.5 as the value. To allow further modifications, assign the surface object to the variable s.
[X,Y] = meshgrid(-5:.5:5); Z = Y.*sin(X) - X.*cos(Y); s = mesh(X,Y,Z,'FaceAlpha','0.5')
s = Surface with properties:
   EdgeColor: 'flat'
   LineStyle: '-'
   FaceColor: [1 1 1]
FaceLighting: 'none'
   FaceAlpha: 0.5000
       XData: [21×21 double]
       YData: [21×21 double]
       ZData: [21×21 double]
       CData: [21×21 double]
Show all properties
Use s to access and modify properties of the mesh plot after it is created. For example, add color to the face of the mesh plot by setting the FaceColor property.
Input Arguments
_x_-coordinates, specified as a matrix the same size asZ, or as a vector with length n, where [m,n] = size(Z). If you do not specify values forX and Y, mesh uses the vectors (1:n) and(1:m).
You can use the meshgrid function to createX and Y matrices.
The XData property of the surface object stores the_x_-coordinates.
Example: X = 1:10
Example: X = [1 2 3; 1 2 3; 1 2 3]
Example: [X,Y] = meshgrid(-5:0.5:5)
Data Types: single | double | int8 | int16 | int32 | int64 | uint8 | uint16 | uint32 | uint64 | categorical | datetime | duration
_y_-coordinates, specified as a matrix the same size asZ or as a vector with length m, where [m,n] = size(Z). If you do not specify values forX and Y, mesh uses the vectors (1:n) and(1:m).
You can use the meshgrid function to create the X and Y matrices.
The YData property of the surface object stores the_y_-coordinates.
Example: Y = 1:10
Example: Y = [1 1 1; 2 2 2; 3 3 3]
Example: [X,Y] = meshgrid(-5:0.5:5)
Data Types: single | double | int8 | int16 | int32 | int64 | uint8 | uint16 | uint32 | uint64 | categorical | datetime | duration
_z_-coordinates, specified as a matrix.Z must have at least two rows and two columns.
Z specifies the height of the mesh plot at each_x_-y coordinate. If you do not specify the colors, then Z also specifies the mesh edge colors.
The ZData property of the surface object stores the_z_-coordinates.
Example: Z = [1 2 3; 4 5 6]
Example: Z = sin(x) + cos(y)
Data Types: single | double | int8 | int16 | int32 | int64 | uint8 | uint16 | uint32 | uint64 | categorical | datetime | duration
Color array, specified as an m-by-n matrix of colormap indices or as anm-by-n-by-3 array of RGB triplets, where Z ism-by-n.
- To use colormap colors, specify
Cas a matrix. For each grid point on the mesh surface,Cindicates a color in the colormap. TheCDataMappingproperty of the surface object controls how the values inCcorrespond to colors in the colormap. - To use truecolor colors, specify
Cas an array of RGB triplets.
For more information, see Differences Between Colormaps and Truecolor.
The CData property of the surface object stores the color array. For additional control over the surface coloring, use theFaceColor and EdgeColor properties.
Axes to plot into, specified as an Axes or PolarAxes object. If you do not specify the axes, then mesh plots into the current axes or creates an Axes object (Cartesian axes).
Name-Value Arguments
Specify optional pairs of arguments asName1=Value1,...,NameN=ValueN, where Name is the argument name and Value is the corresponding value. Name-value arguments must appear after other arguments, but the order of the pairs does not matter.
Before R2021a, use commas to separate each name and value, and enclose Name in quotes.
Example: mesh(X,Y,Z,'FaceAlpha',0.5) creates a semitransparent mesh plot.
Note
The properties listed here are only a subset. For a full list, see Surface Properties.
Tips
- To remove hidden lines from the plot, use the hidden function.
- To control the color shading of the plot surfaces, use the shading function.
- To create a three-dimensional surface with face colors, use the surf function.
Extended Capabilities
The mesh function supports GPU array input with these usage notes and limitations:
- This function accepts GPU arrays, but does not run on a GPU.
For more information, see Run MATLAB Functions on a GPU (Parallel Computing Toolbox).
Version History
Introduced before R2006a
Create mesh plots in polar coordinates by specifying aPolarAxes object as the first argument.