plotLocalEffects - Plot local effects of terms in generalized additive model (GAM) - MATLAB (original) (raw)
Plot local effects of terms in generalized additive model (GAM)
Since R2021a
Syntax
Description
plotLocalEffects([Mdl](#mw%5F0a650751-8fea-42e0-8078-d8b5ab06b5bd),[queryPoint](#mw%5F522055e7-c2b5-4358-a87d-eb4c12e5e492)) creates a bar graph showing the local effects of the terms in the generalized additive modelMdl on the prediction at the specified query pointqueryPoint.
plotLocalEffects([Mdl](#mw%5F0a650751-8fea-42e0-8078-d8b5ab06b5bd),[queryPoint](#mw%5F522055e7-c2b5-4358-a87d-eb4c12e5e492),[Name,Value](#namevaluepairarguments)) specifies additional options using one or more name-value arguments. For example,'IncludeIntercept',true specifies to include an intercept term in the bar graph.
plotLocalEffects([ax](#mw%5F551f23db-afe8-4b0e-b3fd-9261da84a040),___) plots into the axes specified by ax instead of the current axes (gca) using any of the input argument combinations in the previous syntaxes. (since R2024a)
`b` = plotLocalEffects(___) returns a bar graph object b. Use b to query or modifyBar Properties of the bar graph after you create it.
Examples
Train a univariate generalized additive classification model, which contains linear terms for predictors. Classify a new observation using a memory-efficient model object. Then, interpret the prediction for a specified data instance by using the plotLocalEffects function.
Load the ionosphere data set. This data set has 34 predictors and 351 binary responses for radar returns, either bad ('b') or good ('g').
Train a univariate GAM that identifies whether the radar return is bad ('b') or good ('g').
Mdl is a ClassificationGAM model object.
Conserve memory by reducing the size of the trained model.
Classify the first observation of the training data, and plot the local effects of the terms in Mdl on the prediction.
label = predict(CMdl,X(1,:))
label = 1×1 cell array {'g'}
plotLocalEffects(CMdl,X(1,:))

The predict function classifies the first observation X(1,:) as 'g'. The plotLocalEffects function creates a horizontal bar graph that shows the local effects of the 10 most important terms on the prediction. Each local effect value shows the contribution of each term to the classification score for 'g', which is the logit of the posterior probability that the classification is 'g' for the observation.
Train a GAM for binary classification with both linear and interaction terms for predictors. Create local effects plot using both linear and interaction terms in the model, and then create a plot using only linear terms in the model. Specify whether to include interaction terms when creating the local effects plot.
Load the ionosphere data set. This data set has 34 predictors and 351 binary responses for radar returns, either bad ('b') or good ('g').
Train a GAM using the predictors X and class labels Y. A recommended practice is to specify the class names. Specify to include the 10 most important interaction terms.
Mdl = fitcgam(X,Y,'ClassNames',{'b','g'},'Interactions',10);
Mdl is a ClassificationGAM model object.
Create local effects plots for the 10th observation. Use both the linear and interaction terms in Mdl for the first plot, and use only the linear terms in Mdl for the second plot. To exclude interaction terms, specify 'IncludeInteractions',false.
t = tiledlayout(2,1); title(t,'Local Effects Plots for 10th Observation') nexttile plotLocalEffects(Mdl,X(10,:)) title('GAM with linear and interaction terms') nexttile plotLocalEffects(Mdl,X(10,:),'IncludeInteractions',false) title('GAM with only linear terms')
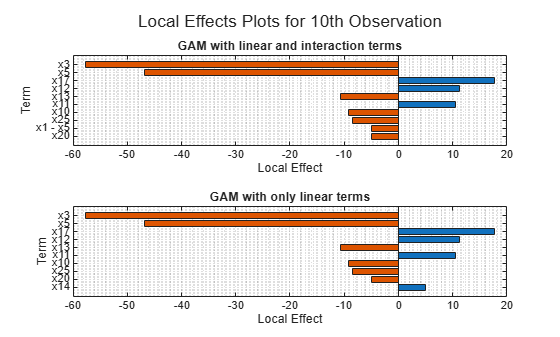
The plots display the 10 most important terms. Both plots include nine common terms and one uncommon term. The first plot includes the interaction term for x1 and x5, whereas the second plot includes the linear term for x14.
Train a univariate GAM for regression, which contains linear terms for predictors. Then, interpret the prediction for a specified data instance by using the plotLocalEffects function.
Load the data set NYCHousing2015.
The data set includes 10 variables with information on the sales of properties in New York City in 2015. This example uses these variables to analyze the sale prices (SALEPRICE).
Preprocess the data set. Remove outliers, convert the datetime array (SALEDATE) to the month numbers, and move the response variable (SALEPRICE) to the last column.
idx = isoutlier(NYCHousing2015.SALEPRICE); NYCHousing2015(idx,:) = []; NYCHousing2015.SALEDATE = month(NYCHousing2015.SALEDATE); NYCHousing2015 = movevars(NYCHousing2015,'SALEPRICE','After','SALEDATE');
Display the first three rows of the table.
BOROUGH    NEIGHBORHOOD       BUILDINGCLASSCATEGORY        RESIDENTIALUNITS    COMMERCIALUNITS    LANDSQUAREFEET    GROSSSQUAREFEET    YEARBUILT    SALEDATE    SALEPRICE
_______    ____________    ____________________________    ________________    _______________    ______________    _______________    _________    ________    _________

   2       {'BATHGATE'}    {'01  ONE FAMILY DWELLINGS'}           1                   0                4750              2619            1899           8           0
   2       {'BATHGATE'}    {'01  ONE FAMILY DWELLINGS'}           1                   0                4750              2619            1899           8           0
   2       {'BATHGATE'}    {'01  ONE FAMILY DWELLINGS'}           1                   1                1287              2528            1899          12           0
Train a univariate GAM for the sale prices. Specify the variables for BOROUGH, NEIGHBORHOOD, BUILDINGCLASSCATEGORY, and SALEDATE as categorical predictors.
Mdl = fitrgam(NYCHousing2015,'SALEPRICE','CategoricalPredictors',[1 2 3 9]);
Mdl is a RegressionGAM model object.
Display the estimated intercept (constant) term of Mdl.
The intercept term value is close to the average of the response variable in a regression GAM if the training data does not include NaN values. Compute average of the response variable.
mean(NYCHousing2015.SALEPRICE)
Predict the sale price for the first observation of the training data, and plot the local effects of the terms in Mdl on the prediction. Specify 'IncludeIntercept',true to include the intercept term in the plot.
yFit = predict(Mdl,NYCHousing2015(1,:))
plotLocalEffects(Mdl,NYCHousing2015(1,:),'IncludeIntercept',true)

The predict function predicts the sale price for the first observation as 4.4421e5. The plotLocalEffects function creates a horizontal bar graph that shows the local effects of the terms in Mdl on the prediction. Each local effect value shows the contribution of each term to the predicted sale price.
Input Arguments
Query point at which plotLocalEffects plots the local effects, specified as a row vector of numeric values or a single-row table.
- For a row vector of numeric values:
- The variables that makes up the columns of
queryPointmust have the same order as the predictor variables that trainedMdl. - If you trained
Mdlusing a table (for example,Tbl), thenqueryPointcan be a numeric matrix ifTblcontains all numeric variables.
- The variables that makes up the columns of
- For a single-row table:
- If you trained
Mdlusing a table (for example,Tbl), then all predictor variables inqueryPointmust have the same variable names and data types as those inTbl. However, the column order ofqueryPointdoes not need to correspond to the column order ofTbl. - If you trained
Mdlusing a numeric matrix, then the predictor names inMdl.PredictorNamesand the corresponding predictor variable names inqueryPointmust be the same. To specify predictor names during training, use the'PredictorNames'name-value argument. All predictor variables inqueryPointmust be numeric vectors. queryPointcan contain additional variables (response variables, observation weights, and so on), butplotLocalEffectsignores them.plotLocalEffectsdoes not support multicolumn variables or cell arrays other than cell arrays of character vectors.
- If you trained
Data Types: single | double | table
Since R2024a
Target axes, specified as an Axes object. If you do not specify the axes, thenplotLocalEffects uses the current axes (gca).
Name-Value Arguments
Specify optional pairs of arguments asName1=Value1,...,NameN=ValueN, where Name is the argument name and Value is the corresponding value. Name-value arguments must appear after other arguments, but the order of the pairs does not matter.
Before R2021a, use commas to separate each name and value, and enclose Name in quotes.
Example: plotLocalEffects(Mdl,queryPoint,'IncludeInteractions',false,'NumTerms',5) specifies to create a bar plot containing the five most important linear terms for predictors in Mdl excluding the interaction terms inMdl.
Flag to include interaction terms of the model in the plot, specified astrue or false.
The default 'IncludeInteractions' value istrue if Mdl contains interaction terms. The value must be false if the model does not contain interaction terms.
Example: 'IncludeInteractions',false
Data Types: logical
Flag to include an intercept term of the model in the plot, specified astrue or false.
Example: 'IncludeIntercept',true
Data Types: logical
Number of terms to plot, specified as a positive integer scalar.plotLocalEffects plots the specified number of terms with the highest absolute local effect values.
Example: 'NumTerms',5 specifies to plot the five most important terms. plotLocalEffects determines the order of importance by using the absolute local effect values.
Data Types: single | double
Version History
Introduced in R2021a
Specify the target axes for the plot by using the ax input argument.