predict - Classify observations using neural network classifier - MATLAB (original) (raw)
Classify observations using neural network classifier
Since R2021a
Syntax
Description
[label](#mw%5Fab3b6c5c-723c-4f08-a1b1-f6a99b4a3e42) = predict([Mdl](#mw%5F4e32a069-59c1-4227-aee6-c0ce10967a1a%5Fsep%5Fmw%5F401b4373-f245-41e6-965a-a6ce03891d5b),[X](#mw%5Ffd558b92-5acb-431f-b251-4cba5cd5e791)) returns predicted class labels for the predictor data in the table or matrixX using the trained neural network classification modelMdl.
[label](#mw%5Fab3b6c5c-723c-4f08-a1b1-f6a99b4a3e42) = predict([Mdl](#mw%5F4e32a069-59c1-4227-aee6-c0ce10967a1a%5Fsep%5Fmw%5F401b4373-f245-41e6-965a-a6ce03891d5b),[X](#mw%5Ffd558b92-5acb-431f-b251-4cba5cd5e791),'ObservationsIn',[dimension](#mw%5F591f40cf-02e5-486d-9b1d-b2265ea3fa12)) specifies the predictor data observation dimension, either 'rows' (default) or 'columns'. For example, specify'ObservationsIn','columns' to indicate that columns in the predictor data correspond to observations.
[[label](#mw%5Fab3b6c5c-723c-4f08-a1b1-f6a99b4a3e42),[Score](#mw%5F36dce4af-30d0-443c-8afd-2b767e401385)] = predict(___) also returns a matrix of classification scores indicating the likelihood that a label comes from a particular class, using any of the input argument combinations in the previous syntaxes. For each observation inX, the predicted class label corresponds to the maximum score among all classes.
Examples
Predict labels for test set observations using a neural network classifier.
Load the patients data set. Create a table from the data set. Each row corresponds to one patient, and each column corresponds to a diagnostic variable. Use the Smoker variable as the response variable, and the rest of the variables as predictors.
load patients tbl = table(Diastolic,Systolic,Gender,Height,Weight,Age,Smoker);
Separate the data into a training set tblTrain and a test set tblTest by using a stratified holdout partition. The software reserves approximately 30% of the observations for the test data set and uses the rest of the observations for the training data set.
rng("default") % For reproducibility of the partition c = cvpartition(tbl.Smoker,"Holdout",0.30); trainingIndices = training(c); testIndices = test(c); tblTrain = tbl(trainingIndices,:); tblTest = tbl(testIndices,:);
Train a neural network classifier using the training set. Specify the Smoker column of tblTrain as the response variable. Specify to standardize the numeric predictors.
Mdl = fitcnet(tblTrain,"Smoker", ... "Standardize",true);
Classify the test set observations. Visualize the results using a confusion matrix.
label = predict(Mdl,tblTest); confusionchart(tblTest.Smoker,label)
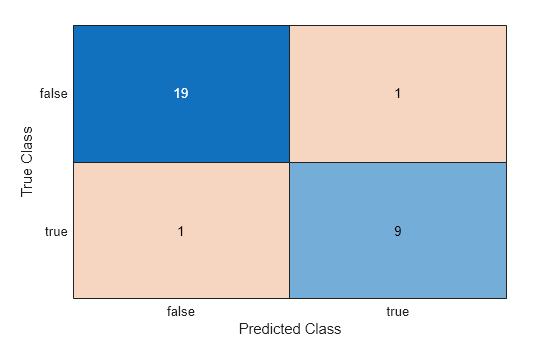
The neural network model correctly classifies all but two of the test set observations.
Perform feature selection by comparing test set classification margins, edges, errors, and predictions. Compare the test set metrics for a model trained using all the predictors to the test set metrics for a model trained using only a subset of the predictors.
Load the sample file fisheriris.csv, which contains iris data including sepal length, sepal width, petal length, petal width, and species type. Read the file into a table.
fishertable = readtable('fisheriris.csv');
Separate the data into a training set trainTbl and a test set testTbl by using a stratified holdout partition. The software reserves approximately 30% of the observations for the test data set and uses the rest of the observations for the training data set.
rng("default") c = cvpartition(fishertable.Species,"Holdout",0.3); trainTbl = fishertable(training(c),:); testTbl = fishertable(test(c),:);
Train one neural network classifier using all the predictors in the training set, and train another classifier using all the predictors except PetalWidth. For both models, specify Species as the response variable, and standardize the predictors.
allMdl = fitcnet(trainTbl,"Species","Standardize",true); subsetMdl = fitcnet(trainTbl,"Species ~ SepalLength + SepalWidth + PetalLength", ... "Standardize",true);
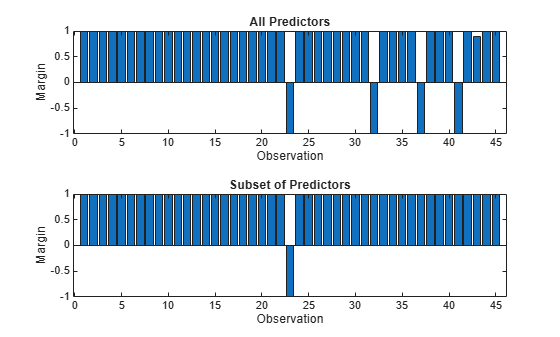
Calculate the test set classification margins for the two models. Because the test set includes only 45 observations, display the margins using bar graphs.
For each observation, the classification margin is the difference between the classification score for the true class and the maximal score for the false classes. Because neural network classifiers return classification scores that are posterior probabilities, margin values close to 1 indicate confident classifications and negative margin values indicate misclassifications.
tiledlayout(2,1)
% Top axes ax1 = nexttile; allMargins = margin(allMdl,testTbl); bar(ax1,allMargins) xlabel(ax1,"Observation") ylabel(ax1,"Margin") title(ax1,"All Predictors")
% Bottom axes ax2 = nexttile; subsetMargins = margin(subsetMdl,testTbl); bar(ax2,subsetMargins) xlabel(ax2,"Observation") ylabel(ax2,"Margin") title(ax2,"Subset of Predictors")
Compare the test set classification edge, or mean of the classification margins, of the two models.
allEdge = edge(allMdl,testTbl)
subsetEdge = edge(subsetMdl,testTbl)
Based on the test set classification margins and edges, the model trained on a subset of the predictors seems to outperform the model trained on all the predictors.
Compare the test set classification error of the two models.
allError = loss(allMdl,testTbl); allAccuracy = 1-allError
subsetError = loss(subsetMdl,testTbl); subsetAccuracy = 1-subsetError
Again, the model trained using only a subset of the predictors seems to perform better than the model trained using all the predictors.
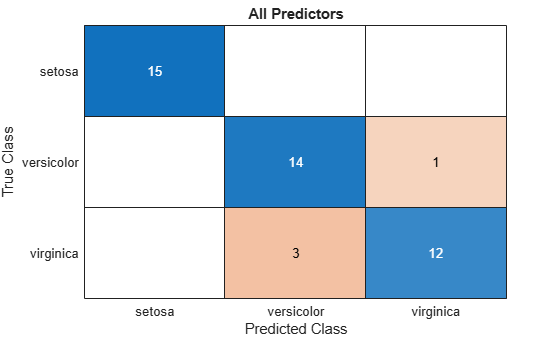
Visualize the test set classification results using confusion matrices.
allLabels = predict(allMdl,testTbl); figure confusionchart(testTbl.Species,allLabels) title("All Predictors")
subsetLabels = predict(subsetMdl,testTbl); figure confusionchart(testTbl.Species,subsetLabels) title("Subset of Predictors")
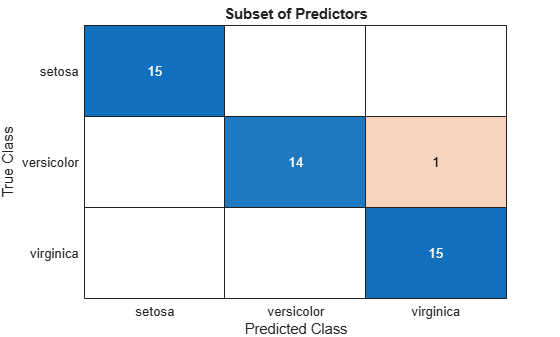
The model trained using all the predictors misclassifies four of the test set observations. The model trained using a subset of the predictors misclassifies only one of the test set observations.
Given the test set performance of the two models, consider using the model trained using all the predictors except PetalWidth.
See how the layers of a neural network classifier work together to predict the label and classification scores for a single observation.
Load the sample file fisheriris.csv, which contains iris data including sepal length, sepal width, petal length, petal width, and species type. Read the file into a table.
fishertable = readtable('fisheriris.csv');
Train a neural network classifier using the data set. Specify the Species column of fishertable as the response variable.
Mdl = fitcnet(fishertable,"Species");
Select the fifteenth observation from the data set. See how the layers of the neural network classifier take the observation and return a predicted class label newPointLabel and classification scores newPointScores.
newPoint = 1×4
5.8000 4.0000 1.2000 0.2000firstFCStep = (Mdl.LayerWeights{1})*newPoint' + Mdl.LayerBiases{1}; reluStep = max(firstFCStep,0);
finalFCStep = (Mdl.LayerWeights{end})*reluStep + Mdl.LayerBiases{end}; finalSoftmaxStep = softmax(finalFCStep);
[~,classIdx] = max(finalSoftmaxStep); newPointLabel = Mdl.ClassNames{classIdx}
newPointScores = finalSoftmaxStep'
newPointScores = 1×3
1.0000 0.0000 0.0000Check that the predictions match those returned by the predict object function.
[predictedLabel,predictedScores] = predict(Mdl,newPoint)
predictedLabel = 1×1 cell array {'setosa'}
predictedScores = 1×3
1.0000 0.0000 0.0000Input Arguments
Predictor data to be classified, specified as a numeric matrix or table.
By default, each row of X corresponds to one observation, and each column corresponds to one variable.
- For a numeric matrix:
- The variables in the columns of
Xmust have the same order as the predictor variables that trained Mdl. - If you train
Mdlusing a table (for example,Tbl) andTblcontains only numeric predictor variables, thenXcan be a numeric matrix. To treat numeric predictors inTblas categorical during training, identify categorical predictors by using the CategoricalPredictors name-value argument of fitcnet. IfTblcontains heterogeneous predictor variables (for example, numeric and categorical data types) andXis a numeric matrix, thenpredictthrows an error.
- The variables in the columns of
- For a table:
predictdoes not support multicolumn variables or cell arrays other than cell arrays of character vectors.- If you train
Mdlusing a table (for example,Tbl), then all predictor variables inXmust have the same variable names and data types as the variables that trainedMdl(stored inMdl.PredictorNames). However, the column order ofXdoes not need to correspond to the column order ofTbl. Also,TblandXcan contain additional variables (response variables, observation weights, and so on), butpredictignores them. - If you train
Mdlusing a numeric matrix, then the predictor names inMdl.PredictorNamesmust be the same as the corresponding predictor variable names inX. To specify predictor names during training, use the PredictorNames name-value argument offitcnet. All predictor variables inXmust be numeric vectors.Xcan contain additional variables (response variables, observation weights, and so on), butpredictignores them.
If you set 'Standardize',true in fitcnet when training Mdl, then the software standardizes the numeric columns of the predictor data using the corresponding means and standard deviations.
Note
If you orient your predictor matrix so that observations correspond to columns and specify 'ObservationsIn','columns', then you might experience a significant reduction in computation time. You cannot specify'ObservationsIn','columns' for predictor data in a table.
Data Types: single | double | table
Predictor data observation dimension, specified as 'rows' or'columns'.
Note
If you orient your predictor matrix so that observations correspond to columns and specify 'ObservationsIn','columns', then you might experience a significant reduction in computation time. You cannot specify'ObservationsIn','columns' for predictor data in a table.
Data Types: char | string
Output Arguments
Predicted class labels, returned as a numeric, categorical, or logical vector; a character or string array; or a cell array of character vectors. The software predicts the classification of an observation by assigning the observation to the class yielding the largest classification score or posterior probability.
label has the same data type as the observed class labels that trained Mdl, and its length is equal to the number of observations in X. (The software treats string arrays as cell arrays of character vectors.)
Classification scores, returned as an n_-by-K matrix, where n is the number of observations in X and_K is the number of unique classes. The classification scoreScore(i,j) represents the posterior probability that theith observation belongs to class j.
More About
The classification scores for a neural network classifier are computed using the softmax activation function that follows the final fully connected layer in the network. The scores correspond to posterior probabilities.
The posterior probability that an observation x is of class_k_ is
where
- P(x|k) is the conditional probability of x given class_k_.
- P(k) is the prior probability for class k.
- K is the number of classes in the response variable.
- a k(x) is the k output from the final fully connected layer for observation x.
Alternative Functionality
Simulink Block
To integrate the prediction of a neural network classification model into Simulink®, you can use the ClassificationNeuralNetwork Predict block in the Statistics and Machine Learning Toolbox™ library or a MATLAB® Function block with the predict function. For examples, see Predict Class Labels Using ClassificationNeuralNetwork Predict Block and Predict Class Labels Using MATLAB Function Block.
When deciding which approach to use, consider the following:
- If you use the Statistics and Machine Learning Toolbox library block, you can use the Fixed-Point Tool (Fixed-Point Designer) to convert a floating-point model to fixed point.
- Support for variable-size arrays must be enabled for a MATLAB Function block with the
predictfunction. - If you use a MATLAB Function block, you can use MATLAB functions for preprocessing or post-processing before or after predictions in the same MATLAB Function block.
Extended Capabilities
Usage notes and limitations:
- Use saveLearnerForCoder, loadLearnerForCoder, and codegen (MATLAB Coder) to generate code for the
predictfunction. Save a trained model by usingsaveLearnerForCoder. Define an entry-point function that loads the saved model by usingloadLearnerForCoderand calls thepredictfunction. Then usecodegento generate code for the entry-point function. - To generate single-precision C/C++ code for
predict, specifyDataType="single"when you call the loadLearnerForCoder function. - This table contains notes about the arguments of
predict. Arguments not included in this table are fully supported.Argument Notes and Limitations Mdl For the usage notes and limitations of the model object, see Code Generation of theCompactClassificationNeuralNetwork object. X X must be a single-precision or double-precision matrix or a table containing numeric variables, categorical variables, or both.The number of rows, or observations, in X can be a variable size, but the number of columns in X must be fixed.If you want to specify X as a table, then your model must be trained using a table, and your entry-point function for prediction must do the following: Accept data as arrays.Create a table from the data input arguments and specify the variable names in the table.Pass the table to predict.For an example of this table workflow, see Generate Code to Classify Data in Table. For more information on using tables in code generation, see Code Generation for Tables (MATLAB Coder) and Table Limitations for Code Generation (MATLAB Coder). ObservationsIn Thedimension value for theObservationsIn name-value argument must be a compile-time constant. For example, to use"ObservationsIn","columns" in the generated code, include{coder.Constant("ObservationsIn"),coder.Constant("columns")} in the -args value of codegen (MATLAB Coder).
For more information, see Introduction to Code Generation.
Version History
Introduced in R2021a
predict fully supports GPU arrays.