predict - Predict labels using classification ensemble model - MATLAB (original) (raw)
Predict labels using classification ensemble model
Syntax
Description
[labels](#mw%5F45a074ca-6b95-4745-8a9b-f093e519ebcd) = predict([ens](#bst1mxt-1%5Fsep%5Fmw%5F9a313be9-957b-4113-88dc-97029b07e5fe),[X](#bst1mxt-1-X)) returns a vector of predicted class labels for the predictor data in the table or matrix X, based on the trained classification ensemble model (full or compact) ens.
[labels](#mw%5F45a074ca-6b95-4745-8a9b-f093e519ebcd) = predict([ens](#bst1mxt-1%5Fsep%5Fmw%5F9a313be9-957b-4113-88dc-97029b07e5fe),[X](#bst1mxt-1-X),[Name=Value](#namevaluepairarguments)) specifies additional options using one or more name-value arguments. For example, you can specify the weak learners to use for predictions, and perform computations in parallel.
[[labels](#mw%5F45a074ca-6b95-4745-8a9b-f093e519ebcd),[scores](#bst1mxt-1-score)] = predict(___) also returns a matrix of classification scores indicating the likelihood that a label comes from a particular class, using any of the input argument combinations in the previous syntaxes. For each observation in X, the predicted class label corresponds to the maximum score among all classes.
Examples
Load Fisher's iris data set. Determine the sample size.
load fisheriris N = size(meas,1);
Partition the data into training and test sets. Hold out 10% of the data for testing.
rng(1); % For reproducibility cvp = cvpartition(N,'Holdout',0.1); idxTrn = training(cvp); % Training set indices idxTest = test(cvp); % Test set indices
Store the training data in a table.
tblTrn = array2table(meas(idxTrn,:)); tblTrn.Y = species(idxTrn);
Train a classification ensemble using AdaBoostM2 and the training set. Specify tree stumps as the weak learners.
t = templateTree('MaxNumSplits',1); Mdl = fitcensemble(tblTrn,'Y','Method','AdaBoostM2','Learners',t);
Predict labels for the test set. You trained model using a table of data, but you can predict labels using a matrix.
labels = predict(Mdl,meas(idxTest,:));
Construct a confusion matrix for the test set.
confusionchart(species(idxTest),labels)
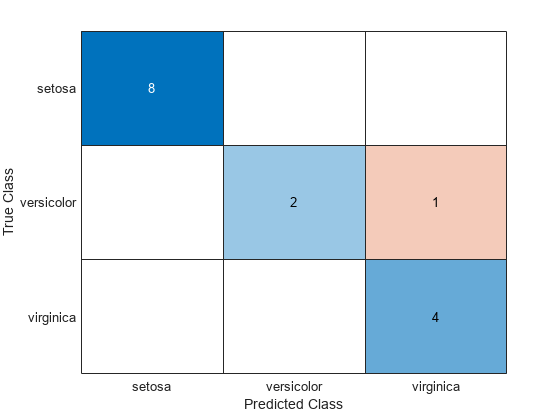
Mdl misclassifies one versicolor iris as virginica in the test set.
Create an ensemble of boosted trees and inspect the importance of each predictor. Using test data, assess the classification accuracy of the ensemble.
Load the arrhythmia data set. Determine the class representations in the data.
load arrhythmia Y = categorical(Y); tabulate(Y)
Value Count Percent 1 245 54.20% 2 44 9.73% 3 15 3.32% 4 15 3.32% 5 13 2.88% 6 25 5.53% 7 3 0.66% 8 2 0.44% 9 9 1.99% 10 50 11.06% 14 4 0.88% 15 5 1.11% 16 22 4.87%
The data set contains 16 classes, but not all classes are represented (for example, class 13). Most observations are classified as not having arrhythmia (class 1). The data set is highly discrete with imbalanced classes.
Combine all observations with arrhythmia (classes 2 through 15) into one class. Remove those observations with an unknown arrhythmia status (class 16) from the data set.
idx = (Y ~= "16"); Y = Y(idx); X = X(idx,:); Y(Y ~= "1") = "WithArrhythmia"; Y(Y == "1") = "NoArrhythmia"; Y = removecats(Y);
Create a partition that evenly splits the data into training and test sets.
rng("default") % For reproducibility cvp = cvpartition(Y,"Holdout",0.5); idxTrain = training(cvp); idxTest = test(cvp);
cvp is a cross-validation partition object that specifies the training and test sets.
Train an ensemble of 100 boosted classification trees using AdaBoostM1. Specify to use tree stumps as the weak learners. Also, because the data set contains missing values, specify to use surrogate splits.
t = templateTree("MaxNumSplits",1,"Surrogate","on"); numTrees = 100; mdl = fitcensemble(X(idxTrain,:),Y(idxTrain),"Method","AdaBoostM1", ... "NumLearningCycles",numTrees,"Learners",t);
mdl is a trained ClassificationEnsemble model.
Inspect the importance measure for each predictor.
predImportance = predictorImportance(mdl); bar(predImportance) title("Predictor Importance") xlabel("Predictor") ylabel("Importance Measure")
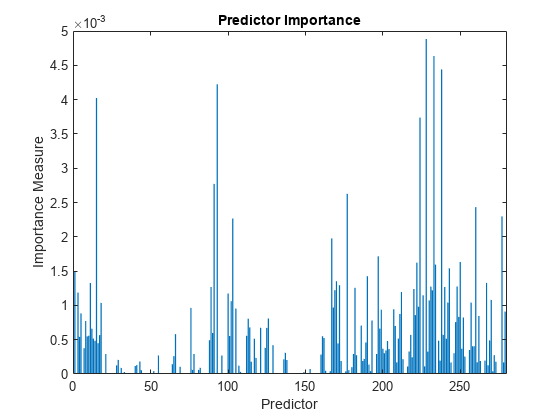
Identify the top ten predictors in terms of their importance.
[~,idxSort] = sort(predImportance,"descend"); idx10 = idxSort(1:10)
idx10 = 1×10
228 233 238 93 15 224 91 177 260 277
Classify the test set observations. View the results using a confusion matrix. Blue values indicate correct classifications, and red values indicate misclassified observations.
predictedValues = predict(mdl,X(idxTest,:)); confusionchart(Y(idxTest),predictedValues)
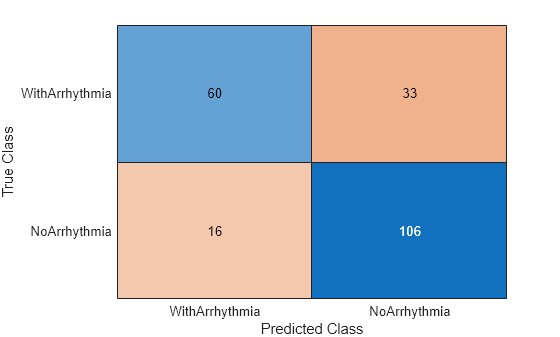
Compute the accuracy of the model on the test data.
error = loss(mdl,X(idxTest,:),Y(idxTest), ... "LossFun","classiferror"); accuracy = 1 - error
accuracy estimates the fraction of correctly classified observations.
Input Arguments
Predictor data to be classified, specified as a numeric matrix or a table.
Each row of X corresponds to one observation, and each column corresponds to one variable.
For a numeric matrix:
- The variables that make up the columns of
Xmust have the same order as the predictor variables used to trainens. - If you trained
ensusing a table (for example,tbl),Xcan be a numeric matrix iftblcontains only numeric predictor variables. To treat numeric predictors intblas categorical during training, specify categorical predictors using the CategoricalPredictors name-value argument offitcensemble. Iftblcontains heterogeneous predictor variables (for example, numeric and categorical data types) andXis a numeric matrix,predictissues an error.
For a table:
predictdoes not support multicolumn variables or cell arrays other than cell arrays of character vectors.- If you trained
ensusing a table (for example,tbl), all predictor variables inXmust have the same variable names and data types as those used to trainens(stored inens.PredictorNames). However, the column order ofXdoes not need to correspond to the column order oftbl.tblandXcan contain additional variables, such as response variables and observation weights, butpredictignores them. - If you trained
ensusing a numeric matrix, then the predictor names inens.PredictorNamesmust be the same as the corresponding predictor variable names inX. To specify predictor names during training, use the PredictorNames name-value argument of fitcensemble. All predictor variables inXmust be numeric vectors.Xcan contain additional variables, such as response variables and observation weights, butpredictignores them.
Name-Value Arguments
Specify optional pairs of arguments asName1=Value1,...,NameN=ValueN, where Name is the argument name and Value is the corresponding value. Name-value arguments must appear after other arguments, but the order of the pairs does not matter.
Before R2021a, use commas to separate each name and value, and enclose Name in quotes.
Example: predict(ens,X,Learners=[1 2 3 5],UseParallel=true) specifies to use the first, second, third, and fifth learners in the ensembleens, and to perform computations in parallel.
Indices of the weak learners in the ensemble to use withpredict, specified as a vector of positive integers in the range [1:ens.NumTrained]. By default, the function uses all learners.
Example: Learners=[1 2 4]
Data Types: single | double
Option to use observations for learners, specified as a logical matrix of sizeN-by-T, where:
When UseObsForLearner(i,j) is true (default), learner j is used in predicting the class of row i of X.
Example: UseObsForLearner=logical([1 1; 0 1; 1 0])
Data Types: logical matrix
Flag to run in parallel, specified as a numeric or logical1 (true) or 0 (false). If you specify UseParallel=true, thepredict function executes for-loop iterations by using parfor. The loop runs in parallel when you have Parallel Computing Toolbox™.
Example: UseParallel=true
Data Types: logical
Output Arguments
Predicted class labels, returned as a categorical, character, logical, or numeric array, or a cell array of character vectors.labels has the same data type as the labels used to train ens. (The software treats string arrays as cell arrays of character vectors.)
The predict function classifies an observation into the class yielding the highest score. For an observation with NaN scores, the function classifies the observation into the majority class, which makes up the largest proportion of the training labels.
Class scores, returned as a numeric matrix with one row per observation and one column per class. For each observation and each class, the score represents the confidence that the observation originates from that class. A higher score indicates a higher confidence. For more information, see Score (ensemble).
More About
For ensembles, a classification score represents the confidence that an observation originates from a specific class. The higher the score, the higher the confidence.
Different ensemble algorithms have different definitions for their scores. Furthermore, the range of scores depends on ensemble type. For example:
Bagscores range from0to1. You can interpret these scores as probabilities averaged over all the trees in the ensemble.AdaBoostM1,GentleBoost, andLogitBoostscores range from –∞ to ∞. You can convert these scores to probabilities by setting theScoreTransformproperty ofensto"doublelogit"before passingenstopredict:
ens.ScoreTransform = "doublelogit";
[labels,scores] = predict(ens,X);
Alternatively, you can specifyScoreTransform="doublelogit"in the call tofitcensemblewhen you createens.
For more information on the different ensemble algorithms and how they compute scores, see Ensemble Algorithms.
Alternative Functionality
Simulink Block
To integrate the prediction of an ensemble into Simulink®, you can use the ClassificationEnsemble Predict block in the Statistics and Machine Learning Toolbox™ library or a MATLAB® Function block with the predict function. For examples, see Predict Class Labels Using ClassificationEnsemble Predict Block and Predict Class Labels Using MATLAB Function Block.
When deciding which approach to use, consider the following:
- If you use the Statistics and Machine Learning Toolbox library block, you can use the Fixed-Point Tool (Fixed-Point Designer) to convert a floating-point model to fixed point.
- Support for variable-size arrays must be enabled for a MATLAB Function block with the
predictfunction. - If you use a MATLAB Function block, you can use MATLAB functions for preprocessing or post-processing before or after predictions in the same MATLAB Function block.
Extended Capabilities
Usage notes and limitations:
- You cannot use the
UseParallelname-value argument with tall arrays.
For more information, see Tall Arrays.
Usage notes and limitations:
- Use saveLearnerForCoder, loadLearnerForCoder, and codegen (MATLAB Coder) to generate code for the
predictfunction. Save a trained model by usingsaveLearnerForCoder. Define an entry-point function that loads the saved model by usingloadLearnerForCoderand calls thepredictfunction. Then usecodegento generate code for the entry-point function. - To generate single-precision C/C++ code for
predict, specifyDataType="single"when you call the loadLearnerForCoder function. - You can also generate fixed-point C/C++ code for
predict. Fixed-point code generation requires an additional step that defines the fixed-point data types of the variables required for prediction. Create a fixed-point data type structure by using the data type function generated by generateLearnerDataTypeFcn, and then use the structure as an input argument ofloadLearnerForCoderin an entry-point function. Generating fixed-point C/C++ code requires MATLAB Coder™ and Fixed-Point Designer™. - Generating fixed-point code for
predictincludes propagating data types for individual learners and, therefore, can be time consuming. - This table contains notes about the arguments of
predict. Arguments not included in this table are fully supported.Argument Notes and Limitations ens For the usage notes and limitations of the model object, see Code Generation of theCompactClassificationEnsemble object. X For general code generation, X must be a single-precision or double-precision matrix or a table containing numeric variables, categorical variables, or both.For fixed-point code generation, X must be a fixed-point matrix.The number of rows, or observations, in X can be a variable size, but the number of columns in X must be fixed.If you want to specify X as a table, then your model must be trained using a table, and your entry-point function for prediction must do the following: Accept data as arrays.Create a table from the data input arguments and specify the variable names in the table.Pass the table to predict.For an example of this table workflow, see Generate Code to Classify Data in Table. For more information on using tables in code generation, see Code Generation for Tables (MATLAB Coder) and Table Limitations for Code Generation (MATLAB Coder). Name-value arguments Names in name-value arguments must be compile-time constants. For example, to allow user-defined indices up to 5 weak learners in the generated code, include {coder.Constant('Learners'),coder.typeof(0,[1,5],[0,1])} in the-args value of codegen (MATLAB Coder). "Learners" For fixed-point code generation, the"Learners" value must have an integer data type.
For more information, see Introduction to Code Generation.
To run in parallel, set the UseParallel name-value argument totrue in the call to this function.
For more general information about parallel computing, see Run MATLAB Functions with Automatic Parallel Support (Parallel Computing Toolbox).
You cannot use UseParallel with tall or GPU arrays or in code generation.
Usage notes and limitations:
- The
predictfunction does not support ensembles trained using decision tree learners with surrogate splits.
For more information, see Run MATLAB Functions on a GPU (Parallel Computing Toolbox).
Version History
Introduced in R2011a