CompactRegressionGP - Compact Gaussian process regression model class - MATLAB (original) (raw)
Namespace: classreg.learning.regr
Compact Gaussian process regression model class
Description
CompactRegressionGP is a compact Gaussian process regression (GPR) model. The compact model consumes less memory than a full model, because it does not include the data used for training the GPR model.
Because the compact model does not include the training data, you cannot perform some tasks, such as cross-validation, using the compact model. However, you can use the compact model for making predictions or calculate regression loss for new data (usepredict and loss).
Construction
Create a CompactRegressionGP object from a full RegressionGP model object by using compact.
Properties
Fitting
Data Types: char | function_handle
Categorical predictor indices, specified as a vector of positive integers. CategoricalPredictors contains index values indicating that the corresponding predictors are categorical. The index values are between 1 and p, where p is the number of predictors used to train the model. If none of the predictors are categorical, then this property is empty ([]).
Data Types: single | double
Estimated coefficients for the explicit basis functions, stored as a vector. You can define the explicit basis function by using the BasisFunction name-value pair argument in fitrgp.
Data Types: double
Estimated noise standard deviation of the GPR model, stored as a scalar value.
Data Types: double
Parameters used for training the GPR model, stored as a GPParams object.
Kernel Function
Data Types: char | function_handle
Prediction
Transformation applied to the predicted response, stored as a character vector describing how the response values predicted by the model are transformed. In RegressionGP, ResponseTransform is'none' by default, and RegressionGP does not use ResponseTransform when making predictions.
Active Set Selection
Size of the active set for sparse methods ('sd','sr', or 'fic'), stored as an integer value.
Data Types: double
Object Functions
| lime | Local interpretable model-agnostic explanations (LIME) |
|---|---|
| loss | Regression error for Gaussian process regression model |
| partialDependence | Compute partial dependence |
| plotPartialDependence | Create partial dependence plot (PDP) and individual conditional expectation (ICE) plots |
| predict | Predict response of Gaussian process regression model |
| shapley | Shapley values |
Examples
Generate example training data.
rng(1) % For reproducibility n = 100000; X = linspace(0,1,n)'; X = [X,X.^2]; y = 1 + X*[1;2] + sin(20X[1;-2]) + 0.2*randn(n,1);
Train a GPR model using the subset of regressors ('sr') approximation method and predict using the subset of data ('sd') method. Use 50 points in the active set and sparse greedy matrix approximation ('sgma') method for active set selection. Because the scales of the first and second predictors are different, it is good practice to standardize the data.
gprMdl = fitrgp(X,y,'KernelFunction','squaredExponential','FitMethod', ... 'sr','PredictMethod','sd','Basis','none','ActiveSetSize',50, ... 'ActiveSetMethod','sgma','Standardize',1,'KernelParameters',[1;1]);
fitrgp accepts any combination of fitting, prediction, and active set selection methods. In some cases it might not be possible to compute the standard deviations of the predicted responses, hence the prediction intervals. See Tips. And, in some cases, using the exact method might be expensive because of the size of the training data.
Create a compact GPR object.
cgprMdl = compact(gprMdl);
Generate the test data.
n = 4000; Xnew = linspace(0,1,n)'; Xnew = [Xnew,Xnew.^2]; ynew = 1 + Xnew*[1;2] + sin(20Xnew[1;-2]) + 0.2*randn(n,1);
Use the compact object to predict the response in test data and the prediction intervals.
[ypred,~,yci] = predict(cgprMdl,Xnew);
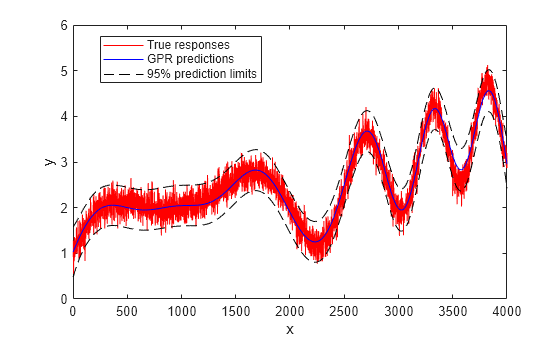
Plot the true response, predicted response, and prediction intervals.
figure plot(ynew,'r') hold on plot(ypred,'b') plot(yci(:,1),'k--') plot(yci(:,2),'k--') legend('True responses','GPR predictions','95% prediction limits','Location','Best') xlabel('x') ylabel('y') hold off
Compute the mean squared error loss on the test data using the trained GPR model.
L = loss(cgprMdl,Xnew,ynew)
Copy Semantics
Value. To learn how value classes affect copy operations, see Copying Objects.
Extended Capabilities
Version History
Introduced in R2015b