partialDependence - Compute partial dependence - MATLAB (original) (raw)
Compute partial dependence
Since R2020b
Syntax
Description
[pd](#mw%5F4cf387d8-aef1-42c1-b769-2a95425354e9) = partialDependence([RegressionMdl](#mw%5Fe5194151-ad06-445e-bf20-8cc2c5153075%5Fsep%5Fshared-RegressionMdl),[Vars](#mw%5F8994e1b1-475c-46aa-aad6-60896bd1e182)) computes the partial dependence pd between the predictor variables listed in Vars and model predictions. In this syntax, the model predictions are the responses predicted by using the regression modelRegressionMdl, which contains predictor data.
[pd](#mw%5F4cf387d8-aef1-42c1-b769-2a95425354e9) = partialDependence([ClassificationMdl](#mw%5Fe5194151-ad06-445e-bf20-8cc2c5153075%5Fsep%5Fshared-ClassificationMdl),[Vars](#mw%5F8994e1b1-475c-46aa-aad6-60896bd1e182),[Labels](#mw%5Fc4b0e88b-8ca0-4514-a7a9-567ff15f06ce)) computes the partial dependence pd between the predictor variables listed in Vars and the scores for the classes specified inLabels by using the classification modelClassificationMdl, which contains predictor data.
[pd](#mw%5F4cf387d8-aef1-42c1-b769-2a95425354e9) = partialDependence(___,[Data](#mw%5Fe5194151-ad06-445e-bf20-8cc2c5153075%5Fsep%5Fshared-X)) uses new predictor data in Data. You can specifyData in addition to any of the input argument combinations in the previous syntaxes.
[pd](#mw%5F4cf387d8-aef1-42c1-b769-2a95425354e9) = partialDependence([fun](#mw%5Fe5194151-ad06-445e-bf20-8cc2c5153075%5Fsep%5Fshared-fun),[Vars](#mw%5F8994e1b1-475c-46aa-aad6-60896bd1e182),[Data](#mw%5Fe5194151-ad06-445e-bf20-8cc2c5153075%5Fsep%5Fshared-X)) computes the partial dependence between the predictor variables listed inVars and the outputs returned by the custom modelfun, using the predictor data Data.
[pd](#mw%5F4cf387d8-aef1-42c1-b769-2a95425354e9) = partialDependence(___,[Name,Value](#namevaluepairarguments)) uses additional options specified by one or more name-value arguments. For example, if you specify "UseParallel","true", thepartialDependence function uses parallel computing to perform the partial dependence calculations.
[[pd](#mw%5F4cf387d8-aef1-42c1-b769-2a95425354e9),[x](#mw%5Ffe62b707-e59b-4d0e-8507-b89acb0dc68b),[y](#mw%5F744956a6-0d72-4c16-a4b7-606187d7037e)] = partialDependence(___) also returns x and y, which contain the query points of the first and second predictor variables in Vars, respectively. If you specify one variable in Vars, thenpartialDependence returns an empty matrix ([]) for y.
Examples
Train a naive Bayes classification model with the fisheriris data set, and compute partial dependence values that show the relationship between the predictor variable and the predicted scores (posterior probabilities) for multiple classes.
Load the fisheriris data set, which contains species (species) and measurements (meas) on sepal length, sepal width, petal length, and petal width for 150 iris specimens. The data set contains 50 specimens from each of three species: setosa, versicolor, and virginica.
Train a naive Bayes classification model with species as the response and meas as predictors.
Mdl = fitcnb(meas,species,"PredictorNames", ... ["Sepal Length","Sepal Width","Petal Length","Petal Width"]);
Compute partial dependence values on the third predictor variable (petal length) of the scores predicted by Mdl for all three classes of species. Specify the class labels by using the ClassNames property of Mdl.
[pd,x] = partialDependence(Mdl,3,Mdl.ClassNames);
pd contains the partial dependence values for the query points x. You can plot the computed partial dependence values by using plotting functions such as plot and bar. Plot pd against x by using the bar function.
bar(x,pd) legend(Mdl.ClassNames) xlabel("Petal Length") ylabel("Scores") title("Partial Dependence Plot")
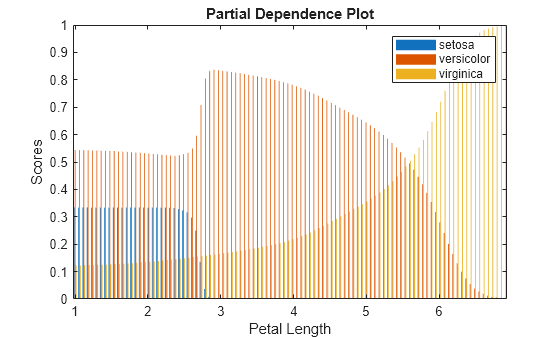
According to this model, the probability of virginica increases with petal length. The probability of setosa is about 0.33, from where petal length is 0 to around 2.5, and then the probability drops to almost 0.
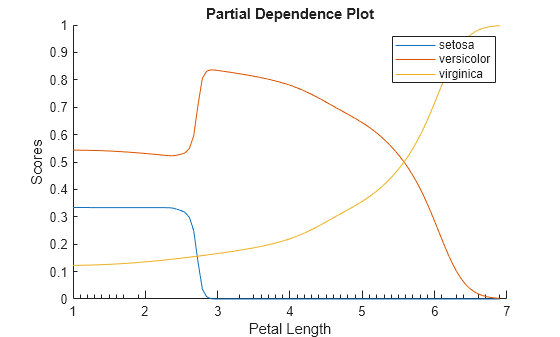
Alternatively, you can use the plotPartialDependence function to compute and plot partial dependence values.
plotPartialDependence(Mdl,3,Mdl.ClassNames)
Train an ensemble of classification models and compute partial dependence values on two variables for multiple classes. Then plot the partial dependence values for each class.
Load the census1994 data set, which contains US yearly salary data, categorized as <=50K or >50K, and several demographic variables.
Extract a subset of variables to analyze from the table adultdata.
X = adultdata(1:500,["age","workClass","education_num","marital_status","race", ... "sex","capital_gain","capital_loss","hours_per_week","salary"]);
Train a random forest of classification trees by using fitcensemble and specifying Method as "Bag". For reproducibility, use a template of trees created by using templateTree with the Reproducible option.
rng("default") t = templateTree("Reproducible",true); Mdl = fitcensemble(X,"salary","Method","Bag","Learners",t);
Inspect the class names in Mdl.
ans = 2×1 categorical <=50K >50K
Compute partial dependence values of the scores on the predictors age and education_num for both classes (<=50K and >50K). Specify the number of observations to sample as 100.
[pd,x,y] = partialDependence(Mdl,["age","education_num"],Mdl.ClassNames,"NumObservationsToSample",100);
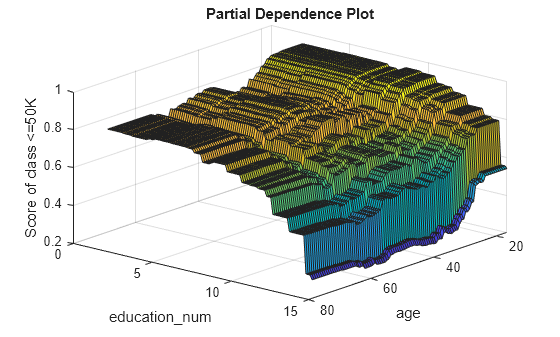
Create a surface plot of the partial dependence values for the first class (<=50K) by using the surf function.
figure surf(x,y,squeeze(pd(1,:,:))) xlabel("age") ylabel("education_num") zlabel("Score of class <=50K") title("Partial Dependence Plot") view([130 30]) % Modify the viewing angle
Create a surface plot of the partial dependence values for the second class (>50K).
figure surf(x,y,squeeze(pd(2,:,:))) xlabel("age") ylabel("education_num") zlabel("Score of class >50K") title("Partial Dependence Plot") view([130 30]) % Modify the viewing angle
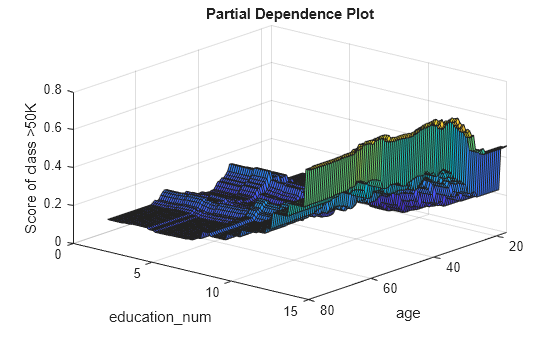
The two plots show different partial dependence patterns depending on the class.
Load the carbig sample data set.
The vectors Displacement, Cylinders, and Model_Year contain data for car engine displacement, number of engine cylinders, and year the car was manufactured, respectively.
Fit a multinomial regression model using Displacement and Cylinders as predictor variables and Model_Year as the response.
predvars = [Displacement,Cylinders]; Mdl = fitmnr(predvars,Model_Year,PredictorNames=["Displacement","Cylinders"]);
Create a vector of noisy predictor data from the predictor variables by using the rand function.
Data = predvars(1:10:end,:); rng("default") rows = length(Data); Data = Data + 10*rand([rows,2]);
Calculate the partial dependence of the response category probability corresponding to cars manufactured in 1980 on Displacement. Use the noisy predictor data to calculate the partial dependence.
[pd,x,~] = partialDependence(Mdl,"Displacement",80,Data)
pd = 1×100
0.0030 0.0031 0.0031 0.0032 0.0032 0.0033 0.0033 0.0033 0.0034 0.0034 0.0035 0.0035 0.0036 0.0036 0.0036 0.0037 0.0037 0.0037 0.0038 0.0038 0.0038 0.0039 0.0039 0.0039 0.0039 0.0039 0.0040 0.0040 0.0040 0.0040 0.0040 0.0040 0.0040 0.0040 0.0040 0.0040 0.0040 0.0040 0.0040 0.0040 0.0039 0.0039 0.0039 0.0039 0.0038 0.0038 0.0038 0.0037 0.0037 0.0036x = 100×1
73.7850 77.1781 80.5713 83.9644 87.3575 90.7507 94.1438 97.5370 100.9301 104.3232 107.7164 111.1095 114.5027 117.8958 121.2890 ⋮
The output shows the calculated values for the partial dependence of the category probability on Displacement. Because Displacement is a continuous variable, the partialDependence function calculates the partial dependence at 100 equally spaced query points x.
Plot the partial dependence using plotPartialDependence.
plotPartialDependence(Mdl,"Displacement",80,Data)
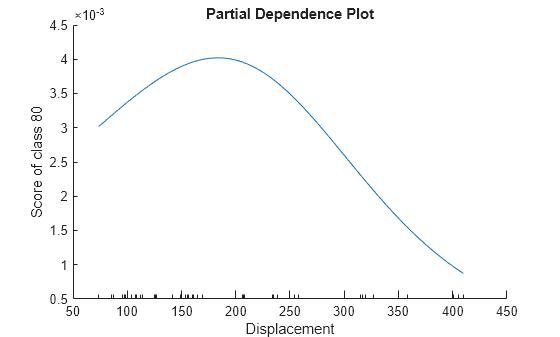
The plot shows that when Displacement increases from approximately 70 to approximately 180, the probability of a car being manufactured in 1980 increases. As Displacement continues to increase, the probability of a car being manufactured in 1980 decreases.
Train a support vector machine (SVM) regression model using the carsmall data set, and compute the partial dependence on two predictor variables. Then, create a figure that shows the partial dependence on the two variables along with the histogram on each variable.
Load the carsmall data set.
Create a table that contains Weight, Cylinders, Displacement, and Horsepower.
Tbl = table(Weight,Cylinders,Displacement,Horsepower);
Train an SVM regression model using the predictor variables in Tbl and the response variable MPG. Use a Gaussian kernel function with an automatic kernel scale.
Mdl = fitrsvm(Tbl,MPG,"ResponseName","MPG", ... "CategoricalPredictors","Cylinders","Standardize",true, ... "KernelFunction","gaussian","KernelScale","auto");
Compute the partial dependence of the predicted response (MPG) on the predictor variables Weight and Horsepower. Specify query points to compute the partial dependence by using the QueryPoints name-value argument.
numPoints = 10; ptX = linspace(min(Weight),max(Weight),numPoints)'; ptY = linspace(min(Horsepower),max(Horsepower),numPoints)'; [pd,x,y] = partialDependence(Mdl,["Weight","Horsepower"],"QueryPoints",[ptX ptY]);
Create a figure that contains a 5-by-5 tiled chart layout. Plot the partial dependence on the two variables by using the imagesc function. Then draw the histogram for each variable by using the histogram function. Specify the edges of the histograms so that the centers of the histogram bars align with the query points. Change the axes properties to align the axes of the plots.
t = tiledlayout(5,5,"TileSpacing","compact");
ax1 = nexttile(2,[4,4]); imagesc(x,y,pd) title("Partial Dependence Plot") colorbar("eastoutside") ax1.YDir = "normal";
ax2 = nexttile(22,[1,4]); dX = diff(ptX(1:2)); edgeX = [ptX-dX/2;ptX(end)+dX]; histogram(Weight,edgeX); xlabel("Weight") xlim(ax1.XLim);
ax3 = nexttile(1,[4,1]); dY = diff(ptY(1:2)); edgeY = [ptY-dY/2;ptY(end)+dY]; histogram(Horsepower,edgeY) xlabel("Horsepower") xlim(ax1.YLim); ax3.XDir = "reverse"; camroll(-90)
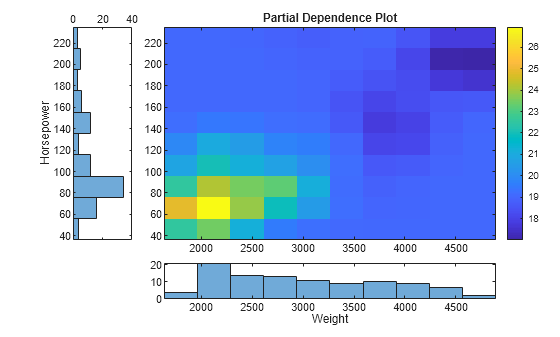
Each element of pd specifies the color for one pixel of the image plot. The histograms aligned with the axes of the image show the distribution of the predictors.
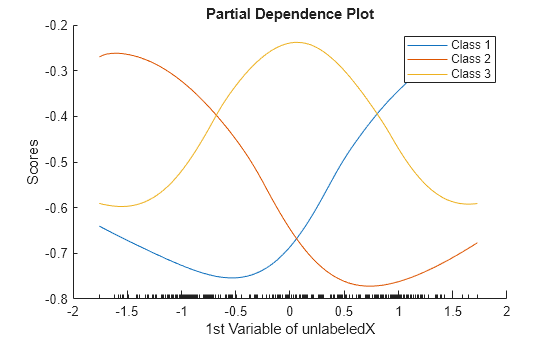
Compute the partial dependence of label scores on predictor variables for a SemiSupervisedSelfTrainingModel object. You cannot pass a SemiSupervisedSelfTrainingModel object directly to the partialDependence function. Instead, define a custom function that returns label scores for the object, and then pass the function to partialDependence.
Randomly generate 15 observations of labeled data, with five observations in each of three classes.
rng("default") % For reproducibility labeledX = [randn(5,2)*0.25 + ones(5,2); randn(5,2)*0.25 - ones(5,2); randn(5,2)*0.5]; Y = [ones(5,1); ones(5,1)*2; ones(5,1)*3];
Randomly generate 300 additional observations of unlabeled data, with 100 observations per class.
unlabeledX = [randn(100,2)*0.25 + ones(100,2); randn(100,2)*0.25 - ones(100,2); randn(100,2)*0.5];
Fit labels to the unlabeled data by using a semi-supervised self-training method. The function fitsemiself returns a SemiSupervisedSelfTrainingModel object.
Mdl = fitsemiself(labeledX,Y,unlabeledX);
Define the custom function myLabelScores, which returns label scores computed by the predict function of SemiSupervisedSelfTrainingModel; the custom function definition appears at the end of this example.
Compute the partial dependence of the scores for unlabeledX on each variable for all classes. partialDependence accepts a custom model in the form of a function handle. The function represented by the function handle must accept predictor data and return a column vector or matrix with one row for each observation. Specify the custom model as @(X)myLabelScores(Mdl,X) so that the custom function uses the trained model Mdl and accepts predictor data.
[pd1,x1] = partialDependence(@(X)myLabelScores(Mdl,X),1,unlabeledX); [pd2,x2] = partialDependence(@(X)myLabelScores(Mdl,X),2,unlabeledX);
You can plot the computed partial dependence values by using plotting functions such as plot and bar. Alternatively, you can use the plotPartialDependence function to compute and plot partial dependence values.
Create partial dependence plots for the first variable and all classes.
plotPartialDependence(@(X)myLabelScores(Mdl,X),1,unlabeledX) xlabel("1st Variable of unlabeledX") ylabel("Scores") legend("Class 1","Class 2","Class 3")
Custom Function myLabelScores
function scores = myLabelScores(Mdl,X) [~,scores] = predict(Mdl,X); end
Input Arguments
Data Types: function_handle
Predictor variables, specified as a vector of positive integers, character vector, string scalar, string array, or cell array of character vectors. You can specify one or two predictor variables, as shown in the following tables.
One Predictor Variable
| Value | Description |
|---|---|
| positive integer | Index value corresponding to the column of the predictor data. |
| character vector or string scalar | Name of the predictor variable. The name must match the entry in thePredictorNames property forRegressionMdl andClassificationMdl or the variable name ofData in a table for a custom modelfun. |
Two Predictor Variables
| Value | Description |
|---|---|
| vector of two positive integers | Index values corresponding to the columns of the predictor data. |
| string array or cell array of character vectors | Names of the predictor variables. Each element in the array is the name of a predictor variable. The names must match the entries in thePredictorNames property forRegressionMdl andClassificationMdl or the variable names ofData in a table for a custom modelfun. |
Example: ["x1","x3"]
Data Types: single | double | char | string | cell
Class labels, specified as a categorical or character array, logical or numeric vector, or cell array of character vectors. The values and data types inLabels must match those of the class names in theClassNames property of ClassificationMdl (ClassificationMdl.ClassNames).
You can specify one or multiple class labels.
This argument is valid only when you specify a classification model objectClassificationMdl.
Example: ["red","blue"]
Example: ClassificationMdl.ClassNames([1 3]) specifiesLabels as the first and third classes inClassificationMdl.
Data Types: single | double | logical | char | cell | categorical
Data Types: single | double | table
Name-Value Arguments
Specify optional pairs of arguments asName1=Value1,...,NameN=ValueN, where Name is the argument name and Value is the corresponding value. Name-value arguments must appear after other arguments, but the order of the pairs does not matter.
Before R2021a, use commas to separate each name and value, and enclose Name in quotes.
Example: partialDependence(Mdl,Vars,Data,"NumObservationsToSample",100,"UseParallel",true) computes the partial dependence values by using 100 sampled observations in`Data` and executing for-loop iterations in parallel.
Number of observations to sample, specified as a positive integer. The default value is the number of total observations in Data or the model (RegressionMdl or ClassificationMdl). If you specify a value larger than the number of total observations, thenpartialDependence uses all observations.
partialDependence samples observations without replacement by using thedatasample function and uses the sampled observations to compute partial dependence.
Example: "NumObservationsToSample",100
Data Types: single | double
Points to compute partial dependence for numeric predictors, specified as a numeric column vector, a numeric two-column matrix, or a cell array of two numeric column vectors.
- If you select one predictor variable in Vars, use a numeric column vector.
- If you select two predictor variables in
Vars:- Use a numeric two-column matrix to specify the same number of points for each predictor variable.
- Use a cell array of two numeric column vectors to specify a different number of points for each predictor variable.
The default value is a numeric column vector or a numeric two-column matrix, depending on the number of selected predictor variables. Each column contains 100 evenly spaced points between the minimum and maximum values of the sampled observations for the corresponding predictor variable.
You cannot modify QueryPoints for a categorical variable. ThepartialDependence function uses all categorical values in the selected variable.
If you select one numeric variable and one categorical variable, you can specifyQueryPoints for a numeric variable by using a cell array consisting of a numeric column vector and an empty array.
Example: "QueryPoints",{pt,[]}
Data Types: single | double | cell
Data Types: single | double | logical | char | string | cell
Output columns of the custom model fun to use for the partial dependence computation, specified as one of the values in this table.
| Value | Description |
|---|---|
| Vector of positive integers | Each entry in the vector is an index value indicating that partialDependence uses the corresponding output column for the partial dependence computation. The index values are between 1 and q, where q is the number of columns in the output matrix returned by the custom model fun. |
| Logical vector | A true entry means that partialDependence uses the corresponding output column for the partial dependence computation. The length of the vector is q. |
| "all" | partialDependence uses all output columns for the partial dependence computation. |
This argument is valid only when you specify a custom model by usingfun.
Example: "OutputColumns",[1 2]
Data Types: single | double | logical | char | string
Since R2024a
Predicted response value to use for observations with missing predictor values, specified as "median", "mean", or a numeric scalar.
| Value | Description |
|---|---|
| "median" | partialDependence uses the median of the observed response values in the training data as the predicted response value for observations with missing predictor values. |
| "mean" | partialDependence uses the mean of the observed response values in the training data as the predicted response value for observations with missing predictor values. |
| Numeric scalar | partialDependence uses this value as the predicted response value for observations with missing predictor values.If you specify NaN, thenpartialDependence omits observations with missing predictor values from partial dependence computations. |
If an observation has a missing value in a Vars predictor variable, then partialDependence does not use the observation in partial dependence computations.
Note
This name-value argument is valid only for these types of regression models: Gaussian process regression, kernel, linear, neural network, and support vector machine. That is, you can specify this argument only whenRegressionMdl is a RegressionGP,CompactRegressionGP, RegressionKernel,RegressionLinear, RegressionNeuralNetwork,CompactRegressionNeuralNetwork, RegressionSVM, or CompactRegressionSVM object.
Example: "PredictionForMissingValue","mean"
Example: "PredictionForMissingValue",NaN
Data Types: single | double | char | string
Output Arguments
Partial dependence values, returned as a numeric array.
The dimension of pd depends on the type of model (regression, classification or custom), number of variables specified in Vars, number of classes specified in Labels (classification model only), and number of columns specified in OutputColumns (custom model only).
For a regression model (RegressionMdl), the following conditions apply:
- If you specify two variables in
Vars,pdis anumY-by-numXmatrix, wherenumYandnumXare the number of query points of the second and first variables inVars, respectively. The value inpd(i,j)is the partial dependence value of the query point corresponding to[y](#mw%5F744956a6-0d72-4c16-a4b7-606187d7037e)(i)and[x](#mw%5Ffe62b707-e59b-4d0e-8507-b89acb0dc68b)(j).`y`(i)is theith query point of the second predictor variable, and`x`(j)is thejth query point of the first predictor variable. - If you specify one variable in
Vars,pdis a1-by-numXvector.
For a classification model (ClassificationMdl), the following conditions apply:
- If you specify two variables in
Vars,pdis anum-by-numY-by-numXarray, wherenumis the number of class labels inLabels. The value inpd(i,j,k)is the partial dependence value of the query point`y`(j)and`x`(k)for theith class label inLabels. - If you specify one variable in
Vars,pdis anum-by-numXmatrix. - If you specify one class in
Labels,pdis anumY-by-numXmatrix. - If you specify one variable and one class,
pdis a1-by-numXvector.
For a custom model (fun), the following conditions apply:
- If you specify two variables in
Vars,pdis anum-by-numY-by-numXarray, wherenumis the number of output columns inOutputColumns. The value inpd(i,j,k)is the partial dependence value of the query point`y`(j)and`x`(k)for theith column inOutputColumns. - If you specify one variable in
Vars,pdis anum-by-numXmatrix. - If you specify one column in
OutputColumns,pdis anumY-by-numXmatrix. - If you specify one variable and one column,
pdis a1-by-numXvector.
Query points of the first predictor variable in Vars, returned as a numeric or categorical column vector.
If the predictor variable is numeric, then you can specify the query points by using the QueryPoints name-value argument.
Data Types: single | double | categorical
Query points of the second predictor variable in Vars, returned as a numeric or categorical column vector. This output argument is empty ([]) if you specify only one variable inVars.
If the predictor variable is numeric, then you can specify the query points by using the QueryPoints name-value argument.
Data Types: single | double | categorical
More About
Partial dependence [1] represents the relationships between predictor variables and predicted responses in a trained regression model.partialDependence computes the partial dependence of predicted responses on a subset of predictor variables by marginalizing over the other variables.
Consider partial dependence on a subset XS of the whole predictor variable set X = {x1,x2, …,xm}. A subset XS includes either one variable or two variables: XS = {xS1} or XS = {xS1,xS2}. Let XC be the complementary set of XS in X. A predicted response f(X) depends on all variables in_X_:
f(X) =f(XS,XC).
The partial dependence of predicted responses on_XS_ is defined by the expectation of predicted responses with respect to XC:
where_pC_(XC) is the marginal probability of XC, that is, pC(XC)≈∫p(XS,XC)dXS. Assuming that each observation is equally likely, and the dependence between XS and_XC_ and the interactions of_XS_ and_XC_ in responses is not strong,partialDependence estimates the partial dependence by using observed predictor data as follows:
| fS(XS)≈1N∑i=1Nf(XS,XiC), | (1) |
|---|
where N is the number of observations and Xi = (XiS,XiC) is the _i_th observation.
When you call the partialDependence function, you can specify a trained model (f(·)) and select variables (XS) by using the input argumentsRegressionMdl and Vars, respectively.partialDependence computes the partial dependence at 100 evenly spaced points of XS or the points that you specify by using the QueryPoints name-value argument. You can specify the number (N) of observations to sample from given predictor data by using theNumObservationsToSample name-value argument.
In the case of classification models,partialDependence computes the partial dependence in the same way as for regression models, with one exception: instead of using the predicted responses from the model, the function uses the predicted scores for the classes specified inLabels.
The weighted traversal algorithm [1] is a method to estimate partial dependence for a tree-based model. The estimated partial dependence is the weighted average of response or score values corresponding to the leaf nodes visited during the tree traversal.
Let XS be a subset of the whole variable set X and XC be the complementary set of XS in_X_. For each XS value to compute partial dependence, the algorithm traverses a tree from the root (beginning) node down to leaf (terminal) nodes and finds the weights of leaf nodes. The traversal starts by assigning a weight value of one at the root node. If a node splits by_XS_, the algorithm traverses to the appropriate child node depending on the XS value. The weight of the child node becomes the same value as its parent node. If a node splits by XC, the algorithm traverses to both child nodes. The weight of each child node becomes a value of its parent node multiplied by the fraction of observations corresponding to each child node. After completing the tree traversal, the algorithm computes the weighted average by using the assigned weights.
For an ensemble of bagged trees, the estimated partial dependence is an average of the weighted averages over the individual trees.
Algorithms
For both a regression model (RegressionMdl) and a classification model (ClassificationMdl), partialDependence uses apredict function to predict responses or scores.partialDependence chooses the proper predict function according to the model and runs predict with its default settings. For details about each predict function, see the predict functions in the following two tables. If the specified model is a tree-based model (not including a boosted ensemble of trees), then partialDependence uses the weighted traversal algorithm instead of the predict function. For details, see Weighted Traversal Algorithm.
Regression Model Object
| Model Type | Full or Compact Regression Model Object | Function to Predict Responses |
|---|---|---|
| Bootstrap aggregation for ensemble of decision trees | CompactTreeBagger | predict |
| Bootstrap aggregation for ensemble of decision trees | TreeBagger | predict |
| Ensemble of regression models | RegressionEnsemble, RegressionBaggedEnsemble, CompactRegressionEnsemble | predict |
| Gaussian kernel regression model using random feature expansion | RegressionKernel | predict |
| Gaussian process regression | RegressionGP, CompactRegressionGP | predict |
| Generalized additive model | RegressionGAM, CompactRegressionGAM | predict |
| Generalized linear mixed-effect model | GeneralizedLinearMixedModel | predict |
| Generalized linear model | GeneralizedLinearModel, CompactGeneralizedLinearModel | predict |
| Linear mixed-effect model | LinearMixedModel | predict |
| Linear regression | LinearModel, CompactLinearModel | predict |
| Linear regression for high-dimensional data | RegressionLinear | predict |
| Neural network regression model | RegressionNeuralNetwork, CompactRegressionNeuralNetwork | predict |
| Nonlinear regression | NonLinearModel | predict |
| Censored linear regression | CensoredLinearModel, CompactCensoredLinearModel | predict |
| Regression tree | RegressionTree, CompactRegressionTree | predict |
| Support vector machine | RegressionSVM, CompactRegressionSVM | predict |
Classification Model Object
| Model Type | Full or Compact Classification Model Object | Function to Predict Labels and Scores |
|---|---|---|
| Discriminant analysis classifier | ClassificationDiscriminant,CompactClassificationDiscriminant | predict |
| Multiclass model for support vector machines or other classifiers | ClassificationECOC, CompactClassificationECOC | predict |
| Ensemble of learners for classification | ClassificationEnsemble, CompactClassificationEnsemble,ClassificationBaggedEnsemble | predict |
| Gaussian kernel classification model using random feature expansion | ClassificationKernel | predict |
| Generalized additive model | ClassificationGAM, CompactClassificationGAM | predict |
| _k_-nearest neighbor model | ClassificationKNN | predict |
| Linear classification model | ClassificationLinear | predict |
| Naive Bayes model | ClassificationNaiveBayes, CompactClassificationNaiveBayes | predict |
| Neural network classifier | ClassificationNeuralNetwork, CompactClassificationNeuralNetwork | predict |
| Support vector machine for one-class and binary classification | ClassificationSVM, CompactClassificationSVM | predict |
| Binary decision tree for multiclass classification | ClassificationTree, CompactClassificationTree | predict |
| Bagged ensemble of decision trees | TreeBagger, CompactTreeBagger | predict |
References
[1] Friedman, Jerome. H. “Greedy Function Approximation: A Gradient Boosting Machine.” The Annals of Statistics 29, no. 5 (2001): 1189-1232.
[2] Hastie, Trevor, Robert Tibshirani, and Jerome Friedman. The Elements of Statistical Learning. New York, NY: Springer New York, 2009.
Extended Capabilities
Usage notes and limitations:
- This function fully supports GPU arrays for the following regression and classification models:
- LinearModel and CompactLinearModel objects
- GeneralizedLinearModel and CompactGeneralizedLinearModel objects
- RegressionKernel and ClassificationKernel objects
- RegressionSVM and CompactRegressionSVM objects
- RegressionNeuralNetwork and CompactRegressionNeuralNetwork objects
- ClassificationNeuralNetwork and CompactClassificationNeuralNetwork
- RegressionLinear objects
- ClassificationLinear objects
- This function supports GPU arrays with limitations for the regression and classification models described in this table.
- This function fully supports GPU arrays for a custom function if the custom function supports GPU arrays.
For more information, see Run MATLAB Functions on a GPU (Parallel Computing Toolbox).
Version History
Introduced in R2020b
If RegressionMdl is a Gaussian process regression, kernel, linear, neural network, or support vector machine model, you can now use observations with missing predictor values in partial dependence computations. Specify thePredictionForMissingValue name-value argument.
- A value of
"median"is consistent with the behavior in R2023b. - A value of
NaNis consistent with the behavior in R2023a, where the regression models do not support using observations with missing predictor values for prediction.
partialDependence fully supports GPU arrays forRegressionLinear models.
Starting in R2024a, partialDependence fully supports GPU arrays forClassificationLinear models.
Starting in R2023a, partialDependence fully supports GPU arrays forRegressionSVM andCompactRegressionSVM models.