Individual ‘Fingerprints’ in Human Sleep EEG Topography (original) (raw)
Abstract
The sleep EEG of eight healthy young men was recorded from 27 derivations during a baseline night and a recovery night after 40 h of waking. Individual power maps of the nonREM sleep EEG were calculated for the delta, theta, alpha, sigma and beta range. The comparison of the normalized individual maps for baseline and recovery sleep revealed very similar individual patterns within each frequency band. This high correspondence was quantified and statistically confirmed by calculating the Manhattan distance between all pairs of maps within and between individuals. Although prolonged waking enhanced power in the low-frequency range (0.75–10.5 Hz) and reduced power in the high-frequency range (13.25–25 Hz), only minor effects on the individual topography were observed. Nevertheless, statistical analysis revealed frequency-specific regional effects of sleep deprivation. The results demonstrate that the pattern of the EEG power distribution in nonREM sleep is characteristic for an individual and may reflect individual traits of functional anatomy.
Main
Sleep is generally regarded as a global brain process. Recently, regional aspects of sleep have gained increasing attention. Early reports that the location of the recording electrodes affects the pattern of the sleep EEG (Findji et al. 1981; Buchsbaum et al. 1982; Hori 1985) were reexamined by using contemporary methods of quantitative EEG analysis. Power spectra along the antero-posterior axis were shown to exhibit frequency-specific and state-dependent gradients (Werth et al. 1996, 1997) with a frontal predominance in the 2-Hz band during the initial part of sleep. This hyperfrontality of low-frequency activity was accentuated by sleep deprivation (Cajochen et al. 1999). It may be associated with the reduction of regional cerebral blood flow which is known to occur during slow wave sleep (Finelli et al. 2000b; for a review see Maquet 2000) as well as in the course of prolonged waking (Thomas et al. 1998, 2000). These findings support the hypothesis that sleep has a local, use-dependent, facet and that cerebral structures that had been particularly active during waking may exhibit more intensive signs of sleep (Horne 1993; Krueger and Obál 1993; Kattler et al. 1994; Benington and Heller 1995; Borbély and Achermann 2000).
Studies on regional differences in the sleep EEG are typically based on the statistical analysis of the records from several subjects. This approach emphasizes the changes common to all subjects, and tends to disregard individual differences. However, individual features may be important. This was recently demonstrated in a study where the relationship between the waking and sleep EEG was investigated (Finelli et al. 2000a). Examining the individual time course of theta power in the waking EEG in the course of a 40-h sleep deprivation period revealed a correlation with the change in delta power in the nonREM sleep EEG. The results suggested that a common regulatory process might control specific parts of the waking and sleep EEG.
The aim of the present analysis was to investigate the individual topographic distribution of power in nonREM sleep before and after sleep deprivation, a manipulation known to cause massive changes in the sleep EEG.
SUBJECTS AND METHODS
Eight right-handed healthy male subjects (mean age 23 y ± 0.46 SEM, range 21–25 years) participated in the study. They were selected on the basis of a screening night in the sleep laboratory prior to the study. Exclusion criteria were the presence of sleep disturbances such as sleep apnea and nocturnal myoclonus, prolonged sleep latency and low sleep efficiency. The study protocol consisted of an adaptation night, a baseline night followed by 40 hours of sleep deprivation, and a recovery night. In the adaptation and baseline nights the sleep episode was scheduled from 11 P.M. to 7 A.M. Recovery sleep started at 11 P.M. and subjects were allowed to sleep until 11:00 A.M. For details see Finelli et al. 2000a.
The electroencephalogram (EEG), electrooculogram and submental electromyogram were recorded by a polygraphic amplifier (sampling rate 128 Hz; low-pass filter at 30 Hz). Twenty-seven EEG electrodes were placed according to an extended version of the International 10–20 System with additional electrodes placed at FC1, FC2, CP1, CP2, PO1 and PO2. They were referenced to a technical reference electrode placed 5% rostrally to Cz. In addition the C3A2 and C3-linked mastoids were recorded. The EEG electrodes were kept in place from the beginning of baseline sleep to the end of recovery sleep. Electrode impedances were checked regularly. The sleep stages were visually scored for 20-s epochs (C3A2 derivation) according to the criteria of Rechtschaffen and Kales (1968).
Power spectra were calculated for consecutive 4-s epochs (linear detrending, Hanning window) for each of the 27 derivations. Average reference was used (the signal in each derivation was expressed relative to the average value of all 27 derivations). Five consecutive 4-s epochs were matched with the corresponding sleep stage. Artifacts were excluded on a 4-s basis by visual inspection of the derivations C3A2, Fz, Cz, Pz, and Oz. Additional artifacts were excluded if power in the 0.75–4.5 Hz or 20–30 Hz band exceeded a threshold based on a moving average determined over 15 20-s epochs.
Average power spectra were calculated for nonREM sleep (stages 2 to 4) over the maximum common sleep length of 7 h 32 min. In one subject only 4 h 7 min of data were obtained due to technical problems in the second half of the baseline night.
Each map was treated as a vector with 27 components and was normalized by its mean value across the 27 derivations. All possible pairs of maps within and between subjects were compared by calculating the Manhattan distance between them (sum of absolute difference at all 27 derivations). The analysis was restricted to the delta (2.0–4. 75 Hz), theta (5.0–8.75 Hz), alpha (9.0–11.75 Hz), sigma (13.0–15.75 Hz), and beta (17.0–24.75 Hz) band. The numbers denote the mid-frequency of the lowest and highest 0.25-Hz bin. The selection of the frequency bands was based on a cluster analysis of average 1-Hz maps (Finelli et al. 2001).
RESULTS
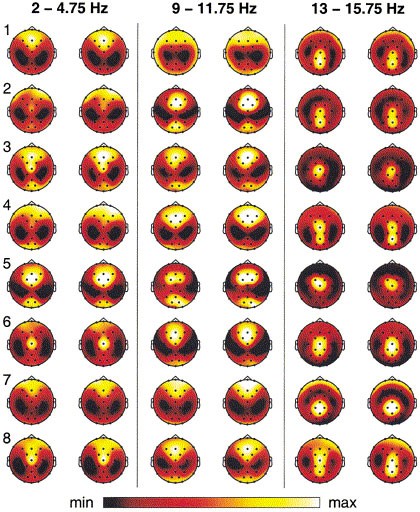
Figure 1 shows the individual normalized power maps of the eight subjects for baseline and recovery sleep for three frequency bands. Particular frequency-specific patterns are evident. The delta and alpha bands show typically a frontal maximum and bilateral minima over the parietal region. In the sigma band, the maximum is situated over the vertex, while the minimum shows a ring-shaped or bilateral distribution. A striking feature is the high degree of similarity of maps from the same subject within a frequency band. The patterns appear almost identical, and particular features such as a small secondary occipital maximum in the delta band (subjects # 3, 4, 5) and alpha band (subjects # 2, 3, 5, 8) are present in both records. Also the exceptional distribution of delta power in subject # 6 with the maximum over the central region occurs in both nights. In the sigma band, the round or elongated shape of the maximum and the distribution of the minimum are highly invariant individual features.
Figure 1
Normalized power maps of eight subjects for baseline sleep (left column of pairs) and recovery sleep (right column) for the delta, alpha and sigma band. Maps are based on 27 EEG derivations (average reference; extended 10–20 system, electrode position indicated by dots; see Methods). Each map was proportionally scaled (see Methods). Values are color coded and plotted at the corresponding position on the planar projection of a hemispheric scalp model. Values between electrodes were interpolated. The scaling differs between subjects, but within individuals, the maps are equally scaled for baseline and recovery nights. Maxima (max) are in the range of 1.43–1.88 (delta), 1.41–1.75 (alpha) and 1.42–2.71 (sigma); minima (min) are in the range of 0.427–0.649 (delta), 0.386–0.703 (alpha) and 0.535–0.71 (sigma).
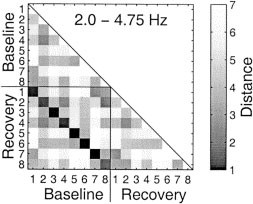
To quantify the degree of correspondence within and between individual maps, the Manhattan distance was calculated (see Methods). Figure 2 shows for the delta band a matrix representation of this distance measure for all combinations. A lighter shading of gray represents increasing distances. The darkest shadings are present along the line of squares corresponding to baseline-recovery pairs within individuals.
Figure 2
Comparison of individual maps in the delta band. Differences (Manhattan distances; see Methods) between all pairs of maps are plotted for baseline sleep and recovery sleep as a gray-scale coded matrix. Smallest distances were present within individuals (baseline vs. recovery). The numbers 1 to 8 denote individuals.
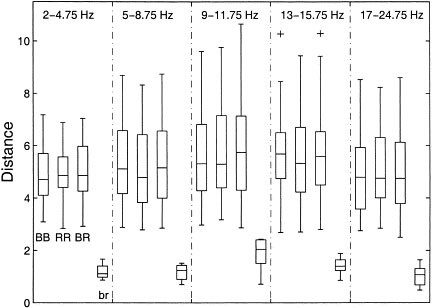
Figure 3 shows the distributions of the distances for all five frequency bands. In each panel, the first three rectangles represent the interindividual comparisons within baseline (BB), within recovery (RR) and between baseline and recovery (BR), while the fourth rectangle shows the comparison between baseline and recovery (br) within the same individuals. The latter exhibit invariably the lowest distance measures and their distributions do not overlap with those of non-corresponding individuals.
Figure 3
Distributions of differences (Manhattan distances) between individual power maps in five frequency bands as boxplots. Comparison of all pairs of individual maps in baseline sleep (BB; n = 28), in recovery sleep (RR; n = 28), between baseline and recovery sleep of different individuals (BR; n = 56), and between baseline and recovery sleep within individuals (br; n = 8). The boxes represent the lower quartile, median, and upper quartile. The whiskers extend from each end of the box for 1.5 times of the interquartile range. Outliers are indicated by +. The values of br were significantly below those of BB, RR and BR.
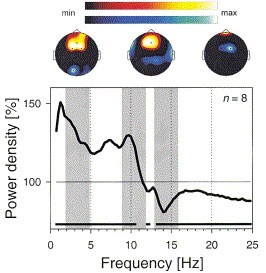
Sleep deprivation shortened sleep latency relative to baseline (4.0 ± 1.2 vs.12.0 ± 1.6 min; p < .01; Wilcoxon signed-rank test), and increased the amount of slow wave sleep (136.2 ± 8.6 vs. 90.4 ± 7.0 min; p < .01; for details see Finelli et al. 2000a). The effect of sleep deprivation on the nonREM sleep power spectrum is illustrated in Figure 4. Power in the recovery night was expressed as percentage of baseline for each 0.25-Hz bin. Power was significantly enhanced in the frequency range of 0.75–10.5 Hz and reduced in the ranges 12–12.25 Hz and 13.25–25 Hz. The maximal increase was seen in the low delta band and a secondary peak was present in the alpha band. The maximum decrease occurred in the sigma band representing spindle frequency activity.
Figure 4
Effect of sleep deprivation on nonREM sleep EEG power spectra. The curve represents power in recovery sleep plotted as percentage of power in baseline (100%). Mean values over eight individuals and 27 electrodes are plotted for 0.25-Hz bins. Lines above the abscissa indicate significant differences (p < .05; Wilcoxon signed rank test) between baseline sleep and recovery sleep. Shading indicates the three frequency bands illustrated in Figure 1. The maps on top represent _t_-maps of significant increases (upper scale) and decreases (lower scale) in relative power. The _t_-tests were performed on log transformed normalized power. _t_-values are color coded with a scale ranging from 2.31 (min; level for p = .05 with n = 8) to the maximum (max; increase: 4.32, delta; 4.88, alpha; 4.29, sigma; decrease: 6.92, delta; 5.53, alpha; 5.45, sigma) . Black areas in the _t_-maps indicate no significant difference.
The effect of sleep deprivation on EEG topography in three frequency bands is illustrated by the _t_-maps in Figure 4 (top). The maps compare log-transformed normalized power values of baseline and recovery at each electrode with a _t_-test. Normalization was obtained by expressing power at each electrode as percentage of the mean power calculated over all electrodes. Significant _t_-values are represented by the two color scales, which indicate a relative increase (upper scale), and relative decrease of power (lower scale).
The delta band showed a relative increase of power over the fronto-central region, and a relative decrease over the left occipital derivation. Since absolute power increased in all derivations from baseline to recovery sleep (min 126%; max 143%; Finelli et al. 2001), the _t_-map represents the largest and smallest increase.
Normalized alpha power showed an increase at frontal sites (corresponding to the largest absolute power increase), and a decrease bilaterally at fronto-temporal sites and at fronto-central sites (corresponding to the smallest absolute power increase).
In the sigma band a decrease (corresponding to the largest relative and absolute power decrease) occurred over a small, demarcated central area, and an increase over a small frontal area (corresponding to a small absolute power decrease).
DISCUSSION
The principal result of this study is the large correspondence of individual normalized power maps obtained in two nights. As illustrated in Figure 1 even minor features of individual patterns were preserved between two nights. When we first obtained these striking results we felt compelled to ascertain that the records were indeed obtained on two different nights. The high degree of resemblance was confirmed by using a distance measure. Nevertheless, subtle differences between baseline and recovery sleep were evident and on average, sleep deprivation caused significant frequency specific localized changes in EEG topography (Figure 4, _t_-maps).
Previous studies of individual characteristics have focused on the waking EEG. A high test-retest correlation was obtained for EEG power (Gasser et al. 1985; Stassen et al. 1987), whereas considerable variations were present between individuals. Individual test-retest reliability was found to be variable for spatio-temporal parameters of the waking EEG (Burgess and Gruzelier 1993).
The question of heritability of EEG parameters was at the center of several studies. It was noted that the test-retest stability of power in the waking EEG of individuals was comparable to values of monozygotic twins (MZ) (van Beijsterveldt et al. 1996; Stassen et al. 1999). However, EEG topography was not examined. van Beijsterveldt et al. (1996) investigated the power in MZ and dizygotic twins (DZ) at various brain sites and concluded that the heritability showed little regional differences.
The highly invariant individual patterns in sleep EEG topography may be related to brain anatomy. A remarkable interindividual variability in anatomical features of the human cerebral cortex is well documented and has been identified as a major problem for establishing a relationship between structural and functional aspects (Roland et al. 1997; Zilles et al. 1997). This difficulty is compounded by the lack of correspondence between gross morphology and microstructure. Therefore it has been proposed that microstructural criteria should be used to define a space for comparing individual brains (Roland and Zilles 1994). Interindividual variability in hemispheric shape has been recently quantified on the basis of magnetic resonance imaging (MRI) and 3-D reconstructions (Zilles et al. 2001). Regional differences in variability were identified. The extent of cortical activation in a discrimination task was shown to vary among subjects (Roland and Zilles 1998). In a morphometric analysis of MRI scans it was shown that the size of brain structures is more correlated between MZ than DZ (Pennington et al. 2000). Differences in genetically determined anatomical features could account for the findings in the present study. A study of the sleep EEG in MZ and DZ would provide data to test this assumption.
Prolonged waking is known to affect the nonREM sleep EEG in recovery sleep by enhancing low-frequency components and suppressing power in the spindle frequency range (Borbély et al. 1981; Dijk et al. 1990). These typical changes occurred also in the present study. Power in the low delta band was increased to 150% of baseline while spindle frequency activity in the 14–14.25 Hz range was reduced to 81% (Figure 4). It was interesting that despite these massive changes in absolute power, the distribution of relative power was little affected. Therefore the individual features of brain EEG topography seem to be related to the individual structural peculiarities of the brain or to their relationship to the skull rather than to the homeostatic mechanisms of sleep regulation that are challenged by prolonged waking. Nevertheless, sleep propensity did not affect all EEG derivations uniformly and regional differences were seen (this aspect is the subject of a separate communication; Finelli et al. 2001). In particular, the largest increase in power was seen over the anterior part of the cortex. It had been shown in a previous study that 2-Hz power exhibits a frontal predominance in the first part of sleep (Werth et al. 1996, 1997). A similar finding was obtained during recovery sleep from partial sleep deprivation during three consecutive nights (Werth et al. 1998) and from total sleep deprivation (Cajochen et al. 1999).
In summary, the present study demonstrated for the first time highly stable, frequency-specific individual patterns of EEG power distribution in nonREM sleep. These patterns may reflect individual peculiarities of brain morphology, which are known to be determined by genetic factors. The present approach constitutes further evidence for the usefulness of closely examining individuals and exploiting interindividual differences rather than restricting the analysis to common features.
References
- Benington JH, Heller HC . (1995): Restoration of brain energy metabolism as the function of sleep. Prog Neurobiol 45: 347–360
Article CAS Google Scholar - Borbély AA, Achermann P . (2000): Sleep homeostasis and models of sleep regulation. In Kryger MH, Roth T, Dement WC (eds), Principles and practice of sleep medicine, 3rd Edition. Philadelphia, W.B. Saunders Co, pp 377–390
Google Scholar - Borbély AA, Baumann F, Brandeis D, Strauch I, Lehmann D . (1981): Sleep deprivation: effect on sleep stages and EEG power density in man. Electroencephalogr Clin Neurophysiol 51: 483–493
Article Google Scholar - Buchsbaum MS, Mendelson WB, Duncan WC, Coppola R, Kelsoe J, Gillin JC . (1982): Topographic cortical mapping of EEG sleep stages during daytime naps in normal subjects. Sleep 5: 248–255
Article CAS Google Scholar - Burgess A, Gruzelier J . (1993): Individual reliability of amplitude distribution in topographical mapping of EEG. Electroencephalogr Clin Neurophysiol 86: 219–223
Article CAS Google Scholar - Cajochen C, Foy R, Dijk DJ . (1999): Frontal predominance of a relative increase in sleep delta and theta EEG activity after sleep loss in humans. Sleep Res Online 2: 65–69
CAS PubMed Google Scholar - Dijk DJ, Brunner DP, Borbély AA . (1990): Time course of EEG power density during long sleep in humans. Am J Physiol 258: R650–R661
CAS PubMed Google Scholar - Findji F, Catani P, Liard C . (1981): Topographical distribution of delta rhythms during sleep: evolution with age. Electroencephalogr Clin Neurophysiol 51: 659–665
Article CAS Google Scholar - Finelli LA, Borbély AA, Achermann P . (2001): Functional topography of the human nonREM sleep electroencephalogram. Eur J Neurosci 13: 2282–2290
Article CAS Google Scholar - Finelli LA, Baumann H, Borbély AA, Achermann P . (2000a): Dual electroencephalogram markers of human sleep homeostasis: correlation between theta activity in waking and slow-wave activity in sleep. Neuroscience 101: 523–529
Article CAS Google Scholar - Finelli LA, Landolt HP, Buck A, Roth C, Berthold T, Borbély AA, Achermann P . (2000b): Functional neuroanatomy of human sleep states after zolpidem and placebo: a H215O-PET study. J Sleep Res 9: 161–173
Article CAS Google Scholar - Gasser T, Bacher P, Steinberg H . (1985): Test-retest reliability of spectral parameters of the EEG. Electroencephalogr Clin Neurophysiol 60: 312–319
Article CAS Google Scholar - Hori T . (1985): Spatiotemporal changes of EEG activity during waking-sleeping transition period. Int J Neurosci 27: 101–114
Article CAS Google Scholar - Horne JA . (1993): Human sleep, sleep loss and behaviour. Implications for the prefrontal cortex and psychiatric disorder. Br J Psychiatry 162: 413–419
Article CAS Google Scholar - Kattler H, Dijk DJ, Borbély AA . (1994): Effect of unilateral somatosensory stimulation prior to sleep on the sleep EEG in humans. J Sleep Res 3: 159–164
Article CAS Google Scholar - Krueger JM, Obál F Jr . (1993): A neuronal group theory of sleep function. J Sleep Res 2: 63–69
Article CAS Google Scholar - Maquet P . (2000): Functional neuroimaging of normal human sleep by positron emission tomography. J Sleep Res 9: 207–231
Article CAS Google Scholar - Pennington BF, Filipek PA, Lefly D, Chhabildas N, Kennedy DN, Simon JH, Filley CM, Galaburda A, DeFries JC . (2000): A twin MRI study of size variations in human brain. J Cogn Neurosci 12: 223–232
Article CAS Google Scholar - Rechtschaffen A, Kales A . (eds) (1968): A Manual of Standardized Terminology, Techniques and Scoring System for Sleep Stages of Human Subjects. Bethesda, Maryland: National Institutes of Health, U.S. Government Printing Office
- Roland PE, Zilles K . (1994): Brain atlases—a new research tool. Trends Neurosci 17: 458–467
Article CAS Google Scholar - Roland PE, Zilles K . (1998): Structural divisions and functional fields in the human cerebral cortex. Brain Res Brain Res Rev 26: 87–105
Article CAS Google Scholar - Roland PE, Geyer S, Amunts K, Schormann T, Schleicher A, Malikovic A, Zilles K . (1997): Cytoarchitectural maps of the human brain in standard anatomical space. Hum Brain Mapping 5: 222–227
Article CAS Google Scholar - Stassen HH, Bomben G, Propping P . (1987): Genetic aspects of the EEG: an investigation into the within-pair similarity of monozygotic and dizygotic twins with a new method of analysis. Electroencephalogr Clin Neurophysiol 66: 489–501
Article CAS Google Scholar - Stassen HH, Coppola R, Gottesman II, Torrey EF, Kuny S, Rickler KC, Hell D . (1999): EEG differences in monozygotic twins discordant and concordant for schizophrenia. Psychophysiology 36: 109–117
Article CAS Google Scholar - Thomas M, Balkin T, Sing H, Wesensten N, Belenky G . (1998): PET imaging studies of sleep deprivation and sleep: implications for behavior and sleep function. J Sleep Res 7(Suppl. 2):274
Google Scholar - Thomas M, Sing H, Belenky G, Holcomb H, Mayberg H, Dannals R, Wagner H, Thorne D, Popp K, Rowland L, Welsh A, Balwinski S, Redmond D . (2000): Neural basis of alertness and cognitive performance impairments during sleepiness. I. Effects of 24 h of sleep deprivation on waking human regional brain activity. J Sleep Res 9: 335–352
- van Beijsterveldt CE, Molenaar PC, de Geus EJ, Boomsma DI . (1996): Heritability of human brain functioning as assessed by electroencephalography. Am J Hum Genet 58: 562–573
CAS PubMed PubMed Central Google Scholar - Werth E, Achermann P, Borbély AA . (1996): Brain topography of the human sleep EEG: antero-posterior shifts of spectral power. NeuroReport 8: 123–127
Article CAS Google Scholar - Werth E, Achermann P, Borbély AA . (1997): Fronto-occipital EEG power gradients in human sleep. J Sleep Res 6: 102–112
Article CAS Google Scholar - Werth E, Achermann P, Borbély AA . (1998): Regional differences in the sleep EEG: Functional implications. Sleep 21(Suppl.):207
Article Google Scholar - Zilles K, Kawashima R, Dabringhaus A, Fukuda H, Schormann T . (2001): Hemispheric shape of european and japanese brains: H 3-D MRI analysis of intersubject variability, ethnical, and gender differences. Neuroimage 13: 262–271
Article CAS Google Scholar - Zilles K, Schleicher A, Langemann C, Amunts K, Morosan P, Palomero-Gallagher N, Schormann T, Mohlberg H, Burgel U, Steinmetz H, Schlaug G, Roland PE . (1997): Quantitative analysis of sulci in the human cerebral cortex: Development, regional heterogeneity, gender difference, asymmetry, intersubject variability and cortical architecture. Hum Brain Mapping 5: 218–221
Article CAS Google Scholar
Acknowledgements
We thank Harald Baumann for his help with the experiment, Drs. Thomas Graf, Hans-Peter Landolt and Irene Tobler for comments on the manuscript. The study was supported by the Swiss National Science Foundation grant 3100-053005.97 and the Human Frontiers Science Program grant RG-0131/2000.
Author information
Authors and Affiliations
- Institute of Pharmacology and Toxicology University of Zürich, Zürich, CH-8057, Switzerland
Luca A Finelli Ph.D, Peter Achermann Ph.D & Alexander A Borbély MD
Authors
- Luca A Finelli Ph.D
- Peter Achermann Ph.D
- Alexander A Borbély MD
Corresponding author
Correspondence toAlexander A Borbély MD.
Rights and permissions
About this article
Cite this article
Finelli, L., Achermann, P. & Borbély, A. Individual ‘Fingerprints’ in Human Sleep EEG Topography.Neuropsychopharmacol 25 (Suppl 1), S57–S62 (2001). https://doi.org/10.1016/S0893-133X(01)00320-7
- Issue Date: 01 November 2001
- DOI: https://doi.org/10.1016/S0893-133X(01)00320-7


