Microglia convert aggregated amyloid-β into neurotoxic forms through the shedding of microvesicles (original) (raw)
Main
Alzheimer’s disease (AD) is the major cause of dementia in humans. Neuronal loss and cognitive decline occurring in AD patients are traditionally linked to the accumulation in the brain of extracellular plaques consisting of short amyloid-β (A_β_) peptides of 39–42 amino acids, generated by amyloidogenic cleavage of the amyloid precursor protein.1 Among A_β_ peptides, A_β_ 1–42 and pyroglutamate-modified A_β_ very rapidly aggregate and initiate the complex multistep process that leads to mature fibrils and plaque.2, 3
Although association of amyloid plaques with AD has long been assumed, A_β_ load does not correlate with neuronal loss4, 5 and high plaque burden does not necessarily lead to dementia in humans.6, 7 Accordingly, recent evidence clearly showed that the amyloid load reaches a plateau early after the onset of clinical symptoms in AD patients8 and does not substantially increase in size during clinical progression.9 These observations agree with the current view that small, soluble pre-fibrillar A_β_ species, rather than plaques formed by insoluble A_β_ fibrils, are the most toxic forms of A_β.10 These cause synaptic dysfunction and spine loss, and correlate most closely with the severity of human AD.5, 8, 11 Recent biochemical studies indicated that natural sphingolipids and gangliosides, whose metabolism has been shown to be altered in AD patients,12 destabilize and rapidly resolubilize long A_β fibrils to neurotoxic species.13 These studies also showed that phospholipids stabilize toxic oligomers from monomeric peptides.14
The toxicity of small soluble A_β_ species has been proposed to depend on the interaction with specific neuronal proteins, such as the NMDA receptor15 or the prion protein (PrPC),16 which modulates NMDA receptors through Fyn kinase.17 Alternatively, soluble A_β_ oligomers may damage neurons by binding to multiple membrane components, including lipids, thereby changing membrane permeability and causing calcium ion leakage into the cell.5, 18
Neuroinflammation arguably has a role in promoting neurotoxicity of A_β_ plaques. This is suggested by several lines of evidence: (i) subjects with high plaque burden without dementia show virtually no evidence of neuroinflammation;6 (ii) recent PET studies19, 20 showed an inverse correlation between the cognitive status and activation of microglia, the immune cells of the nervous system, in AD patients; (iii) activation of microglia increases linearly throughout the disease course and correlates with AD neurodegeneration.8 Moreover, recent studies demonstrating that variants of TREM2 and CD33, two receptors expressed in microglial cells, increase the risk for late-onset AD21, 22 have refocused the spotlight on microglia as a major contributing factor in AD. Although multiple preclinical evidence indicates that microglia activation promotes neuronal dysfunction and neuron elimination23, 24 and accelerates AD progression,19, 25, 26 the molecular mechanisms by which microglia exert neurotoxicity remain largely unknown.
We have recently described a novel mechanism of cell-to-cell communication in the brain, by which reactive microglia propagate an inflammatory signal through the release of extracellular membrane microvesicles (EMVs), which bud from the cell surface, called shed microvesicles (MVs) or ectosomes. MVs are shed by microglia upon ATP activation27 and originate from lipid rafts,28 where the ATP receptor P2X7 is localized.29 Shed MVs selectively accumulate various cellular components, including soluble and integral proteins, lipids and nucleic acids and their composition reflects the activation state of donor microglia. Notably, microglia-derived MVs in the cerebrospinal fluid (CSF) have been recently identified as a novel biomarker of brain inflammation in humans.30, 31
The observation that typical proteins of EMVs, like flotilin, accumulate in the plaques of AD brain,32 together with evidence that activated microglia constantly surround amyloid deposits,33 prompted us to investigate whether EMVs may be involved in the spatiotemporal propagation of A_β_ pathology through the brain. Here we show that production of MVs is extremely high in patients with AD and that microglial MVs, either shed in vitro or isolated from the CSF of AD patients, promote generation of soluble neurotoxic A_β_ species, thereby acting as potent drivers of neuronal damage.
Results
The combination of A_β_ 1–42 and microglia-derived MVs is neurotoxic in vitro
The evidence that natural lipids may shift the equilibrium between insoluble and soluble A_β_ toward highly toxic soluble species13, 34 prompted us to test whether MVs shed from microglial cells may promote A_β_ neurotoxicity. A_β_ 1–42 (4 μ_M) dissolved in dimethyl sulfoxide (DMSO) was incubated overnight with MVs derived from rat primary microglia (1 μ_g/100 μ_l) at 37 °C in neuronal medium and subsequently exposed to cultured hippocampal neurons for 1 h. Overnight pre-incubation of A_β 1–42 with MVs yielded a neurotoxic mixture that significantly increased the percentage of dead neurons, as assessed 24 h later by propidium iodide (PI) and calcein staining (Figures 1a and b; number of experiments=4). Notably, neither MVs alone nor MVs incubated overnight with scrambled A_β 1–42 significantly affected neuronal survival (Figure 1b). A_β 1–42 alone, dissolved in DMSO and incubated overnight at 37 °C in neuronal medium in the absence of MVs, from now on called aggregated A_β_ 1–42 barely affected neuronal viability, even when supplemented with MVs just before neuron challenge (acutely added MVs, AA-MVs- Figure 1b). Collectively, these findings indicate that overnight pre-incubation of aggregated A_β_ 1–42 with MVs is required for the development of neurotoxicity. A_β_ 1–42 pre-incubated with MVs induced cell death very rapidly. One hour after exposure to A_β_ 1–42 pre-incubated with MVs, about 15–30% of neurons loaded with the calcium dye Fura-2 displayed an abnormally high level of cytosolic calcium (Figures 1b and c; _n_=10) and were positive for the early apoptotic marker annexin-V (Figure 1e; n_=6). MVs alone, pre-incubated overnight in neuronal medium, also induced a slight increase in intracellular calcium concentrations (Figure 1d). Immunofluorescence analysis with the neuronal marker β_-3 tubulin and the pre- and post-synaptic markers V-Glut-1 and PSD-95 revealed that processes of neurons treated with combined A_β 1–42 and MVs were fragmented and showed reduced synaptic density (Figures 1f and g). Dendrite damage was associated to a marked decrease of MAP-2 immunoreactivity (Figure 3f). The toxic effect of A_β 1–42 in combination with MVs was largely prevented when neurons were exposed to the mixture in the presence of the glutamate receptors antagonists APV (100 _μ_M) and CNQX (20 _μ_M), as evaluated by quantification of cytoplasmic calcium (_n_=4), annexin-V (_n_=2) or PI/calcein (_n_=2) staining (Figures 1h–j). This suggests excitotoxic damage as the cause of neuronal death.
Figure 1
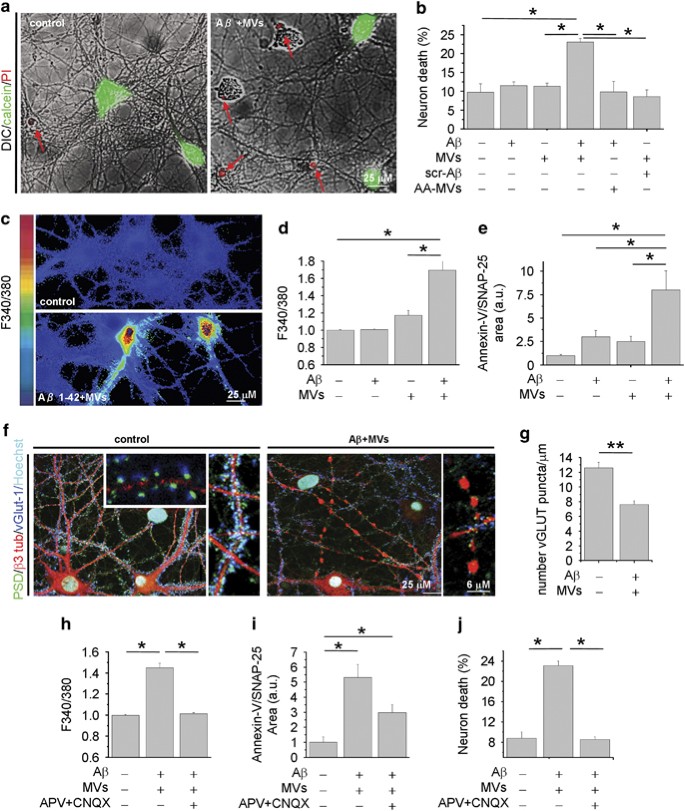
Microglia-derived MVs promote A_β_ neurotoxicity. Fourteen DIV hippocampal neurons were exposed for 1 h to A_β_ 1–42 or scrambled A_β_ 1–42 (4 μ_M) pre-incubated with MVs (1 μ_g/100 μ_l) overnight in neuronal medium. (a) Overlays of DIC and fluorescence microscopic images of neurons stained for calcein and propidium iodide (PI), after 24 h exposure to A_β 1–42/MVs mixture or under control conditions. (b) Percentage of calcein−/PI+ neurons (dead cells) in cultures exposed to A_β 1–42, scrambled A_β 1–42, MVs or A_β_ 1–42/scrambled A_β_ 1–42 incubated overnight with MVs. AA-MVs refer to freshly isolated MVs added to A_β_ 1–42, just before neuron challenge (the Kruskal–Wallis ANOVA, P<0.001; Dunn’s test for comparison among groups, *P<0.05). (c) Basal [Ca2+]i was measured in single neurons loaded with the ratiometric calcium dye Fura-2 and expressed as F340/380 fluorescence. Representative pseudocolor images of 9DIV control neurons and neurons treated with A_β_1–42/MVs mixture for 1 h. The color scale is shown on the left. (d) Quantification of basal [Ca2+]i in neurons exposed to A_β_ 1–42, MVs or A_β_ 1–42 in combination with MVs. At least 100 neurons/condition were examined. Values are normalized to control (the Kruskal–Wallis ANOVA, _P_=0.002; Dunn’s test for comparison among groups, *P<0.05). (e) Quantification of early apoptotic damage, revealed by Annexin-V binding, normalized to SNAP-25 immunoreactive area, in neurons treated as in d. (the Kruskal–Wallis ANOVA, P_=0.001; Dunn’s test for comparison among groups, *P<0.05). (f) Confocal microscopic images of 14DIV neurons untreated or pretreated with A_β 1–42 in combination with MVs and stained for β_-3 tubulin, the vesicular glutamate transporter vGlut-1 and the postsynaptic marker PSD-95. Nuclei are stained with Hoechst. Note, fragmentation of neuronal processes and loss of excitatory synapses in neurons exposed to A_β 1–42/ MVs mixture. Density of excitatory synaptic puncta is quantified in g (data follow normal distribution, Student’s t_–test, **P<0.001). (h–j) Control cultures and cells treated with A_β 1–42/MVs mixture analyzed for basal [Ca2+]i (h, the Kruskal–Wallis ANOVA, _P_=0.001; Dunn’s test for comparison among groups, *P<0.05), early apoptotic damage (i, the Kruskal–Wallis ANOVA, _P_=0.001; Dunn’s test for comparison among groups, *P<0.05) and calcein/PI staining (j, the Kruskal–Wallis ANOVA P<0.001; Dunn’s test for comparison among groups, *P<0.05), either in the presence or in the absence of the glutamate receptor antagonists APV and CNQX
Shed MVs promote formation of soluble forms of A_β_ 1–42
A_β_ 1–42 pre-incubated overnight with MVs was partitioned into two phases by centrifugation for 30 min at 10 000 × g. The neurotoxicity of the two fractions was analyzed by monitoring cytosolic calcium in cultured neurons. Whereas the supernatant retained a high degree of toxicity, the pellet was largely inert (Figure 2a left; _n_=3). Similar results were obtained by quantification of dead neurons by PI/calcein assay (Figure 2a right; n_=3). This suggested that soluble molecules, not associated to MVs, either generated from A_β 1–42 synthetic peptides or deriving from MVs were mainly responsible for toxicity.
Figure 2
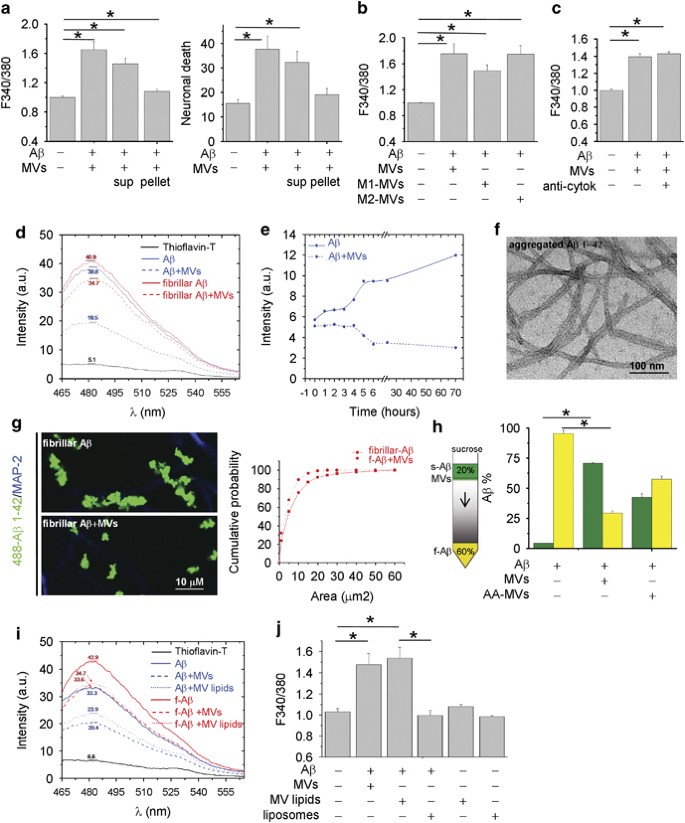
Shed MVs promote formation of soluble forms of A_β_ 1–42. (a) Basal [Ca2+]i in neurons exposed for 1 h either to A_β_ 1–42/MVs mixture or soluble (sup)/insoluble (pellet) fractions (left panel, the Kruskal–Wallis ANOVA, P<0.001; Dunn’s test for comparison among groups, *P<0.05). Values are normalized to control. Right panel shows the percentage of calcein−/PI+ neurons under the same conditions (the Kruskal–Wallis ANOVA, P_=0.002; Dunn’s test for comparison among groups, *P<0.05). (b) Basal [Ca2+]i in neurons exposed for 1 h to MVs derived from resting, M1 or M2 microglia pre-incubated with extracellular A_β 1–42. Values are normalized to control (the Kruskal–Wallis ANOVA, P<0.001; Dunn’s test for comparison among groups, *P<0.05). (c) Basal [Ca2+]i in neurons exposed to A_β_ 1–42 and/or MVs in the presence or in the absence of neutralizing antibodies for IL-1_β_ and TNF_α_. Values are normalized to control. (d) Representative ThT fluorescence emission spectra of samples containing A_β_1–42 fibrils (dashed red lines) or aggregated A_β_ 1–42 (dashed blue lines) exposed to MVs. (e) Time course of fibrilization of A_β_ 1–42 in the presence (dashed line) or in the absence (solid line) of MVs. (f) Negative staining electron microscopic image of aggregated A_β_ 1–42, incubated overnight in neuronal medium. (g) Representative confocal images of Hylite-488-A_β_ 1–42 (488-A_β_ 1–42) fibrils untreated or treated overnight with MVs and exposed for 1 h to neurons. Neurons are stained in blue for MAP-2 after fixation. Cumulative distribution of fibril size from control (solid line) and MV-treated (dashed line) 488-A_β_ 1–42 fibril preparations is shown on the right. (h) ‘Floating assay’ by ultracentrifugation reveals an increase of soluble A_β_ 1–42 species in association with MVs. After centrifugation for 1 h at 100 000 × g, MVs are expected in the top fraction, whereas A_β_ 1–42 aggregates are expected in the pellet. As ELISA indicates, a higher fraction of A_β_ 1–42 species is transported from the bottom to the top of the gradient in samples incubated overnight with MVs. Acute addition of MVs (AA-MVs) does not cause statistically significant changes in A_β_ 1–42 distribution (the Kruskal–Wallis ANOVA, P<0.001; Tukey’s test for comparison among groups, *P<0.05). (i) ThT fluorescence emission spectra of aggregated A_β_ 1–42 (blue lines) or A_β_ 1–42 fibrils (red lines), untreated (solid lines) or pretreated (dashed lines) with shed MVs. Spectra of aggregated A_β_ 1–42 or A_β_ 1–42 fibrils exposed to MVs lipids (dotted lines) are also shown. (j) Basal [Ca2+]i of neurons exposed for 1 h to A_β_ 1–42 pretreated with intact MVs, small unilamellar vesicles of MV lipids (MV lipids) or artificial liposomes. Note that vesicles made by lipids extracted from shed MVs but not artificial liposomes significantly enhance basal [Ca2+]i
The inflammatory mediators IL-1_β_ and TNF_α_ are among the molecules contained in microglial MVs that, through potentiation of NMDA channel activity, may induce excitoxicity.27, 35 As IL-1_β_ and TNF_α_ expression is upregulated in M1 proinflammatory microglia, and downregulated in M2 anti-inflammatory cells, we analyzed neuron viability after exposure to A_β_ 1–42 incubated with MVs produced by either LPS-primed M1 microglia or M2 cells, polarized with IL-4. Similar alterations of cytoplasmic calcium were observed in neurons exposed to A_β_ 1–42 in combination with MVs derived from M1 or M2 microglia (Figure 2b; n_=3) or exposed to the neurotoxic mixture in the presence of IL-1_β- and TNF_α_-neutralizing antibodies (Figure 2c; n_=4). These data rule out the possibility that excitotoxicity of A_β 1–42 in combination with MVs depends on cytokine leakage from MVs.
We then investigated whether neurotoxicity of A_β_ 1–42/MVs mixture could be due to the presence of neurotoxic soluble A_β_ forms. Negative staining electron microscopic analysis revealed the presence of both globular structures of diameter between 4 and 8 and 5–8 nm wide A_β_ fibrils in samples of aggregated A_β_ 1–42 incubated overnight with MVs. After fractionation into two phases by centrifugation, fibrils were retrieved in the pellet (Supplementary Figure S1A), whereas globular structures were mostly observed in the supernatant (Supplementary Figure S1B). Detection of globular species in the soluble fraction from A_β_ 1–42 and MVs mixture prompted us to investigate by an array of techniques whether shed MVs change the equilibrium between soluble and insoluble A_β_ 1–42.
Possible alterations in the content of aggregated A_β_ 1–42 were first monitored using a thioflavin-T (ThT) dye-binding assay. By this approach, we found that overnight pretreatment with shed MVs caused a 21.26±0.56% reduction in fibrillar A_β_ 1–42 (Figure 2d, red lines; n_=3) and a 38±6.3% reduction of aggregated A_β 1–42, dissolved in DMSO and incubated overnight at 37 °C in neuronal medium (Figure 2d, blue lines; n_=4). No changes in ThT spectra were detected upon acute MV addition, thus excluding possible interference of MV lipids with the ThT-binding site of A_β_1–42 (Supplementary Figure S2). Time course analysis of aggregated A_β 1–42 (Figure 2f) confirmed that shed MVs induce aggregate solubilization (Figure 2e). Consistent with these data, confocal microscopy using fluorescently labeled A_β_ 1–42 fibrils showed that MVs reduce fibril size (Figure 2g), as indicated by the shift of fluorescent fibrils toward smaller size in the cumulative distribution (Figure 2g, right n_=3). Altogether, these observations indicate that aggregated A_β 1–42 disassembles into soluble species upon MV exposure.
To prove the capability of shed MVs to promote formation of soluble species, soluble amyloid forms generated in A_β_ 1–42/MVs mixture were separated from insoluble species by sucrose gradient centrifugation at 100 000 × g for 1 h13 and quantified by ELISA. While acute addition of MVs, immediately before ultracentrifugation on sucrose gradient, partially but not significantly promoted A_β_ 1–42 flotation (AA-MVs, Figure 2h), a marked redistribution of A_β_ 1–42 to the top of the gradient was detected upon overnight incubation with MVs (Figure 2h; _n_=3).
MV lipids promote extracellular formation of neurotoxic A_β_ 1–42 species
The next step was to investigate whether lipids were the active components of shed MVs, responsible for the dissolution of insoluble A_β_1–42 species. The ThT assay showed that the lipid fraction extracted from MVs reduced the amount of fibrillar (f-A_β_, red lines) or aggregated (A_β_, blue lines) A_β_1–42, similar to intact MVs (Figure 2i). Furthermore, assessment of neuron viability revealed a similar percentage of dying neurons, characterized by abnormally high calcium levels, in cultures exposed to A_β_ 1–42 in combination with intact MVs or their lipid component (MV lipids, Figure 2j, _n_=3). Notably, A_β_1–42 pre-incubated with synthetic liposomes, similar in size to MVs and mimicking the phospholipid composition of the plasma membrane (60% PC, 20% cholesterol, 10% SM and 10% PS) did not produce any increase in the basal calcium concentration (Figure 2j).
Binding of newly generated soluble A_β_ 1–42–488 to neurons is competed by PrPc
We next attempted to visualize soluble A_β_ 1–42 forms, generated in the presence of MVs, by imaging their binding to cultured neurons. We observed that culture exposure to 488-A_β_ 1–42/MVs mixture for 1 h produced a strong labeling of MAP-2-positive dendrites, which exceeded by almost fourfolds the staining produced by fluorescent A_β_ 1–42 alone (Figures 3a and b). 488-A_β_ 1–42 binding to dendrites was paralleled by a marked reduction of MAP-2 staining (Figure 3a), according to previous evidence.36 No preferential association of 488-A_β_1–42 with synapses was detected (data not shown). Fractionation of 488-A_β_ 1–42/MVs mixture into two phases by centrifugation showed that the fluorescent A_β_1–42 forms capable of binding to neurons were mainly recovered in the soluble fraction (Supplementary Figures S1C–E). Notably, A_β_ binding was specifically competed by the high-affinity oligomer-interacting protein PrPc16 and virtually abolished by the anti-A_β_ antibodies A11 and 6E10 (Figures 3a and b) Unlike the 89–230 truncated PrPC, both full-length folded PrPC and anti-A_β_ Abs neutralized the toxicity of A_β_1–42/MVs mixture, as revealed by calcium recording (Figure 3c; _n_=3) and PI/calcein staining (Figure 3d; _n_=3).
Figure 3
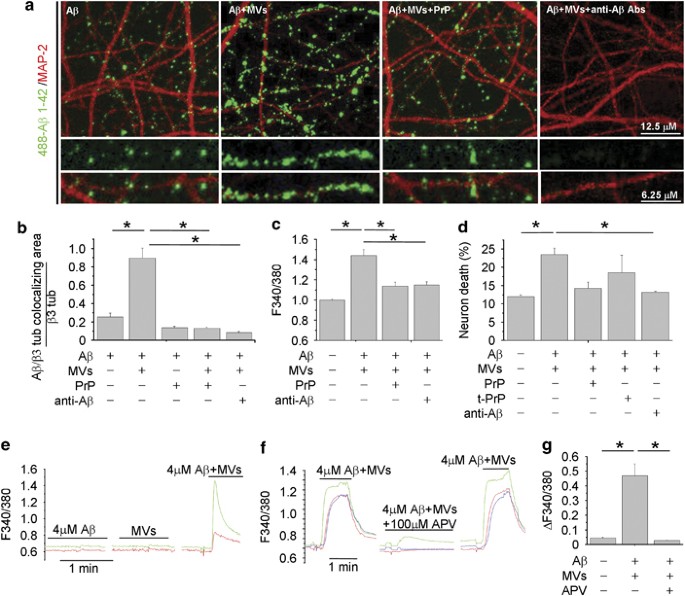
Binding of newly generated soluble 488-A_β_-1–42 to neurons is competed by PrPC. (a) Representative confocal images of 14DIV neurons exposed to 488-A_β_ 1–42 alone or in combination with MVs, with or without pretreatment with PrP or with the anti-A_β_ antibodies A11 and 6E10. (b) Corresponding quantification of 488-A_β_ 1–42 binding to cultured neurons expressed as colocalizing area between 488-A_β_ and β tubulin, relative to total β tubulin (see Materials and Methods) (the Kruskal–Wallis ANOVA, P<0.001; Dunn’s test comparison among groups, *P<0.05). (c and d) Basal [Ca2+]i (c) and percentage of calcein−/PI+ neurons (d) in 9–14 DIV cultures exposed to different combinations of A_β_ 1–42, MVs, A11 plus 6E10 antibodies, full-length or truncated (tPrPC) PrPC (the Kruskal–Wallis ANOVA, P<0.001; Dunn’s test for comparison among groups, *P<0.05). (e–g) Bio-detection of soluble A_β_ 1–42 by fura-2-loaded sensor neurons, expressing functional NMDA receptors. Representative traces of [Ca2+]i changes recorded in neurons upon exposure to KRH containing A_β_ 1–42 alone (4 _μ_M) or MVs alone (1 _μ_g/100 μ_l) or their combination (e). [Ca2+]i responses induced by A_β 1–42/MVs mixture are strongly inhibited by the NMDA receptor antagonist APV (f), as quantified in g. Values represent peak [Ca2+]i increases (ΔF340/380 fluorescence) from about 30 neurons/condition (the Kruskal–Wallis ANOVA, P<0.001; Dunn’s test for comparison among groups, *P<0.05)
Finally, as the soluble but not the fibrillar A_β_ forms activate NMDA receptors,37 we used a bioassay to assess the capability of A_β_ species generated in the presence of MVs to enhance NMDA receptor activity. FURA-2-loaded neurons, expressing functional NMDA receptors, were used as sensor cells for soluble A_β_ 1–42. By this approach, we detected calcium responses in about 30% of neurons exposed to A_β_ 1–42 in combination with MVs, but not A_β_ 1–42 or shed MVs alone (Figure 3e; n_=3). No calcium transients were observed upon neuron challenging with scrambled A_β 1–42 and MVs (data not shown). Calcium responses evoked by A_β_ 1–42 pretreated with MVs were inhibited by the NMDA receptor antagonist APV (100 μ_M) (Figures 3f and g; n_=3). Direct HPLC measurements of glutamate content in MVs or A_β 1–42/MVs preparations revealed concentrations lower than 1 μ_M, that is, the minimal concentration required to detect calcium influx in our system (mean glutamate concentration: 137±70 nM, MVs alone; 196±115 nM, A_β 1–42/MVs mixtures). These data exclude possible interference of ambient glutamate in the NMDA-dependent calcium response. Therefore, soluble A_β 1–42 species generated in the presence of shed MVs are able to activate NMDA calcium channels, triggering excitotoxicity.
MVs carry neurotoxic species generated from internalized A_β_ 1–42
As amyloid plaques are surrounded by activated microglia that actively phagocyte and degrade A_β_, we investigated whether MVs may contain toxic A_β_ species, generated from internalized peptides. Confocal analysis of microglia exposed to A_β_1–42 for 24–48 h, extensively washed and stained with 6E10 anti-A_β_ antibody, revealed intracellular A_β_ aggregates, which can reach the plasma membrane, stained by IB4 (Figure 4a). Notably, few A_β_ and IB4 double-positive particles were detected extracellularly in cell proximity (Figure 4a, bottom right panel), suggesting that EMVs derived from A_β_-loaded microglia may indeed contain A_β_ species. We explored this hypothesis by western blot analysis of EMVs collected from supernatant of microglia exposed to biotynilated A_β_1–42. Upon ATP stimulation for 30 min, a condition that mimics an inflammatory context and favors shedding of MVs (P2 and P3 fraction) versus exosome (P4 fraction) release,38 biotin-conjugated A_β_1–42 was recovered in shed MVs, labeled by Tsg101 (Figure 4b, bottom panel). Consistently, SELDI-TOF mass spectrometry using 6E10 and 4G8 anti-A_β_ antibodies revealed the presence of preloaded A_β_1–42 and of its cleavage product A_β_1–40, along with traces of other carboxy-terminally truncated isoforms, in MVs shed from the plasma membrane (P2+P3 fractions) (Figure 4c). Ten times less A_β_ was recovered in exosomes (P4 fraction) (Figure 4c), although A_β_1–42 species were clearly detectable in exosomes constitutively accumulated for 24 h in microglia supernatant (Supplementary Figure S3). In line with the presence of A_β_ species, MVs derived from microglia stimulated for 48 h with 4 μ_M A_β 1–42 (A_β_-MVs) were highly neurotoxic as compared with MVs derived from resting cells (Figure 4d, n_=4). MV neurotoxicity was significantly decreased by anti-A_β antibodies. These data indicate that microglia internalize and generate A_β_ neurotoxic species, which are delivered to neurons in association with MVs, possibly on MV external membrane.
Figure 4
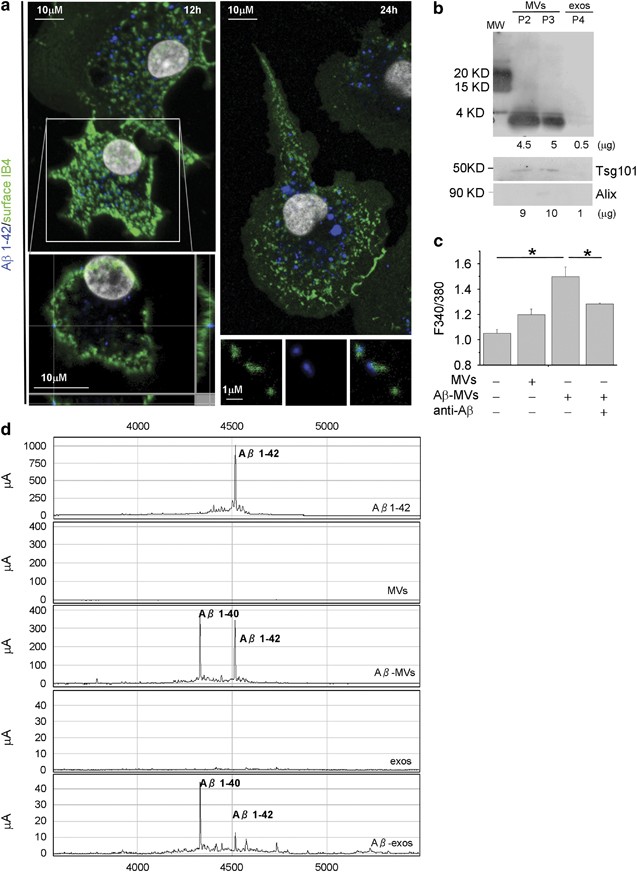
Soluble A_β_ forms are released in association with shed MVs from microglia activated with A_β_ 1–42. (a) Living rat microglia were exposed to human A_β_ 1–42 for 12–48 h and stained with IB4-FITC to label the cell surface before being fixed and counterstained with 6E10 antibody, which recognizes human but not rat amyloids. Top left panel shows representative xy plane maximum projection of microglia, revealing several 6E10 immunoreactive puncta inside the cells, some of which are double positive for surface IB4-FITC. Bottom left panel showing single stack of the selected cell, shown at higher magnification, reveals a clear association of internalized A_β_ 1–42 to the cell surface, further revealed by the z axis scan. Note, an increase in the size of internalized A_β_ 1–42 after incubation for 48 h (top right panel). Examples of EMVs, double positive for 6E10 and IB4-FITC are shown in bottom right panels. (b) Western blot analysis of A_β_ 1–42 species present in shed MVs (P2 and P3 fractions) and exosomes (P4 fraction) released upon 30 min ATP stimulation by 4 × 10⁶ microglia pre-exposed to biotinylated A_β_ 1–42 (4 μ_M). Blots were carried out using a 15% Tris-glycine gel and membranes were probed with streptavidin. Shed MVs and exosomes produced by 8 × 10⁶ donor microglia were probed in parallel for the EMV markers Tsg101 and the exosomal marker Alix (lower panels). Numbers below each lane indicate the estimated amount of loaded proteins. (c) Shed MVs and exosomes produced by 1 × 10⁶ rat microglia pre-exposed to human A_β 1–42 were analyzed by a SELDI-TOF MS immunoproteomic assay employing anti-human A_β_ antibodies (4G8 and 6E10) on PS20 chip array to capture A_β_ 1–42 and carboxy-terminally truncated A_β_ isoforms. The following representative spectra of samples in NP40 1% lysis buffer are shown (from top to bottom): 4 μ_M A_β_1–42 peptide incubated overnight in KRH; MVs from control microglia, not exposed to A_β_1–42; MVs from A_β_1–42 preloaded microglia (A_β_-MVs); exosomes from control microglia (exos); exosomes from A_β_1–42 preloaded microglia (A_β_-exos). (d) Basal [Ca2+]i recorded from neurons exposed to MVs produced from microglia either resting or pretreated for 48 h with A_β 1–42 (A_β_-MVs), in the presence or in the absence of anti-A_β_ antibodies (A11+6E10) (the Kruskal–Wallis ANOVA, P<0.001; Dunn’s test for comparison among groups, *P<0.05). See also Supplementary Figure S1
MVs from AD patients are neurotoxic
Recent results from our laboratories indicated that microglia-derived MVs are detectable in the CSF of humans and that their amount reflects the extent of microglia activation in the course of neuroinflammation.30 To verify whether production of MVs from microglia could be elevated in AD, we collected CSF from patients with mild cognitive impairment (MCI) or AD, as well as from age- and gender-matched healthy donors. Flow cytometry analysis showed strikingly higher levels of MVs positive for the myeloid marker IB4 (more than 10-fold) in MCI and AD patients than in control subjects (Figure 5a). IB4-positive MVs accounted for ∼65% of total EMVs detectable by flow cytometry. The number of IB4-positive MVs is correlated with a known CSF marker of neurodegeneration, namely, total Tau protein (Figure 5b; P<0.0001).39 We next examined the effects of MVs collected from AD patients on the equilibrium between soluble and insoluble A_β_ 1–42 species and assessed their toxic potential on cultured neurons. Confocal analysis of neurons exposed to 488-A_β_ 1–42 pre-incubated overnight with AD MVs revealed a threefold decrease in the content of fluorescent A_β_ aggregates (Figures 5c and d) and a parallel increase in fluorescent A_β_ species bound to dendrites (Figures 5c and e).
Figure 5
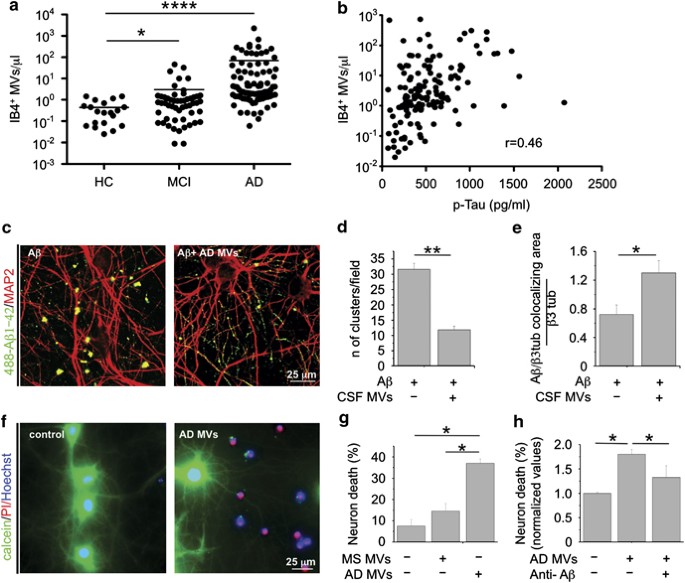
CSF MVs isolated from AD patients. (a) Quantitative flow cytometry analysis of IB4+ MVs in CSF collected from MCI patients (n_=53), AD patients (n_=89) and age- and gender-matched controls (HC; n_=20) (the Mann–Whitney test, P<0.0001 AD versus HC; P<0.0329 MCI versus HC). (b) Correlation between IB4+ MVs and total tau protein in the CSF of MCI and AD patients, (rho=0.46, P<0.0001, Spearman’s correlation). (c) Representative confocal images of cultured neurons, exposed to aggregated 488-A_β 1–42 untreated or pretreated overnight with MVs from AD patients and stained for MAP-2 after fixation (red). A_β species bind to MAP-2 dendrites. Note the decrease in the number of large fluorescent A_β clusters in neurons exposed to 488-A_β_ 1–42 in combination with AD MVs. (d) Quantification of 488-A_β_ 1–42 aggregates (larger than 5 μ_m) per field (data follow normal distribution, Student’s t_–test, **P<0.001). (e) Quantification of 488-A_β 1–42 binding to cultured neurons, expressed as colocalizing area between 488-A_β and β tubulin, relative to total β tubulin (see materials and Methods; data follow normal distribution, Student’s t_–test, **P<0.001). (f) Representative fluorescence microscopy images of 14DIV neurons triple stained for calcein, PI and Hoechst 24 h after exposure to AD MVs or maintained in control conditions. (g) Quantification of the percentage of calcein−/PI+ neurons (dead cells) in cultures exposed to AD MVs or MVs isolated from patients with multiple sclerosis (the Kruskal–Wallis ANOVA, P<0.001; Dunn’s test for comparison among groups, *P<0.05). (h) Percentage of dead neurons in cultures exposed to MVs isolated from the CSF of AD patients in the presence of anti-A_β antibodies A11 and 6E10 (ANOVA, P<0.001, the Holm–Sidak method, P<0.05). See also Supplementary Figure S2 and Supplementary Table S1
Consistently, with in vitro results showing that microglial MVs carry neurotoxic species generated from internalized A_β_ 1–42, MVs recovered from AD patients were highly toxic, as indicated by quantification of calcein−/PI+ dead neurons, as compared with MVs isolated from patients with multiple sclerosis (Figures 5f and g, n_=3). Neurotoxicity of AD MVs was significantly decreased by pretreatment with anti-A_β antibodies (Figure 5h). Interestingly, A_β_ 1–40, A_β_ 1–42 and other truncated A_β_ peptides were detected by SELDI-TOF mass spectrometry in CSF MVs of a patient affected by AD (Supplementary Figure S4).
Discussion
In the present study, we unveil a novel mechanism by which microglia contribute to neuronal damage in AD. We show that MVs, extracellularly released by cultured microglia, strongly increase A_β_ neurotoxicity in vitro. This effect is due to the lipid components of MVs, which promote formation of small soluble neurotoxic species from A_β_ 1–42 extracellular aggregates. Although A_β_ species can associate with MVs, as suggested by increased A_β_ flotation on sucrose gradient upon acute addition of MVs, most of neurotoxic soluble forms do not bind to MVs strongly. This is indicated by our observations that free soluble A_β_ 1–42 species, not associated with MVs, bind efficiently to a subpopulation of neurons in vitro, increase NMDA receptor permeability and cause an excitotoxic damage. Conversely, A_β_ 1–42 forms pelleted along with MVs from A_β_/MVs mixture display low toxicity and little neuronal-binding capacity. These data identify microglial MVs as an endogenous source of lipids able to shift the equilibrium toward toxic A_β_ species. This conclusion is in complete agreement with previous evidence that brain membrane lipids, including phosho- and (glycol)sphingolipids, favor formation of soluble forms, either promoting solubilization of inert fibrils,13 or hindering their conversion to insoluble fibrils.14 Interestingly, exosomes released by neurons have been found to promote rather than reduce A_β_ fibrillogenesis,40 thus indicating that lipid composition of different EMVs generated by distinct cell types may have opposite effects on A_β_ extracellular assembly. Notably, MVs have a distinct repertoire of lipids not only compared with exosomes (our unpublished data)41 but also to the plasma membrane of origin. Indeed, MVs are enriched in cholesterol, sphingomyelin and ceramide, and contain lipid raft elements,28 including GM1 and GM3 gangliosides and flotillin-2.42 Accordingly, artificial liposomes, composed of the main phospholipids of the plasma membrane, neither induce fibril solubilization nor promote A_β_ neurotoxicity. Lipidomic profiling of microglial MVs will identify endogenous lipids responsible for the generation of neurotoxic A_β_ species, which could themselves represent putative AD biomarkers.9, 43, 44
MV-mediated A_β_ processing, leading to neurotoxic forms does not occur only extracellularly. Indeed, microglial MVs also contain toxic forms generated from internalized A_β_ 1–42. It has been previously shown that a fraction of intracellular A_β_ can be released through exosomes by neurons and oligodendrocytes.32, 45, 46, 47 In addition, phagocytosed A_β_ has been found to be re-secreted from microglia, although through an undefined mechanism.48 We now show that microglia release neurotoxic A_β_ 1–42 and A_β_ 1–40 species in association with MVs. This is the first evidence that microglia – which control extracellular plaque load49, 50 by phagocytosis and degradation of A_β_ fibrils or macropinocytosis of soluble A_β_51, 52 – may seed and feed formation of neurotoxic amyloids throughout the brain. MV-mediated release of neurotoxic A_β_ forms likely occurs when intracellular pathways of A_β_ degradation are saturated and production of MVs becomes a way for microglia to eliminate undigested A_β_. Neurotoxic A_β_ species may be processed in early to late endosomes and lysosomes53 after disassembly of phagocytosed A_β_ and sorted to the external surface of MVs through association with the GPI-anchored protein PrPC or GM1 gangliosides, all of which are localized to raft domains42 and bind tightly A_β_ oligomers.54 Alternatively, neurotoxic A_β_ species may be generated at the cell surface,55 where components of the γ_-secretase complex, which can cleave the carboxyl terminal of A_β 1–42 at position 40 are also localized,53 possibly inside lipid rafts. This sorting mechanism may be consistent with the proposed role of lipid rafts in setting up platforms to concentrate into MVs proteins destined to secretion.28, 56 Finally, processing of A_β_ 1–42 to A_β_ 1–40 may even proceed within MVs. Indeed, previous evidence showed that neuron-derived EMVs contain some components of the γ_-secretase complex,57 whereas the insulin-degrading enzyme, which proteolyzes A_β 1–42 and A_β_ 1–40, has been detected among cargo proteins of microglial EMVs.58 The significant decrease in neurotoxicity observed upon pretreatment with anti-A_β_ antibodies strongly supports the theory that neurotoxic A_β_ forms are in fact localized to the outer lipid bilayer of MVs. However, further studies are required to unequivocally define the topology of A_β_ species and to clarify whether A_β_ forms are actually associated to the extracellular membrane of shed MVs.
Our findings have clear clinical implications. First, production of MVs is very high in MCI and AD patients, reflecting microgliosis,30 which typically characterizes the disease.8 Second, MVs collected from the CSF of AD patients promote extracellular formation of neurotoxic A_β_ species similar to MVs shed from cultured cells. Finally, MVs collected from AD patients are extremely toxic for cultured neurons and their neurotoxicity results, at least in part, from their A_β_ cargo. However, it is still to be defined whether MVs may associate with toxic forms of A_β_ present in the parenchyma/blood vessel as well as plaques during their travel to CSF. In agreement with their pathogenic role, levels of microglia-derived MVs are positively correlated with classical biomarkers of neuronal injury such as tau39 in MCI and AD subjects, and with damage to white matter structures of the temporal lobe in MCI patients, as revealed by MRI scans (Dalla Libera et al., manuscript in preparation). Correlation between microglia-derived MVs and brain damage suggests that MVs may represent a novel companion tool for AD diagnosis, and paves the way for future therapies targeting MVs to control the impact of neurotoxic A_β_ species on brain function. We anticipate that analysis of A_β_ content and lipidomic profiling of MVs in a large cohort of AD and healthy subjects will clarify whether changes in the conformation and/or in the amount of A_β_ forms account for MV neurotoxicity. Furthermore, lipidomic profiling of human MVs will lead to the identification of new putative AD biomarkers, thereby increasing the diagnostic potential of MVs in AD.
Materials and Methods
Glial cells and MVs isolation
Primary rat microglial cells were isolated from mixed cultures of cortical and hippocampal astrocytes, established from E21 rat embryos and maintained as described previously.27 All efforts were made to minimize animal suffering and to reduce the number of animals used in accordance with the European Communities Council Directive of September 20, 2010 (2010/63/UE). All procedures involving animals were performed according to the guidelines of the Institutional Animal Care and Use Committee of the University of Milan.
To induce MV shedding, microglia were exposed to ATP (1 mM) for 30 min in Krebs–Ringer solution (KRH). Shed MVs were pelletted from the supernatant at 10 000 × g for 30 min, whereas exosomes were pelleted at 100 000 × g for 1 h, as described previously.38 For biochemical fractionation of shed MVs, total lipids were extracted through the method previously described59 with 2 : 1 (by volume) of chloroform and methanol. The lipid fraction was evaporated under a nitrogen stream, dried and resuspended in PBS at 40 °C in order to obtain multilamellar vesicles. Small unilamellar vesicles were obtained by sonicating multilamellar vesicles.
A_β_ 1–42 preparations
Unless otherwise stated, A_β_ 1–42 (Anaspec, Fremont, CA, USA) was dissolved at a concentration of 2 mM in DMSO. The stock was kept at −80 °C, directly diluted to 4 μ_M in neuronal medium and kept overnight at 37 °C. We refer to this A_β 1–42 preparation as aggregated A_β_ 1–42, to distinguish it from fibrillar A_β_ 1–42 preparation, which is detailed below. To prepare soluble and fibrillar A_β_ 1–42, the peptide was initially monomerized by dissolving it in 100% hexafluoroisopropanol (Sigma, St. Louis, MO, USA) to obtain a 1-mM solution and then aliquoted in sterile microcentrifuge tubes. The hexafluoroisopropanol was removed under vacuum using a SpeedVac and the peptide film was stored (desiccated) at −80 °C. Soluble A_β_ 1–42 was prepared as described by Klein et al.60 Briefly, the peptide film was freshly resuspended in 100% DMSO to 5 mM, further diluted to 100 μ_M in F-12 medium (Invitrogen, Paisley PA4 9RF, UK) and incubated for 24 h at 5 °C. Following incubation it was centrifuged at 14 000 × g for 10 min at 4 °C and the soluble forms were collected in the supernatant. For fibrillar A_β 1–42 preparation, A_β_ 1–42 or Hylite-488-A_β_ 1–42 peptide film freshly resuspended in DMSO was further diluted to 100 _μ_M in 10 mM HCl.61 It was vortexed for 15 s and incubated for 24 h at 37 °C. After incubation, it was diluted to 4 _μ_M in neuronal medium.
The aggregation state of A_β_ 1–42 preparation was assessed by transmission electron microscopy with a Tecnai G2 T20 Twin microscope (FEI, Eindhoven The Netherlands).
ThT assay
A_β_ preparations, incubated or not with MVs, were diluted to 4 μ_M in KRH and incubated overnight at 37 °C. For ThT assays, ThT (Fisher Scientific, Waltham, MA, USA) was added to the A_β preparations and monitored in a Perkin-Elmer LS50 spectrofluorometer (Perkin-Elmer, Waltham, MA, USA). ThT fluorescence emission spectra were recorded between 465 and 565 nm with 5 nm slits, using an excitation wavelength of 450 nm. For the time course experiments, the samples were kept at 37 °C and aliquots of 100 _μ_l were removed from the sample at each time point. The aliquots were mixed with ThT to obtain a final concentration of 10 _μ_M and then their fluorescence spectra were acquired.
Neuronal cultures and in vitro stimulation
Primary cultures of hippocampal neurons were established from E18 rat pups as previously described,62 plated onto poly-L-lysine-treated coverslips at 500 cells/mm2 cell density and maintained in Neurobasal with 2% B27 supplement and 2 mM glutamine (neuronal medium). DIV hippocampal neurons (9–14) were exposed to A_β_ 1–42 (4 _μ_M), to MVs (1 μ_g/100 μ_l) or to a combination of A_β 1–42 and MVs for 1 h. A_β 1–42, MVs or their combination were kept overnight at 37 C° before being exposed to neurons. Neurons (1.7 × 10⁵) were exposed to MVs produced by 1 × 10⁶ microglia (microglia : neuron ratio, 6 : 1).
In a set of experiments, A_β_ 1–42/MVs mixtures were added with anti-TNF-α plus anti-IL-1_β_ antibodies (R&D, Minneapolis, MN, USA) or with the anti-A_β_ antibodies 6E10 (Covance, Emerville, CA, USA) plus A11 (Invitrogen, Life Technologies Ltd., Paisley, UK), or with the PrPC (4 _μ_M) for 30 min before being exposed to cultured neurons.
Cell viability assays
PI/calcein staining
Neuron viability was analyzed by simultaneous fluorescence staining of viable and dead cells with calcein-AM (0.5 mg/ml, Invitrogen, Life Technologies Ltd.), PI (1 _μ_g/ml, Molecular Probes, Life Technologies Ltd., Paisley, UK) and Hoechst (8.1 _μ_M, Molecular Probes, Life Technologies Ltd.). Incubation was performed for 20 min in neuronal medium at 37 °C and 5% C02. Calcein-AM emits green fluorescence signal in viable cells. Conversely, PI reaches nuclei of dead cells only where it emits red fluorescence. Fluorescence images were acquired by Leica DMI 4000B microscope (Leica Microsystem GmbH, Wetzlar, Germany), equipped with DIC microscopy. The percentage of neuronal death was calculated as the ratio of PI+calcein–dead cells to the total number of Hoechst stained neurons in at least 15 fields/condition.
Annexin-V assay
Living neurons were incubated with annexin-V-FITC (1 : 100, BD Pharmingen, Franklin Lakes, NJ, USA) for 5 min, fixed with 4% paraformaldehyde and counterstained for the neuronal marker SNAP-25 (mouse anti-SNAP-25, Sternberger Monoclonals, Baltimora, MD, USA) in nonpermeabilizing condition to preserve annexin-V staining. Fluorescence images were acquired by a SPE Leica confocal microscope, equipped with an ACS APO × 40/1.15 oil objective. Area of annexin-V+ apoptotic processes was quantified by Image J 1.46r software (NIH, Bethesda, MD, USA) and normalized to SNAP-25 immunoreactive area as an index of neurite density.
Monitoring of cytoplasmic calcium concentration
Hippocampal neurons were loaded with 2 _μ_M Fura-2/AM (Invitrogen, Life Technologies Ltd.) in neuronal medium for 40 min at 37 °C, washed in KRH and transferred to the recording chamber of an inverted microscope (Axiovert 100, Zeiss, Oberkochen, Germany) equipped with a calcium imaging unit. Polychrome V (TILL Photonics GmbH, Grafelting, Germany) was used as the light source. Images were collected with a CCD Imago-QE camera (TILL Photonics GmbH) and analyzed with TILLvisION 4.01 software. After excitation at 340 and 380 nm wavelengths, the emitted light was acquired at 505 nm at 1 Hz. Calcium concentration was expressed as F340/380 fluorescence ratio. The ratio values in selected region of interest corresponding to neuronal somata were calculated from sequences of images to obtain temporal analysis. Basal calcium concentration was recorded from at least 100 neurons/condition in each experiment.
Immunocytochemical staining
Immunofluorescence staining of fixed neurons was performed using the following antibodies: rabbit anti-beta tubulin (Sigma) guinea pig anti-vGLUT-1 (Synaptic System, Gottingen, Germany), mouse anti-PSD-95 (UC Davis/NIH NeuroMab Facility, Davis, CA, USA) and mouse anti-MAP-2 (Synaptic System). Secondary antibodies were conjugated with Alexa-488, Alexa-555 or Alexa-633 fluorophores (Invitrogen, Life Technologies Ltd.). For quantification of V-glut-1 puncta per length unit, the length of single neuritis was measured using Image J 1.46r software, and the number of positive puncta whose dimension was greater than 0.01 _μ_m was quantified.
Binding to neurons of Hylite-488-labeled A_β_ 1–42 (Anaspec) was quantified using Image J 1.46r software. Hylite-488-A_β_ 1–42 and β tubulin double-positive puncta were revealed by generating a Hylite-488-A_β_ 1–42/β tubulin double-positive image using the ‘and’ option of ‘image calculator’ function. A fixed threshold was then set in the double-positive image and, having selected the pixel area parameter at 3-infinite, total colocalizing area was quantified using the ‘analyze particle’ function. Total β tubulin fluorescence area was directly measured in β tubulin fluorescence images, after setting a fixed threshold using the ‘analyze particle’ function, as described above. Finally, total Hylite-488-A_β_ 1–42/β tubulin-colocalizing area was normalized to total β tubulin area in each field. β tubulin was revealed by Alexa-633 fluorophore to avoid significant interference of Hylite-488 in the red channel. Quantification of binding was normalized to β tubulin towing to the decrease in MAP-2 immunofluorescence staining upon A_β_ 1–42 binding.
Maximum projection of confocal stacks in the x_–_y plane and z axis scans were generated using Image J 1.46r software.
Confocal imaging and measurements of fluorescent fibrils
Hylite-488-A_β_ 1–42 fibrils (Anaspec) were prepared as described above, overnight exposed or not to MVs and incubated for 1 h with primary cultures of hippocampal neurons. Neurons were then fixed and stained for MAP-2. Fluorescence images of A_β_ 1–42 fibrils were acquired with a Leica SPE confocal microscope by an operator blinded to the study and analyzed using Image J 1.46r software. A fixed threshold was set on Hylite-488-A_β_ 1–42-positive images. After selecting the area parameter (_μ_m) at 0.1-infinite, the area of single fibrils was automatically measured using the ‘analyze particle’ function. The percentage of fibrils with increasing area values – at intervals of 5 _μ_m2 – was calculated and the cumulative distribution plot was constructed using OriginPro 8 software (Microcal INC., Claymont, DE, USA).
Western blotting
Lysates of shed MVs and exosomes were separated by electrophoresis, blotted on nitrocellulose membrane and revealed using streptavidin (1 : 1500, Sigma), rabbit anti-alix (1 : 1000, Covalab, Billerica, MA, USA) and mouse anti-Tsg101 (1 : 1000, Abcam, Cambridge, UK). Immunoreactive bands were detected using SuperSignal West Femto Pierce ECL (Thermo Fisher Scientific Inc., Rockford, IL, USA) and ECL film (Amersham, GE Healthcare Limited, Upsala, Sweden).
Endogenous glutamate determination
Endogenous glutamate content was measured by high-performance liquid chromatography analysis following pre-column derivatization with _o_-phthalaldehyde and discontinuous triphase gradient separation on a C18 reverse-phase chromatographic column (10 × 4.6 mm2, 3 _μ_m; at 30 °C; Chrompack, Middleburg, The Netherlands) coupled with fluorometric detection (excitation wavelength 350 nm; emission wavelength 450 nm). Homoserine was used as an internal standard.63
SELDI-TOF mass spectrometry
The immune-proteomic assay for A_β_ isoforms detection was performed as previously reported.64 Briefly, 3 _μ_l of the specific monoclonal antibodies (6E10+4G8) (Covance) at total mAbs concentration of 0.125 mg/ml (concentration of each mAb 0.0625 mg/ml) were incubated in a humidity chamber for 2 h at RT to allow covalent binding to the PS20 ProteinChip Array (Bio-Rad, Hercules, CA, USA). Unreacted sites were blocked with Tris-HCl 0.5 M, pH 8 in a humid chamber at RT for 30 min. Each spot was first washed three times with PBS containing 0.5% (v/v) TritonX-100 and then twice with PBS. The spots were coated with 5 _μ_l of sample and incubated in a humid chamber overnight. Each spot was first washed three times with PBS containing 0.1% (v/v) TritonX-100, twice with PBS and finally with deionized water. One microliter of _α_-cyano-4-hydroxy cinnamic acid (Bio-Rad) was added to coated spots. Mass identification was made using the ProteinChip SELDI System, Enterprise Edition (Bio-Rad).
ELISA quantification
Quantitative determination of A_β_ 1–42 was performed using innotest ELISA kit (Innogenetics, Gent, Belgium) according to the manufacturer’s procedures. Absorbance was detected by 1420 Multilabel Counter Victor 2 (Perkin-Elmer).
Human subjects
Human CSF samples were obtained for diagnostic purposes from subjects with MCI (_n_=53), definitive AD (_n_=89) according to the Dubois criteria and from age- and sex-matched (Supplementary Table S1) cognitively preserved and neurologically healthy subjects, undergoing spinal anesthesia for orthopedic surgery, serving as controls (_n_=20). Clinical features of AD and MCI patients are described in Supplementary Table S1. This research project was approved by the ethical committee of the San Raffaele Scientific Institute, and all subjects signed written informed consent.
Quantification and isolation of MVs from human CSF
Samples of CSF collected by lumbar puncture (200–300 _μ_l) were analyzed by flow cytometry, as described previously.30 Briefly, human CSF was stained with the myeloid marker IB4-FITC (Sigma). Labeled MVs were quantified within a fixed time interval on a Canto II HTS flow cytometer and analyzed using FCS 3 software. Using side-scatter and forward side-scatter, a vesicle gate was determined over the instrument noise (set by running PBS filtered through a 100-nm filter). Within this gate, IB4-positive events (number of events per ml) were evaluated as a parameter of MV concentration. In a set of experiments, after flow cytometry quantification, human MVs were pelletted at 10 000 × g from the volume of CSF yielding 400 MVs, which is the amount produced in vitro by 1 × 10⁶ microglia. MVs were then resuspended in neuronal medium and exposed to 1.7 × 10⁵ neurons. Alternatively, MVs (10 000 × g pellet) were processed and analyzed using SELDI-TOF mass spectrometry.
Statistical analysis
All data are presented as mean±S.E. from the indicated number of experiments. Statistical analysis was performed using SigmaStat 3.5 (Jandel Scientific, San Jose, CA, USA) software. After testing data for normal distribution, the appropriate statistical test has been used; see figure legends. The differences are considered to be significant if P<0.05 indicated by an asterisk, and those at P<0.01 indicated by a double asterisk.
Abbreviations
EMVs:
extracellular membrane microvesicles
MVs:
microvesicles
AA-MVs:
acutely added MVs
A_β_:
amyloid-β
AD:
Alzheimer’s disease
MCI:
mild cognitive impairment
PrPc:
prion protein
CSF:
cerebrospinal fluid
PI:
propidium iodide
KRH:
Krebs–Ringer solution
ThT:
thioflavin-T
References
- Herring A, Lewejohann L, Panzer AL, Donath A, Kroll O, Sachser N et al. Preventive and therapeutic types of environmental enrichment counteract beta amyloid pathology by different molecular mechanisms. Neurobiol Dis 2011; 42: 530–538.
Article CAS Google Scholar - Schilling S, Lauber T, Schaupp M, Manhart S, Scheel E, Bohm G et al. On the seeding and oligomerization of pGlu-amyloid peptides (in vitro). Biochemistry 2006; 45: 12393–12399.
Article CAS Google Scholar - Bieschke J, Herbst M, Wiglenda T, Friedrich RP, Boeddrich A, Schiele F et al. Small-molecule conversion of toxic oligomers to nontoxic beta-sheet-rich amyloid fibrils. Nat Chem Biol 2012; 8: 93–101.
Article CAS Google Scholar - Winklhofer KF, Tatzelt J, Haass C . The two faces of protein misfolding: gain- and loss-of-function in neurodegenerative diseases. EMBO J 2008; 27: 336–349.
Article CAS Google Scholar - Benilova I, Karran E, De Strooper B . The toxic Abeta oligomer and Alzheimer's disease: an emperor in need of clothes. Nat Neurosci 2012; 15: 349–357.
Article CAS Google Scholar - Lue LF, Brachova L, Civin WH, Rogers J . Inflammation, A beta deposition, and neurofibrillary tangle formation as correlates of Alzheimer's disease neurodegeneration. J Neuropathol Exp Neurol 1996; 55: 1083–1088.
Article CAS Google Scholar - Haass C, Mandelkow E . Fyn-tau-amyloid: a toxic triad. Cell 2010; 142: 356–358.
Article CAS Google Scholar - Serrano-Pozo A, Mielke ML, Gomez-Isla T, Betensky RA, Growdon JH, Frosch MP et al. Reactive glia not only associates with plaques but also parallels tangles in Alzheimer's disease. Am J Pathol 2011; 179: 1373–1384.
Article Google Scholar - Serrano-Pozo A, Mielke ML, Muzitansky A, Gomez-Isla T, Growdon JH, Bacskai BJ et al. Stable size distribution of amyloid plaques over the course of Alzheimer disease. J Neuropathol Exp Neurol 2012; 71: 694–701.
Article Google Scholar - Walsh DM, Selkoe DJ . A beta oligomers—a decade of discovery. J Neurochem 2007; 101: 1172–1184.
Article CAS Google Scholar - McLean CA, Cherny RA, Fraser FW, Fuller SJ, Smith MJ, Beyreuther K et al. Soluble pool of Abeta amyloid as a determinant of severity of neurodegeneration in Alzheimer's disease. Ann Neurol 1999; 46: 860–866.
Article CAS Google Scholar - Mielke MM, Haughey NJ, Bandaru VV, Weinberg DD, Darby E, Zaidi N et al. Plasma sphingomyelins are associated with cognitive progression in Alzheimer's disease. J Alzheimers Dis 2011; 27: 259–269.
Article CAS Google Scholar - Martins IC, Kuperstein I, Wilkinson H, Maes E, Vanbrabant M, Jonckheere W et al. Lipids revert inert Abeta amyloid fibrils to neurotoxic protofibrils that affect learning in mice. EMBO J 2008; 27: 224–233.
Article CAS Google Scholar - Johansson AS, Garlind A, Berglind-Dehlin F, Karlsson G, Edwards K, Gellerfors P et al. Docosahexaenoic acid stabilizes soluble amyloid-beta protofibrils and sustains amyloid-beta-induced neurotoxicity in vitro. FEBS J 2007; 274: 990–1000.
Article CAS Google Scholar - Snyder EM, Nong Y, Almeida CG, Paul S, Moran T, Choi EY et al. Regulation of NMDA receptor trafficking by amyloid-beta. Nat Neurosci 2005; 8: 1051–1058.
Article CAS Google Scholar - Lauren J, Gimbel DA, Nygaard HB, Gilbert JW, Strittmatter SM . Cellular prion protein mediates impairment of synaptic plasticity by amyloid-beta oligomers. Nature 2009; 457: 1128–1132.
Article CAS Google Scholar - Um JW, Nygaard HB, Heiss JK, Kostylev MA, Stagi M, Vortmeyer A et al. Alzheimer amyloid-beta oligomer bound to postsynaptic prion protein activates Fyn to impair neurons. Nat Neurosci 2012; 15: 1227–1235.
Article CAS Google Scholar - Verdier Y, Zarandi M, Penke B . Amyloid beta-peptide interactions with neuronal and glial cell plasma membrane: binding sites and implications for Alzheimer's disease. J Pept Sci 2004; 10: 229–248.
Article CAS Google Scholar - Edison P, Archer HA, Gerhard A, Hinz R, Pavese N, Turkheimer FE et al. Microglia, amyloid, and cognition in Alzheimer's disease: An [11C](R)PK11195-PET and [11C]PIB-PET study. Neurobiol Dis 2008; 32: 412–419.
Article CAS Google Scholar - Okello A, Edison P, Archer HA, Turkheimer FE, Kennedy J, Bullock R et al. Microglial activation and amyloid deposition in mild cognitive impairment: a PET study. Neurology 2009; 72: 56–62.
Article CAS Google Scholar - Hollingworth P, Harold D, Sims R, Gerrish A, Lambert JC, Carrasquillo MM et al. Common variants at ABCA7, MS4A6A/MS4A4E, EPHA1, CD33 and CD2AP are associated with Alzheimer's disease. Nat Genet 2011; 43: 429–435.
Article CAS Google Scholar - Guerreiro R, Wojtas A, Bras J, Carrasquillo M, Rogaeva E, Majounie E et al. TREM2 variants in Alzheimer's disease. N Engl J Med 2013; 368: 117–127.
Article CAS Google Scholar - Giulian D, Haverkamp LJ, Yu JH, Karshin W, Tom D, Li J et al. Specific domains of beta-amyloid from Alzheimer plaque elicit neuron killing in human microglia. J Neurosci 1996; 16: 6021–6037.
Article CAS Google Scholar - Fuhrmann M, Bittner T, Jung CK, Burgold S, Page RM, Mitteregger G et al. Microglial Cx3cr1 knockout prevents neuron loss in a mouse model of Alzheimer's disease. Nat Neurosci 2010; 13: 411–413.
Article CAS Google Scholar - Tan B, Choi RH, Chin TJ, Kaur C, Ling EA . Manipulation of microglial activity as a therapy for Alzheimer's disease. Front Biosci 2012; 4: 1402–1412.
Google Scholar - Weitz TM, Town T . Microglia in Alzheimer's Disease: it's all about context. Int J Alzheimers Dis 2012; 2012: 314185.
PubMed PubMed Central Google Scholar - Bianco F, Pravettoni E, Colombo A, Schenk U, Moller T, Matteoli M et al. induces vesicle shedding and IL-1 beta release from microglia. J Immunol 2005; 174: 7268–7277.
Article CAS Google Scholar - Del Conde I, Shrimpton CN, Thiagarajan P, Lopez JA . Tissue-factor-bearing microvesicles arise from lipid rafts and fuse with activated platelets to initiate coagulation. Blood 2005; 106: 1604–1611.
Article CAS Google Scholar - Gonnord P, Delarasse C, Auger R, Benihoud K, Prigent M, Cuif MH et al. Palmitoylation of the P2X7 receptor, an ATP-gated channel, controls its expression and association with lipid rafts. FASEB J 2009; 23: 795–805.
Article CAS Google Scholar - Verderio C, Muzio L, Turola E, Bergami A, Novellino L, Ruffini F et al. Myeloid microvesicles are a marker and therapeutic target for neuroinflammation. Ann Neurol 2012; 72: 610–624.
Article CAS Google Scholar - Colombo E, Borgiani B, Verderio C, Furlan R . Microvesicles: novel biomarkers for neurological disorders. Front Physiol 2012; 3: 63.
Article CAS Google Scholar - Rajendran L, Honsho M, Zahn TR, Keller P, Geiger KD, Verkade P et al. Alzheimer's disease beta-amyloid peptides are released in association with exosomes. Proc Natl Acad Sci USA 2006; 103: 11172–11177.
Article CAS Google Scholar - Perry VH, Nicoll JA, Holmes C . Microglia in neurodegenerative disease. Nat Rev Neurol 2010; 6: 193–201.
Article Google Scholar - Fukunaga S, Ueno H, Yamaguchi T, Yano Y, Hoshino M, Matsuzaki K . GM1 cluster mediates formation of toxic Abeta fibrils by providing hydrophobic environments. Biochemistry 2012; 51: 8125–8131.
Article CAS Google Scholar - Turola E, Furlan R, Bianco F, Matteoli M, Verderio C . Microglial microvesicle secretion and intercellular signaling. Front Physiol 2012; 3: 149.
Article CAS Google Scholar - Jana A, Pahan K . Fibrillar amyloid-beta-activated human astroglia kill primary human neurons via neutral sphingomyelinase: implications for Alzheimer's disease. J Neurosci 2010; 30: 12676–12689.
Article CAS Google Scholar - Alberdi E, Sanchez-Gomez MV, Cavaliere F, Perez-Samartin A, Zugaza JL, Trullas R et al. Amyloid beta oligomers induce Ca2+ dysregulation and neuronal death through activation of ionotropic glutamate receptors. Cell Calcium 2010; 47: 264–272.
Article CAS Google Scholar - Bianco F, Perrotta C, Novellino L, Francolini M, Riganti L, Menna E et al. Acid sphingomyelinase activity triggers microparticle release from glial cells. EMBO J 2009; 28: 1043–1054.
Article CAS Google Scholar - Holtzman DM . CSF biomarkers for Alzheimer's disease: current utility and potential future use. Neurobiol Aging 2011; 32 (Suppl 1): S4–S9.
Article CAS Google Scholar - Yuyama K, Sun H, Mitsutake S, Igarashi Y . Sphingolipid-modulated exosome secretion promotes clearance of amyloid-beta by microglia. J Biol Chem 2012; 287: 10977–10989.
Article CAS Google Scholar - Thery C, Ostrowski M, Segura E . Membrane vesicles as conveyors of immune responses. Nat Rev Immunol 2009; 9: 581–593.
Article CAS Google Scholar - Mattei V, Barenco MG, Tasciotti V, Garofalo T, Longo A, Boller K et al. Paracrine diffusion of PrP(C) and propagation of prion infectivity by plasma membrane-derived microvesicles. PLoS One 2009; 4: e5057.
Article Google Scholar - Han X, Fagan AM, Cheng H, Morris JC, Xiong C, Holtzman DM . Cerebrospinal fluid sulfatide is decreased in subjects with incipient dementia. Ann Neurol 2003; 54: 115–119.
Article CAS Google Scholar - Malnar M, Kosicek M, Bene R, Tarnik IP, Pavelin S, Babic I et al. Use of cerebrospinal fluid biomarker analysis for improving Alzheimer's disease diagnosis in a non-specialized setting. Acta Neurobiol Exp 2012; 72: 264–271.
Google Scholar - Ghidoni R, Paterlini A, Albertini V, Glionna M, Monti E, Schiaffonati L et al. Cystatin C is released in association with exosomes: a new tool of neuronal communication which is unbalanced in Alzheimer's disease. Neurobiol Aging 2011; 32: 1435–1442.
Article CAS Google Scholar - Vella LJ, Sharples RA, Nisbet RM, Cappai R, Hill AF . The role of exosomes in the processing of proteins associated with neurodegenerative diseases. Eur Biophys J 2008; 37: 323–332.
Article CAS Google Scholar - Vingtdeux V, Hamdane M, Begard S, Loyens A, Delacourte A, Beauvillain JC et al. Intracellular pH regulates amyloid precursor protein intracellular domain accumulation. Neurobiol Dis 2007; 25: 686–696.
Article CAS Google Scholar - Yamamoto M, Kiyota T, Walsh SM, Liu J, Kipnis J, Ikezu T . Cytokine-mediated inhibition of fibrillar amyloid-beta peptide degradation by human mononuclear phagocytes. J Immunol 2008; 181: 3877–3886.
Article CAS Google Scholar - Aguzzi A, Barres BA, Bennett ML . Microglia: scapegoat, saboteur, or something else? Science 2013; 339: 156–161.
Article CAS Google Scholar - Prinz M, Priller J, Sisodia SS, Ransohoff RM . Heterogeneity of CNS myeloid cells and their roles in neurodegeneration. Nat Neurosci 2011; 14: 1227–1235.
Article CAS Google Scholar - Paresce DM, Chung H, Maxfield FR . Slow degradation of aggregates of the Alzheimer's disease amyloid beta-protein by microglial cells. J Biol Chem 1997; 272: 29390–29397.
Article CAS Google Scholar - Lee CY, Landreth GE . The role of microglia in amyloid clearance from the AD brain. J Neural Transm 2010; 117: 949–960.
Article CAS Google Scholar - Rajendran L, Annaert W . Membrane trafficking pathways in Alzheimer's disease. Traffic 2012; 13: 759–770.
Article CAS Google Scholar - Ariga T, Kobayashi K, Hasegawa A, Kiso M, Ishida H, Miyatake T . Characterization of high-affinity binding between gangliosides and amyloid beta-protein. Arch Biochem Biophys 2001; 388: 225–230.
Article CAS Google Scholar - Kiyota T, Yamamoto M, Xiong H, Lambert MP, Klein WL, Gendelman HE et al. CCL2 accelerates microglia-mediated Abeta oligomer formation and progression of neurocognitive dysfunction. PLoS One 2009; 4: e6197.
Article Google Scholar - Shen B, Wu N, Yang JM, Gould SJ . Protein targeting to exosomes/microvesicles by plasma membrane anchors. J Biol Chem 2011; 286: 14383–14395.
Article CAS Google Scholar - Sharples RA, Vella LJ, Nisbet RM, Naylor R, Perez K, Barnham KJ et al. Inhibition of gamma-secretase causes increased secretion of amyloid precursor protein C-terminal fragments in association with exosomes. FASEB J 2008; 22: 1469–1478.
Article CAS Google Scholar - Tamboli IY, Barth E, Christian L, Siepmann M, Kumar S, Singh S et al. Statins promote the degradation of extracellular amyloid {beta}-peptide by microglia via stimulation of exosome-associated insulin-degrading enzyme (IDE) secretion. J Biol Chem 2010; 285: 37405–37414.
Article CAS Google Scholar - Antonucci F, Turola E, Riganti L, Caleo M, Gabrielli M, Perrotta C et al. Microvesicles released from microglia stimulate synaptic activity via enhanced sphingolipid metabolism. EMBO J 2012; 31: 1231–1240.
Article CAS Google Scholar - Klein WL . Abeta toxicity in Alzheimer's disease: globular oligomers (ADDLs) as new vaccine and drug targets. Neurochem Int 2002; 41: 345–352.
Article CAS Google Scholar - De Felice FG, Wu D, Lambert MP, Fernandez SJ, Velasco PT, Lacor PN et al. Alzheimer's disease-type neuronal tau hyperphosphorylation induced by A beta oligomers. Neurobiol Aging 2008; 29: 1334–1347.
Article CAS Google Scholar - Frassoni C, Inverardi F, Coco S, Ortino B, Grumelli C, Pozzi D et al. Analysis of SNAP-25 immunoreactivity in hippocampal inhibitory neurons during development in culture and in situ. Neuroscience 2005; 131: 813–823.
Article CAS Google Scholar - Paluzzi S, Alloisio S, Zappettini S, Milanese M, Raiteri L, Nobile M et al. Adult astroglia is competent for Na+/Ca2+ exchanger-operated exocytotic glutamate release triggered by mild depolarization. J Neurochem 2007; 103: 1196–1207.
Article CAS Google Scholar - Albertini V, Bruno A, Paterlini A, Lista S, Benussi L, Cereda C et al. Optimization protocol for amyloid-beta peptides detection in human cerebrospinal fluid using SELDI TOF MS. Proteomics Clin Appl 2010; 4: 352–357.
Article CAS Google Scholar
Acknowledgements
We thank Paola Viani (University of Milan) and Elisabetta Menna (CNR Institute of Neuroscience, Milan) for discussion, Annamaria Finardi (San Raffaele Scientific Institute, Milan) for flow cytometry assistance, Maria Rosa Accomazzo (University of Milan) for spectrofluorometer assistance, Maura Francolini and Simona Rodighiero for support with negative staining electron microscopy (Fondazione Filarete, Milan), Marco Milanese (University of Genova) for HPLC measurements, Cinzia Cagnoli and Martina Gabrielli (University of Milan) for help in some experiments. This work was supported by a grant from Fondazione Veronesi to CV, PNR-CNR Aging program 2012–2014, FIRB 2011- ‘RBAP11FRE9_001 to GL and RF, Cariplo 2008-3184 to MM and Ricerca Corrente Italian Ministry of Health to RG.
Author information
Author notes
- M Matteoli and C Verderio: Joint senior authors.
Authors and Affiliations
- Department of Biotechnology and Translational Medicine, University of Milano, via Vanvitelli 32, Milano, 20129, Italy
P Joshi, E Turola, A Ruiz, P Giussani & M Matteoli - Department of Medicine, CNR Institute of Neuroscience, via Vanvitelli 32, Milano, 20129, Italy
P Joshi, E Turola & C Verderio - Division of Neuroscience, INSPE, San Raffaele Scientific Institute, via Olgettina 60, Milano, 20132, Italy
A Bergami, D D Libera, G Magnani, G Comi & R Furlan - Proteomics Unit, IRCCS Istituto centro San Giovanni di Dio Fatebenefratelli, via Pilastroni, Brescia, 4 25125, Italy
L Benussi & R Ghidoni - Department of Neuroscience, SISSA, Via Bonomea 265, Trieste, I-34136, Italy
G Legname - IRCCS Humanitas,via Manzoni 56, Rozzano, 20089, Italy
M Matteoli & C Verderio
Authors
- P Joshi
You can also search for this author inPubMed Google Scholar - E Turola
You can also search for this author inPubMed Google Scholar - A Ruiz
You can also search for this author inPubMed Google Scholar - A Bergami
You can also search for this author inPubMed Google Scholar - D D Libera
You can also search for this author inPubMed Google Scholar - L Benussi
You can also search for this author inPubMed Google Scholar - P Giussani
You can also search for this author inPubMed Google Scholar - G Magnani
You can also search for this author inPubMed Google Scholar - G Comi
You can also search for this author inPubMed Google Scholar - G Legname
You can also search for this author inPubMed Google Scholar - R Ghidoni
You can also search for this author inPubMed Google Scholar - R Furlan
You can also search for this author inPubMed Google Scholar - M Matteoli
You can also search for this author inPubMed Google Scholar - C Verderio
You can also search for this author inPubMed Google Scholar
Corresponding authors
Correspondence toM Matteoli or C Verderio.
Ethics declarations
Competing interests
The authors declare no conflict of interest.
Additional information
Edited by L Greene
Supplementary Information accompanies this paper on Cell Death and Differentiation website
Supplementary information
Rights and permissions
About this article
Cite this article
Joshi, P., Turola, E., Ruiz, A. et al. Microglia convert aggregated amyloid-β into neurotoxic forms through the shedding of microvesicles.Cell Death Differ 21, 582–593 (2014). https://doi.org/10.1038/cdd.2013.180
- Received: 18 June 2013
- Revised: 15 October 2013
- Accepted: 30 October 2013
- Published: 13 December 2013
- Issue Date: April 2014
- DOI: https://doi.org/10.1038/cdd.2013.180