A genetic variation map for chicken with 2.8 million single-nucleotide polymorphisms (original) (raw)
Main
The generation of a high-quality draft sequence of the chicken genome (Gallus gallus) is an important advance in the field of animal genetics1. Chickens are good models for studying the genetic basis of phenotypic traits because of the extensive diversity among domestic chickens that have been selected for different purposes. Monogenic traits are well studied2,3,4, but many interesting traits are complex and determined by an unknown number of genes. Quantitative trait loci (QTLs) have been mapped for a range of traits, including ones for growth, body composition, egg production, antibody response, disease resistance and behaviour[5](/articles/nature03156#ref-CR5 "Animal Breeding and Genetics Group of Wageningen University. ChickAce 〈 https://acedb.asg.wur.nl
〉 (2004)."). Determining causative genes for quantitative traits is difficult because each locus controls only a fraction of the phenotypic variance. We describe a survey of the genetic variation between three domestic chicken breeds and their wild ancestor. The 2.8 million SNPs that we identified will facilitate mapping of complex traits in many ways. First, improved marker density allows researchers to take advantage of the higher recombination rates in chicken[1](/articles/nature03156#ref-CR1 "International Chicken Genome Sequencing Consortium. Sequence and comparative analysis of the chicken genome provide unique perspectives on vertebrate evolution. Nature doi:10.1038/nature03154 (this issue)"), which are 2.5–21 cM Mb\-1 depending on the chromosome, as compared with ∼1 cM Mb\-1 for human and ∼0.5 cM Mb\-1 for mouse. The previous linkage map used 2,000 markers[6](/articles/nature03156#ref-CR6 "Groenen, M. A. et al. A consensus linkage map of the chicken genome. Genome Res. 10, 137–147 (2000)"),[7](/articles/nature03156#ref-CR7 "Groenen, M. A. & Crooijmans, R. P. Structural genomics: integrating linkage, physical and sequence maps. In Poultry Genetics, Breeding and Biotechnology (eds Muir, W. M. & Aggrey, S. E.) 497–536 (CABI, Wallingford, 2003)"), but only 800 of those were microsatellites or SNPs, which are the most useful[8](/articles/nature03156#ref-CR8 "Vignal, A., Milan, D., SanCristobal, M. & Eggen, A. A review on SNP and other types of molecular markers and their use in animal genetics. Genet. Sel. Evol. 34, 275–305 (2002)"). Our new data allow researchers to construct detailed haplotypes that segregate in different QTL crosses. Because any mutation underlying a QTL must once have originated from a single founder animal, haplotype comparisons will facilitate the fine mapping of QTLs[9](/articles/nature03156#ref-CR9 "Andersson, L. & Georges, M. Domestic-animal genomics: deciphering the genetics of complex traits. Nature Rev. Genet. 5, 202–212 (2004)"). To this end, we conduct a genome-wide search for evidence of selection due to domestication, and provide an initial characterization of the expected magnitude of these effects.Genetic variation and utility
Our experiment is outlined in Fig. 1. SNPs are generated by partial sequencing at one-quarter coverage for each of three domestic breeds (a male broiler, a female layer and a female silkie). The resultant reads are then compared with the genome (at 6.6 × coverage) for the wild ancestor of domestic chickens, red jungle fowl. We expect marked heterozygosity within the three domestic lines, but not within red jungle fowl, because the bird that was sequenced for the genome project came from a highly inbred line that is essentially homozygous.
Figure 1: SNP discovery experiment.
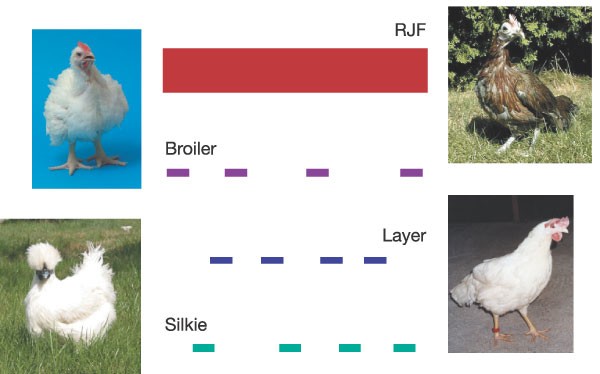
We sampled three domestic chickens at one-quarter coverage each and compared the resultant sequence to the 6.6 × draft genome of red jungle fowl (RJF). Chicken photographs are provided by B. Payne (red jungle fowl), P. M. Hocking (broiler), L. Andersson (layer) and N. Yang (silkie).
Comparison of the sequence reads for broiler, layer and silkie to the genome of red jungle fowl revealed nearly one million SNPs in each instance, at mean rates of about five SNPs per kilobase (kb) (Table 1). Note that all of the SNP rates stated in this paper are calculated as nucleotide diversities (π), and given in units of π × 103. After correcting for SNPs detected in more than one line, there are 2,833,578 variant sites or one potential marker for every 374 base pairs (bp) along the 1.06 gigabase (Gb) genome. To assess the reliability of these data, we resequenced 295 SNPs in the same bird in which they were detected (Supplementary Table S1). As much as 94% of the SNPs were confirmed; however, confirmation rates are sensitive to functional context (for example, coding versus non-coding) and SNPs in rare categories are less likely to be confirmed. For example, only 83% of the non-synonymous SNPs were confirmed. Small indels (insertions or deletions) of a few base pairs in length (mean of 2.3 bp and median of 1 bp) are detectable at rates that are well correlated with the corresponding SNP rates, but smaller by about a factor of ten.
Table 1 Frequency of SNPs in comparisons of red jungle fowl and three domestic chicken lines
Chicken autosomes are sorted by size into five large macrochromosomes (G. gallus (GGA)1–5), five intermediate chromosomes (GGA6–10) and 28 microchromosomes (GGA11–38). SNP and indel rates are independent of chromosome size, as shown in Fig. 2. GGA16 is the only exception, because it contains the highly variable major histocompatibility complex (MHC). (There are only 20 kb of aligned sequence on GGA16, and if we were to remove it, the total SNP rate would only change by 0.02%.) This result is surprising because recombination rates on microchromosomes are much higher than on macrochromosomes1, and studies in other organisms reveal a positive correlation between recombination rates and polymorphism rates10,11. We suspect that higher gene densities on microchromosomes counteract the effect of higher recombination rates.
Figure 2: SNP and indel rates versus chromosome number.
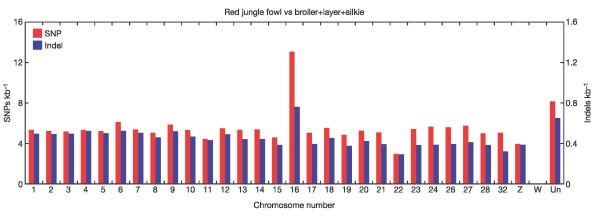
We excluded all sequences with ‘random’ chromosome positions. Because of the assembly problems on chromosome W, it is not shown. The rates are computed as an average of all three domestic lines.
SNP rates between and within chicken lines can be determined from the overlaps between reads. Table 1 demonstrates that almost every pairwise combination gives a SNP rate of just over 5 SNPs kb-1, except for broiler–broiler and layer–layer, which show about 4 SNPs kb-1 (as expected because the sequenced broiler and layer are from closed breeding lines). To ensure that there are no confounding factors from the single read nature of our data or the complexities of the overlap analysis, we used comparisons to 3.8 Mb of finished bacterial artificial chromosome (BAC) sequence of a different white leghorn12—from the same breed but not the same line as the layer sequenced herein. Fifteen chromosomes were sampled and the results confirm our rates of 5 SNPs kb-1. In another study of 15 kb of introns in 25 birds from ten divergent breeds of domestic chickens13, an autosomal rate of 6.5 SNPs kb-1 was reported.
To quantify SNP and indel rate variation versus functional context, we considered three gene sets representing 3,868 confirmed messenger RNA transcripts, 995 chicken orthologues of human disease genes, and 17,709 Ensembl annotations from the red jungle fowl analysis1. Complete details for all three lines are tabulated in the Supplementary Information (Supplementary Table S2). An excerpt for broiler is shown in Table 2. Within genes defined by mRNA transcripts, the SNP rates are 3.5, 2.1, 5.7 and 3.4 SNPs kb-1 in 5′-untranslated region (UTR), coding exon, intron and 3′-UTR regions respectively. In coding regions, indel rates are 43 times smaller than SNP rates. The _K_A/_K_S ratio (where _K_A and _K_S are the number of non-synonymous and synonymous substitutions per available site) is 0.098, similar to what is typically seen in vertebrate comparisons. We also studied ‘conserved non-coding regions’ from the red jungle fowl analysis1. SNP rates are similar to those for coding exons, but indel rates are intermediate to those for coding exons and UTRs, thereby supporting the notion that these regions are functional but may not encode proteins.
Table 2 Frequency of sequence polymorphisms between red jungle fowl and broiler
The utility of these SNPs depends on their frequency of occurrence in commonly used chicken populations. Hence, we analysed 125 SNPs (including coding and non-coding SNPs, randomly distributed across the chicken genome) in ten unrelated individuals from each of nine divergent lines representing an assortment of European breeds. This collection includes commercial broiler and layer breeds, standardized breeds selected for their morphological traits, and an unselected breed from Iceland (Supplementary Table S3). Both alleles segregated in 73% of 1,113 successful marker–line combinations (out of 1,125 possible combinations). Averaged minor allele frequency is 27%, but it decreases to 20% if marker–line combinations where one of the two alleles is fixed are included. This indicates that most of the SNPs are common variants that predate the divergence of modern breeds. Only 12% of the markers had a minor allele frequency of less than 10% in the 90 animals tested.
We now demonstrate by example how these data can be used to target specific genome regions. Details of our experiments are in the Supplementary Information. First, we consider a body-weight-related QTL on GGA4 that was previously mapped to a 150-cM interval14,15. After a year of effort, where every known microsatellite (> 50) was tested, 26 informative markers were developed. Further progress would have required the laborious sequencing of multiple chickens to find additional polymorphisms in this target region. With the SNP map, we selected 47 random broiler–layer SNPs, and ABI SNPlex assays were developed to genotype an experimental F2 cross (n = 466). Twenty-eight (60%) of these SNPs segregated in the cross but none showed breed-specific alleles, confirming that most variations predate domestication. In just one month we doubled the number of markers and resolved the initial QTL into two QTLs that affect body weight at 3 and 9 weeks of age.
In addition to providing markers for fine mapping, these SNPs are a rich source of candidate polymorphisms for the causative differences underlying important traits. As an example, candidate genes for disease resistance often include TGF-β16,17, cytokines18 and the MHC. We thus identified 40 SNPs from the SNP map in the coding or promoter regions of 12 cytokine genes. When analysed in eight inbred layer lines, 32 of these SNPs were informative. Cytokine genes on GGA13, including IL4 and IL13 (two genes that are expressed in T-helper-2 (Th2) cells), drive antibody response. Four of the six SNPs that were polymorphic among lines were in IL4 and IL13, and these SNPs were fixed for different alleles in lines N and 15I, which show differential antibody response to vaccination19. These SNPs therefore allow us to test whether the IL4 and IL13 loci directly determine the observed differential antibody response.
Domestication and selection
Domestic animals are useful models of phenotypic evolution under selection. The challenge is to find not only those loci that determine phenotypic differences, but also the causative alleles. We used two different approaches: first, searching for evidence of selective sweeps20, and second, searching for non-synonymous amino acid substitutions at highly conserved sites. Given the available data, determining the exact haplotype structure is difficult because blocks of shared alleles can be erroneously disrupted by heterozygosity of the domestic lines and by sequencing errors. However, we can still search for the local reductions in heterozygosity that accompany selective sweeps, as long as we are mindful of the sequencing error rate. One example of a selective sweep is the IGF2 locus in pigs21.
We carried out three-way comparisons of red jungle fowl and all possible combinations of two domestic lines. Given the limited coverage of the latter, we only examined 100-kb segments with at least ten SNP sites, where each qualifying site must have read coverage from every line. In practice, these segments contained an average of 25–28 SNPs. Then, we computed how often 80% or more of the SNP sites are identical in the two domestic lines but different in red jungle fowl. In Supplementary Table S4 we show that 0.4–1.5% of the segments qualified; however, when we searched for shared alleles between red jungle fowl and one domestic line, 1.2–2.6% of the segments qualified. We note that heterozygosity of the domestic lines is more of a confounding factor in searching for blocks of shared alleles between two domestic lines than between red jungle fowl and one domestic line. This could explain the difference, but if so, then heterozygosity of the domestic lines is the dominant factor in this analysis, not selective sweeps. Hence, selective sweeps that occurred before the divergence of modern domestic breeds must have left behind footprints that are much smaller than 100 kb. This would be consistent with the historically large effective population size of domestic chickens, and the reported high recombination rates.
For a glimpse of the true haplotype patterns one can compare the aforementioned 3.8 Mb of finished BAC sequence from the second layer line (L2) to the genome of red jungle fowl. These results are overlaid alongside the primary SNP data set in Fig. 3. Short red-jungle-fowl-type fragments can be seen in all four lines. Shared domestic-type fragments can also be seen, but at sizes of 5–15 kb. This is consistent with our inability to detect footprints of selective sweeps at length scales of 100 kb, and suggests that a better choice of length is 10 kb. However, our data are insufficient for such a genome-wide analysis.
Figure 3: Detailed haplotype patterns in three regions, each covered by two overlapping BACs from the second layer line (L2).
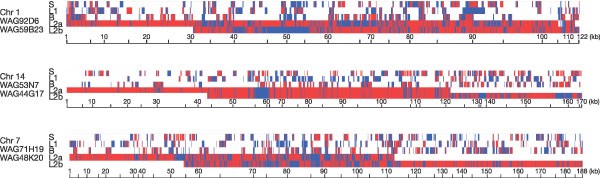
The primary SNP data are labelled B (broiler), L1 (layer) and S (silkie). All comparisons are to red jungle fowl, and we show only those sites where a SNP is identified in at least one of the four lines. Hence, the horizontal scale is linear in the number of SNP sites, but nonlinear for size. Blue colours indicate where a particular line agrees with red jungle fowl, whereas red colours indicate where a particular line does not agree with red jungle fowl. Overlapping BACs on chromosomes 1 and 7, but not chromosome 14, are clearly from different haplotypes.
It has been proposed that loss-of-function mutations have accumulated in domestic animals as the result of relaxed purifying selection and selection for adaptive benefits22. An example of the latter is the deletion in the myostatin gene in cattle selected for muscularity23. Such deletions are rare, and so we looked for non-synonymous SNPs at highly conserved sites using the program SIFT24. Every substitution is thus classified as being likely to affect function (intolerant) or not (tolerant). For genes defined by mRNA transcripts, 26% of testable SNPs are intolerant, although only 11% are intolerant if we restrict this to high-confidence assessments (Supplementary Table S5). Usually, it is the domestic allele that is intolerant, but we would emphasize that intolerant SNPs are rare, and only 59% were confirmed by polymerase chain reaction (PCR) re-sequencing. Given that the domestic allele is represented by a single read, as opposed to 6.6 for the wild allele, much of this effect is probably due to sequencing errors. However, we noticed the same effect in 424 non-synonymous SNPs that we identified from an analysis of 330,000 expressed sequence tags (ESTs), where every allele was seen in two or more ESTs. We conclude that the loss-of-function hypothesis remains intriguing, but any effect is likely to be small.
Some of the experimentally confirmed SIFT-intolerant SNPs might be functionally important. We show one example in Fig. 4, from the ornithine transcarbamylase (OTC) gene. The SNP substitutes glycine in red jungle fowl to arginine in layer and broiler breeds. This SNP is identical to the G188R substitution associated with hyperammonaemia in humans25. Re-sequencing of additional domestic birds revealed a high frequency for the intolerant allele in both white leghorns (P = 0.65, n = 20) and in broilers (P = 0.75, n = 6). In mammals, OTC is expressed in the liver and catalyses the second step of the urea cycle. Chicken OTC is expressed in the kidney and exhibits a low enzymatic activity, with substantial variability among breeds26. Preservation and sequence conservation of OTC, along with all other enzymes in the urea cycle1, was unexpected because avian species excrete uric acid (not urea) as their primary component of nitrogenous waste, and were believed to be lacking a functional urea cycle. The deleterious nature of human G188R makes this an attractive candidate for phenotypic studies of avian-specific adaptations in the urea cycle.
Figure 4: Multi-species alignments for ornithine transcarbamylase (OTC), indicating non-synonymous substitutions relative to human protein.
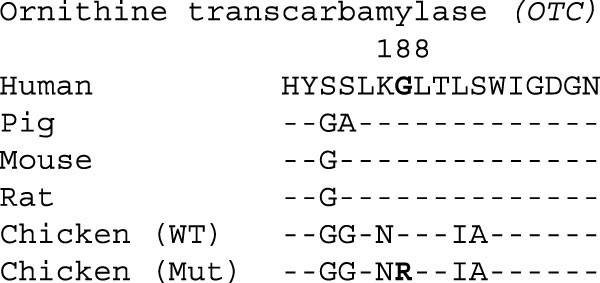
SIFT-intolerant position is indicated by site number and bold font. WT, wild type; Mut, mutant.
Discussion
This study provides the first global assessment of nucleotide diversity for a domestic animal in comparison to a representative of its wild ancestor. The small number of birds sequenced is compensated for by the vast number of sites examined. We detected surprisingly little difference in diversity in comparisons between red jungle fowl and domestic lines, between different domestic lines, and within domestic lines. The total rates are typically 5 SNPs kb-1, with the only exception being a slight reduction to 4 SNPs kb-1 in broiler and layer lines that are maintained as closed breeding populations. Notice that our estimates do not include the female-specific W chromosome, which has a much lower genetic variability48. In comparison, 5 SNPs kb-1 is six- to sevenfold larger than humans27 and domestic dogs28, threefold larger than gorillas29, but similar to the diversity between different mouse subspecies30.
Most of the nucleotide diversity observed between and within domestic lines must have originated before the domestication of chickens 5,000 to 10,000 yr ago. Given a neutral substitution rate of 1.8 × 10⁻⁹ sites per year for galliform birds31, we estimate that a coalescence time of 1.4 million years would be required to account for the observed rates of 5 SNPs kb-1. Considering that the rates observed between red jungle fowl and domestic lines are not much higher than those between domestic lines, it would seem that domestication has not resulted in a substantial genome-wide loss of diversity, as would be expected had a severe population bottleneck occurred. This is important because it contradicts the assertion that animal domestication began from a small number of individuals in a restricted geographical region32. That is still a possible scenario for the very earliest phases of domestication, but if so, our data imply that subsequent crossing with the wild ancestor (in the first 1,000 yr or so, until more developed breeds were established) restored this diversity. Nevertheless, extensive diversity is consistent with the ongoing improvements in agricultural traits that have been achieved over the last 80 yr in layer and broiler lines33.
The most important application for this SNP map will be in analysis of QTLs and other genetic traits. Although the density of markers far exceeds what is needed for initial mapping, the principal challenge is not in the detection of linkage but in the identification of genes underlying QTLs9. By itself, our SNP map is not adequate. It must be combined with novel strategies and novel resources (such as mapping populations specifically designed for fine mapping). The essential problem is the lack of a one-to-one relationship between genotype and phenotype, as the latter is influenced by multiple genetic and environmental factors. This can be overcome, in experimental and domestic animals, by progeny testing and segregation analysis, which permit detailed characterization of haplotypes associated with different QTL alleles, and may eventually lead to the identification of the underlying causative mutations21. This SNP map will facilitate fine mapping.
As an example, the major Growth1 QTL on GGA1 explains about one-third of the difference between red jungle fowl and white leghorn in adult body weight and egg weight34. Initial mapping assigned this locus to a ∼20-cM confidence interval. Selective backcrossing using sires that have recombinant chromosomes, and QTL analysis using subsequent intercross generations, are currently being used to refine the localization to a few centimorgan, expected to be less than ∼1 Mb. This establishes a collection of chromosomes of known QTL status. Our SNP map can then be used for haplotype analysis, assuming that the white leghorns share a chromosomal segment—identical by descent—with the causative mutation. The small haplotype blocks detected in this study underscore the need for a larger number of SNPs to identify such identical-by-descent segments. Although these small blocks may require greater marker density and more recombinants to identify the causative haplotype, less effort will be required to resolve the actual QTL alleles once the haplotype is found.
Methods
Animals sequenced
Our broiler and layer lines are from European breeds with marked differences in meat and egg production traits. This specialization started only during the first half of the twentieth century35. The sequenced male white Cornish broiler is from a closed breeding population commonly used in the production of commercial meat-type hybrids (Aviagen); effective population size is about 800. The female white leghorn layer is from a closed line developed at the Swedish University of Agricultural Sciences36; its effective population size has been 60–80 birds for the past 30 yr. The Chinese silkie is used in meat/egg production and traditional Chinese medicine37. Selection intensity has been low, and the sequenced female is from a large outbred population.
DNA was extracted from the erythrocytes of a single bird, sheared by sonication, and size fractionated on agarose gels. Fragments of 3 kb in size were ligated to _Sma_I-cut blunt-ended pUC18 plasmid vectors. Single colonies were grown overnight, and plasmids were extracted by an alkaline lysis protocol. Sequences were read from both ends of the insert with vector primers and Amersham MegaBACE 1000 capillary sequencers. Roughly one million reads were generated for each bird. For broiler, layer and silkie we got a total of 841,790, 841,555 and 870,556 successful reads, with _Q_20 lengths of 380,729,199 bp, 372,263,344 bp and 397,831,117 bp, respectively.
Polymorphism detection
To minimize sequencing errors we use the Phred quality, Q38,39. This is related to the single-base error rate by the equation -10 × log10(Q). We use more stringent thresholds than normal40, with Q > 25 for the variant site and Q > 20 in both flanking 5-bp regions. For an indel, the variant site in the shorter allele is given the quality of its two flanking bases. We originally found many artefactual deletions relative to red jungle fowl, which upon a closer examination of the sequence reads were due to doublet peaks that got called as singlet peaks. This is an unavoidable flaw of the base-caller software. Hence, we raised the indel thresholds to _Q_30 and _Q_25. We must still advise caution, and to that end, indels in simple repeats are flagged and none are counted in Tables 1 and 2 and Supplementary Tables.
Paralogue confusion is detected in the course of the genome-level BlastN search that determines where the read is supposed to go. Once this is known, the detailed alignments are done within CrossMatch[41](/articles/nature03156#ref-CR41 "Green, P. CrossMatch 〈 http://www.phrap.org/phredphrapconsed.html#block_phrap
〉 (2004)."). Analysis of the red jungle fowl genome[1](/articles/nature03156#ref-CR1 "International Chicken Genome Sequencing Consortium. Sequence and comparative analysis of the chicken genome provide unique perspectives on vertebrate evolution. Nature doi:10.1038/nature03154 (this issue)") shows that recent segmental duplications typically agree to 2%. When the best and second best BlastN hits were more than 2% apart, and the best hit was not to a known segmental duplication, the best hit was taken. When either rule was violated, clone-end pairs information was used to resolve the ambiguity. Every alignment had to incorporate 80% of the read. Mapped back to the red jungle fowl genome, the amount of usable data for broiler, layer and silkie covered 190,513,980 bp, 165,154,746 bp and 210,214,479 bp respectively.Rate normalization
Polymorphism rates are normalized to the length of the sequence on which we can detect SNPs. To correct for heterozygosity within a line, we calculate nucleotide diversity using the approximation42 π = K/∑i = 1_n_ - 1 L/i, where K is the number of variant sites found by sequencing n chromosomes in a region of length L. When comparing red jungle fowl to one of the three domestic lines, n can only be 2 or 3, and it is a stochastic variable, because there is a 50% chance that any two overlapping reads are from the same chromosome. When there are m overlapping reads, the denominator is L/2_m_-1(1 + (2_m_-1 - 1)(1 + 1/2)). We then sum over all possible regions, with different L and m values for each region, to get what we call the ‘effective length’. Similar considerations are used to compute SNP rates within a line, except that n is 1 or 2, and as a result, the denominator becomes L/2_m_-1(2_m_-1 - 1).
We calculate gene context relative to five different data sets. The first three are based on experimentally derived genes and the last two are based on computer annotations. Riken1 is a data set of 1,758 full-length complementary DNAs taken from bursal B cells of a 2-week-old Prague CB inbred43. The second data set, GenBank, refers to 1,178 chicken genes with ‘complete CDS’ designation, downloaded as version 2003-12-15. BBSRC is a set of 1,184 full-length cDNAs taken from a larger group of 18,034 cDNAs44 using TBlastX mapping to the vertebrate Refseq and BlastX mapping to SWALL. Through merging all three data sets we have 3,868 non-redundant genes. For the detailed gene models, we carried out a genome-level search in BLAT45 and used SIM4 (ref. 46) to calculate the exon–intron boundaries. The last two data sets contain 995 chicken orthologues of human disease genes and 17,709 non-redundant Ensembl genes.
References
- International Chicken Genome Sequencing Consortium. Sequence and comparative analysis of the chicken genome provide unique perspectives on vertebrate evolution. Nature doi:10.1038/nature03154 (this issue)
- Pisenti, J. M. et al. Avian genetic resources at risk: an assessment and proposal for conservation of genetic stocks in the USA and Canada. Avian Poultry Biol. Rev. 12, 1–102 (2001)
Google Scholar - Dodgson, J. B. & Romanov, M. N. Use of chicken models for the analysis of human disease. In Current Protocols in Human Genetics (eds Dracopoli, N. C. et al.) 15.5.1–15.5.11 (Wiley, Hoboken, 2004)
Google Scholar - Nicholas, F. W. Online Mendelian Inheritance in Animals (OMIA): a comparative knowledgebase of genetic disorders and other familial traits in non-laboratory animals. Nucleic Acids Res. 31, 275–277 (2003)
Article CAS Google Scholar - Animal Breeding and Genetics Group of Wageningen University. ChickAce 〈https://acedb.asg.wur.nl〉 (2004).
- Groenen, M. A. et al. A consensus linkage map of the chicken genome. Genome Res. 10, 137–147 (2000)
CAS PubMed PubMed Central Google Scholar - Groenen, M. A. & Crooijmans, R. P. Structural genomics: integrating linkage, physical and sequence maps. In Poultry Genetics, Breeding and Biotechnology (eds Muir, W. M. & Aggrey, S. E.) 497–536 (CABI, Wallingford, 2003)
Chapter Google Scholar - Vignal, A., Milan, D., SanCristobal, M. & Eggen, A. A review on SNP and other types of molecular markers and their use in animal genetics. Genet. Sel. Evol. 34, 275–305 (2002)
Article CAS Google Scholar - Andersson, L. & Georges, M. Domestic-animal genomics: deciphering the genetics of complex traits. Nature Rev. Genet. 5, 202–212 (2004)
Article CAS Google Scholar - Begun, D. J. & Aquadro, C. F. Levels of naturally occurring DNA polymorphism correlate with recombination rates in D. melanogaster. Nature 356, 519–520 (1992)
Article ADS CAS Google Scholar - Nachman, M. W. Single nucleotide polymorphisms and recombination rate in humans. Trends Genet. 9, 481–485 (2001)
Article Google Scholar - Crooijmans, R. P., Vrebalov, J., Dijkhof, R. J., van der Poel, J. J. & Groenen, M. A. Two-dimensional screening of the Wageningen chicken BAC library. Mamm. Genome 11, 360–363 (2000)
Article CAS Google Scholar - Sundstrom, H., Webster, M. T. & Ellegren, H. Reduced variation on the chicken Z chromosome. Genetics 167, 377–385 (2004)
Article Google Scholar - Ikeobi, C. O. et al. Quantitative trait loci for muscling in a broiler layer cross. Livest. Prod. Sci. 87, 143–151 (2004)
Article Google Scholar - Sewalem, A. et al. Mapping of quantitative trait loci for body weight at three, six, and nine weeks of age in a broiler layer cross. Poultry Sci. 81, 1775–1781 (2002)
Article CAS Google Scholar - Li, H. et al. Chicken quantitative trait loci for growth and body composition associated with transforming growth factor-β genes. Poultry Sci. 82, 347–356 (2003)
Article CAS Google Scholar - Zhou, H., Li, H. & Lamont, S. J. Genetic markers associated with antibody response kinetics in adult chickens. Poultry Sci. 82, 699–708 (2003)
Article CAS Google Scholar - Gallagher, G., Eskdale, J. & Bidwell, J. L. Cytokine genetics—polymorphisms, functional variations and disease associations. In The Cytokine Handbook 4th edn (eds Thomson, A. W. & Lotze, M. T.) 19–55 (Academic, London, 2003)
Chapter Google Scholar - Bumstead, N. et al. EU Project FAIR3 PL96–1502 New Molecular Approaches for Improved Poultry Vaccines (Institute for Animal Health, Compton, 2000)
Google Scholar - Maynard-Smith, J. & Haigh, J. The hitch-hiking effect of a favourable gene. Genet. Res. 23, 23–35 (1974)
Article Google Scholar - Van Laere, A. S. et al. A regulatory mutation in IGF2 causes a major QTL effect on muscle growth in the pig. Nature 425, 832–836 (2003)
Article ADS CAS Google Scholar - Olson, M. V. When less is more: gene loss as an engine of evolutionary change. Am. J. Hum. Genet. 64, 18–23 (1999)
Article CAS Google Scholar - Grobet, L. et al. A deletion in the bovine myostatin gene causes the double-muscled phenotype in cattle. Nature Genet. 17, 71–74 (1997)
Article CAS Google Scholar - Ng, P. C. & Henikoff, S. Predicting deleterious amino acid substitutions. Genome Res. 11, 863–874 (2001)
Article CAS Google Scholar - Gilbert-Dussardier, B. et al. Partial duplication [dup. TCAC (178)] and novel point mutations (T125M, G188R, A209V, and H302L) of the ornithine transcarbamylase gene in congenital hyperammonemia. Hum. Mutat. 8, 74–76 (1996)
Article CAS Google Scholar - Tamir, H. & Ratner, S. Enzymes of arginine metabolism in chicks. Arch. Biochem. Biophys. 102, 249–258 (1963)
Article CAS Google Scholar - Sachidanandam, R. et al. A map of human genome sequence variation containing 1.42 million single nucleotide polymorphisms. Nature 409, 928–933 (2001)
Article ADS CAS Google Scholar - Parker, H. G. et al. Genetic structure of the purebred domestic dog. Science 304, 1160–1164 (2004)
Article ADS CAS Google Scholar - Yu, N., Jensen-Seaman, M. I., Chemnick, L., Ryder, O. & Li, W. H. Nucleotide diversity in gorillas. Genetics 166, 1375–1383 (2004)
Article CAS Google Scholar - Lindblad-Toh, K. et al. Large-scale discovery and genotyping of single-nucleotide polymorphisms in the mouse. Nature Genet. 24, 381–386 (2000)
Article CAS Google Scholar - Axelsson, E., Smith, N. G., Sundstrom, H., Berlin, S. & Ellegren, H. Male-biased mutation rate and divergence in autosomal, Z-linked and W-linked introns of chicken and turkey. Mol. Biol. Evol. 21, 1538–1547 (2004)
Article CAS Google Scholar - Mason, I. L. (ed.) Evolution of Domesticated Animals (Longman, New York, 1984)
- Arthur, J. A. & Albers, G. A. Industrial perspective on problems and issues associated with poultry breeding. In Poultry Genetics, Breeding and Biotechnology (eds Muir, W. M. & Aggrey, S. E.) 1–12 (CABI, Wallingford, 2003)
Google Scholar - Kerje, S. et al. The twofold difference in adult size between the red junglefowl and White Leghorn chickens is largely explained by a limited number of QTLs. Anim. Genet. 34, 264–274 (2003)
Article CAS Google Scholar - Crawford, R. D. (ed.) Poultry Breeding and Genetics (Elsevier, New York, 1990)
- Liljedahl, L. E., Kolstad, N., Sorensen, P. & Maijala, K. Scandinavian selection and cross-breeding experiment with laying hens. 1. Background and general outline. Acta Agricult. Scand. 29, 273–285 (1979)
Article Google Scholar - Niu, D. et al. The origin and genetic diversity of Chinese native chicken breeds. Biochem. Genet. 40, 163–174 (2002)
Article CAS Google Scholar - Ewing, B., Hillier, L., Wendl, M. C. & Green, P. Base-calling of automated sequencer traces using phred. I. Accuracy assessment. Genome Res. 8, 175–185 (1998)
Article CAS Google Scholar - Ewing, B. & Green, P. Base-calling of automated sequencer traces using phred. II. Error probabilities. Genome Res. 8, 186–194 (1998)
Article CAS Google Scholar - Altshuler, D. et al. A SNP map of the human genome generated by reduced representation shotgun sequencing. Nature 407, 513–516 (2000)
Article ADS CAS Google Scholar - Green, P. CrossMatch 〈http://www.phrap.org/phredphrapconsed.html#block_phrap〉 (2004).
- Cargill, M. et al. Characterization of single-nucleotide polymorphisms in coding regions of human genes. Nature Genet. 22, 231–238 (1999)
Article CAS Google Scholar - Caldwell, R. et al. A large collection of bursal full-length cDNA sequences to facilitate gene function analysis. Genome Biol. (in the press)
- Hubbard, S. J. et al. Transcriptome analysis for the chicken based on 19,626 finished cDNA sequences and 485,337 expressed sequence tags. Genome Res. (in the press)
- Kent, W. J. BLAT—the BLAST-like alignment tool. Genome Res. 12, 656–664 (2002)
Article CAS Google Scholar - Florea, L., Hartzell, G., Zhang, Z., Rubin, G. M. & Miller, W. A computer program for aligning a cDNA sequence with a genomic DNA sequence. Genome Res. 8, 967–974 (1998)
Article CAS Google Scholar - Wang, J. et al. ChickVD: a sequence variation database for the chicken genome. Nucleic Acids Res. (in the press)
- Berlin, S. & Ellegren, H. Chicken W—a genetically uniform chromosome in a highly variable genome. Proc. Natl Acad. Sci. USA 101, 15967–15969 (2004)
Article ADS CAS Google Scholar
Acknowledgements
Gallus gallus SNP discovery and analysis (Beijing Institute of Genomics of Chinese Academy of Sciences and James D. Watson Institute of Genome Sciences of Zhejiang University) was supported by Chinese Academy of Sciences, State Development Planning Commission, Ministry of Science and Technology, National Natural Science Foundation of China, Beijing Municipal Government, Zhejiang Provincial Government, Hangzhou Municipal Government, Zhejiang University, and China National Grid; some equipment and reagents were provided by Wellcome Trust and Sanger Institute of the UK; recent segmental duplications were analysed by G. Cheng and E. E. Eichler; Riken1 cDNAs were provided by R. B. Caldwell and J. M. Buerstedde; non-coding conserved motifs were analysed by J. Taylor and W. Miller. Gallus gallus sequence generation (Washington University School of Medicine) was supported by National Human Genome Research Institute. H.E. (Uppsala University) was supported by Swedish Research Council, Knut and Alice Wallenberg Foundation, and Royal Academy of Sciences; L.A. (Uppsala University) was supported by Wallenberg Consortium North, Foundation for Strategic Research, and Swedish Research Council for Environment, Agricultural Sciences and Spatial Planning. P.K., N.B., J.R.Y. and J.K. (Institute for Animal Health) were supported by BBSRC. S.J.L. (Iowa State University) was supported by Hatch Act and State of Iowa; bone density data for ISU resource population was collected by C. Ashwell and A. Mitchell. P.M.H., A.L., D.J.K. and D.W.B. (Roslin Institute) were supported by BBSRC; SNP genotyping was partially funded by Cobb-Vantress. USDA-ARS Avian Disease and Oncology Laboratory thank J. Kenyon and N. Evenson for technical assistance. C.P.P. (University of Oxford) was supported by UK Medical Research Council. S.J.H. (University of Manchester Institute of Science and Technology) was supported by BBSRC. S.A.W. (University of Sheffield) was supported by BBSRC. This paper is dedicated to Nat Bumstead, who died during the preparation of the manuscript. Nat was a major figure in researching the genetics of disease resistance in poultry; he worked tirelessly to realise the sequence of the chicken genome, which led in part to this consortium.
Correspondence and requests for materials should be addressed to G.K.-S.W. (gksw@genomics.org.cn), L.A. (leif.andersson@imbim.uu.se) or H.Y. (hyang@genomics.org.cn). The individual SNPs are deposited at GenBank/dbSNP with submitted SNP number ranges 24821291–24922086, 24922088–26161960, 26161962–28446123 and 28452569–28452598. They may also be found at http://chicken.genomics.org.cn47, the UCSC genome browser and the Ensembl genome browser. Access to raw sequencing traces is provided through the NCBI Trace Archive.
Author information
Author notes
- Gane Ka-Shu Wong, Bin Liu, Jun Wang, Yong Zhang, Xu Yang and Jun Yu: These authors contributed equally to this work
Authors and Affiliations
- Beijing Institute of Genomics of Chinese Academy of Sciences, Beijing Genomics Institute, Beijing Proteomics Institute, 101300, Beijing, China
Gane Ka-Shu Wong, Bin Liu, Jun Wang, Yong Zhang, Xu Yang, Zengjin Zhang, Qingshun Meng, Jun Zhou, Dawei Li, Jingjing Zhang, Peixiang Ni, Songgang Li, Heng Li, Jianguo Zhang, Ruiqiang Li, Shengting Li, Hongkun Zheng, Wei Lin, Guangyuan Li, Xiaoling Wang, Wenming Zhao, Jun Li, Chen Ye, Mingtao Dai, Jue Ruan, Yuanzhe Li, Ximiao He, Yunze Zhang, Jing Wang, Xiangang Huang, Wei Tong, Jie Chen, Jia Ye, Chen Chen, Ning Wei, Guoqing Li, Le Dong, Fengdi Lan, Yongqiao Sun, Zhenpeng Zhang, Zheng Yang, Yanqing Huang, Dandan He, Yan Xi, Dong Wei, Qiuhui Qi, Wenjie Li, Jianping Shi, Miaoheng Wang, Fei Xie, Jianjun Wang, Xiaowei Zhang, Pei Wang, Wei Dong, Songnian Hu, Changqing Zeng, Weimou Zheng, Bailin Hao, Jun Yu, Jian Wang & HuanMing Yang - James D. Watson Institute of Genome Sciences of Zhejiang University, Hangzhou Genomics Institute, Key Laboratory of Genomic Bioinformatics of Zhejiang Province, 310008, Hangzhou, China
Gane Ka-Shu Wong, Jun Wang, Yan Zhou, Jia Ye, Yingpu Yu, Jun Yu, Jian Wang & HuanMing Yang - UW Genome Center, Department of Medicine, University of Washington, Seattle, Washington, 98195, USA
Gane Ka-Shu Wong - College of Life Sciences, Peking University, 100871, Beijing, China
Yong Zhang, Songgang Li & Jing Wang - Beijing North Computation Center, 100091, Beijing, China
Longhua Ran - The Institute of Theoretical Physics, Chinese Academy of Sciences, 100080, Beijing, China
Heng Li, Weimou Zheng & Bailin Hao - China Agricultural University, 100094, Beijing, China
Yiqiang Zhao, Ning Li & Ning Yang - Genome Sequencing Center, Washington University School of Medicine, Campus Box 8501, 4444 Forest Park Avenue, St Louis, Missouri, 63108, USA
LaDeana W. Hillier, Shiaw-Pyng Yang, Wesley C. Warren & Richard K. Wilson - Department of Evolutionary Biology, Evolutionary Biology Centre, Uppsala University, Norbyvägen 18D, SE-752 34, Uppsala, Sweden
Mikael Brandström & Hans Ellegren - Animal Breeding and Genetics Group, Wageningen University, Marijkewg 40, 6709 PG, Wageningen, The Netherlands
Richard P. M. A. Crooijmans, Jan J. van der Poel, Henk Bovenhuis & Martien A. M. Groenen - Genome Biology Division, Lawrence Livermore National Laboratory, Livermore, California, 94550, USA
Ivan Ovcharenko, Laurie Gordon & Lisa Stubbs - Energy, Environment, Biology and Institutional Computing, Lawrence Livermore National Laboratory, Livermore, California, 94550, USA
Ivan Ovcharenko - DOE Joint Genome Institute, Walnut Creek, California, 94598, USA
Laurie Gordon, Susan Lucas, Tijana Glavina & Andrea Aerts - Institute for Animal Health, RG20 7NN, Berkshire, Compton, UK
Pete Kaiser, Lisa Rothwell, John R. Young, Sally Rogers, Brian A. Walker, Andy van Hateren, Jim Kaufman & Nat Bumstead - Department of Animal Science, Iowa State Univeristy, Ames, Iowa, 50011, USA
Susan J. Lamont & Huaijun Zhou - Roslin Institute (Edinburgh), Roslin, Midlothian, EH25 9PS, UK
Paul M. Hocking, David Morrice, Dirk-Jan de Koning, Andy Law, Neil Bartley & David W. Burt - USDA-ARS Avian Disease and Oncology Laboratory, 3606 E. Mount Hope Road, East Lansing, Michigan, 48823, USA
Henry Hunt & Hans H. Cheng - Department of Medical Biochemistry and Microbiology, Uppsala University, Box 597, SE-751 24, Uppsala, Sweden
Ulrika Gunnarsson, Per Wahlberg & Leif Andersson - Department of Animal Breeding and Genetics, Swedish University of Agricultural Sciences, SE-751 24, Uppsala, Sweden
Leif Andersson - Center for Genomics and Bioinformatics, Karolinska Institutet, SE-171 77, Stockholm, Sweden
Ellen Kindlund, Martti T. Tammi & Björn Andersson - Departments of Biological Sciences and Biochemistry, National University of Singapore, Singapore
Martti T. Tammi - MRC Functional Genetics Unit, University of Oxford, Department of Human Anatomy and Genetics, South Parks Road, OX1 3QX, Oxford, UK
Caleb Webber & Chris P. Ponting - Department of Biomolecular Sciences, University of Manchester Institute of Science and Technology, PO Box 88, M60 1QD, Manchester, UK
Ian M. Overton, Paul E Boardman, Haizhou Tang & Simon J. Hubbard - Department of Molecular Biology and Biotechnology, University of Sheffield, Firth Court, Western Bank, S10 2TN, Sheffield, UK
Stuart A. Wilson
Consortia
International Chicken Polymorphism Map Consortium
Polymorphism discovery and analysis: Beijing Institute of Genomics of Chinese Academy of Sciences and James D. Watson Institute of Genome Sciences of Zhejiang University
- Gane Ka-Shu Wong
- , Bin Liu
- , Jun Wang
- , Yong Zhang
- , Xu Yang
- , Zengjin Zhang
- , Qingshun Meng
- , Jun Zhou
- , Dawei Li
- , Jingjing Zhang
- , Peixiang Ni
- , Songgang Li
- , Longhua Ran
- , Heng Li
- , Jianguo Zhang
- , Ruiqiang Li
- , Shengting Li
- , Hongkun Zheng
- , Wei Lin
- , Guangyuan Li
- , Xiaoling Wang
- , Wenming Zhao
- , Jun Li
- , Chen Ye
- , Mingtao Dai
- , Jue Ruan
- , Yan Zhou
- , Yuanzhe Li
- , Ximiao He
- , Yunze Zhang
- , Jing Wang
- , Xiangang Huang
- , Wei Tong
- , Jie Chen
- , Jia Ye
- , Chen Chen
- , Ning Wei
- , Guoqing Li
- , Le Dong
- , Fengdi Lan
- , Yongqiao Sun
- , Zhenpeng Zhang
- , Zheng Yang
- , Yingpu Yu
- , Yanqing Huang
- , Dandan He
- , Yan Xi
- , Dong Wei
- , Qiuhui Qi
- , Wenjie Li
- , Jianping Shi
- , Miaoheng Wang
- , Fei Xie
- , Jianjun Wang
- , Xiaowei Zhang
- , Pei Wang
- , Yiqiang Zhao
- , Ning Li
- , Ning Yang
- , Wei Dong
- , Songnian Hu
- , Changqing Zeng
- , Weimou Zheng
- & Bailin Hao
Genome sequence of red jungle fowl: Washington University School of Medicine
- LaDeana W. Hillier
- , Shiaw-Pyng Yang
- , Wesley C. Warren
- & Richard K. Wilson
Molecular evolution: Uppsala University
- Mikael Brandström
- & Hans Ellegren
Population genotyping, BAC sequences and haplotypes: Wageningen University
- Richard P. M. A. Crooijmans
- , Jan J. van der Poel
- , Henk Bovenhuis
- & Martien A. M. Groenen
Lawrence Livermore National Laboratory
- Ivan Ovcharenko
- , Laurie Gordon
- & Lisa Stubbs
DOE Joint Genome Institute
- Susan Lucas
- , Tijana Glavina
- & Andrea Aerts
Examples of application to complex traits: Institute for Animal Health
- Pete Kaiser
- , Lisa Rothwell
- , John R. Young
- , Sally Rogers
- , Brian A. Walker
- , Andy van Hateren
- , Jim Kaufman
- & Nat Bumstead
Iowa State University
- Susan J. Lamont
- & Huaijun Zhou
Roslin Institute
- Paul M. Hocking
- , David Morrice
- , Dirk-Jan de Koning
- , Andy Law
- , Neil Bartley
- & David W. Burt
USDA-ARS Avian Disease and Oncology Laboratory
- Henry Hunt
- & Hans H. Cheng
Domestication and selection: Uppsala University
- Ulrika Gunnarsson
- , Per Wahlberg
- & Leif Andersson
Karolinska Institutet
- Ellen Kindlund
- , Martti T. Tammi
- & Björn Andersson
Human disease genes: University of Oxford
- Caleb Webber
- & Chris P. Ponting
EST-based SNP data: University of Manchester Institute of Science and Technology
- Ian M. Overton
- , Paul E Boardman
- , Haizhou Tang
- & Simon J. Hubbard
University of Sheffield
- Stuart A. Wilson
Scientific management: Beijing Institute of Genomics of Chinese Academy of Sciences
- Jun Yu
- , Jian Wang
- & HuanMing Yang
Ethics declarations
Competing interests
The authors declare that they have no competing financial interests.
Additional information
(Group contributions are listed by their order of appearance in the manuscript.)
Supplementary information
Supplementary Methods
Includes polymorphism detection, functional assessment, genotyping in populations, domestication analysis and additional references. This file also contains Supplementary Tables S1–S5 and their legends. (PDF 84 kb)
Supplementary Discussion
Discussions on: QTL fine mapping of entire chromosome; QTL mapping to a specific region; application of SNPs for candidate gene association. Also includes Supplementary Tables S6–12 and Supplementary Figures S1 and S2. Also contains additional references. (PDF 177 kb)
Supplementary Data
Additional details to accompany Supplementary Table 3. (XLS 94 kb)
Rights and permissions
About this article
Cite this article
International Chicken Polymorphism Map Consortium. A genetic variation map for chicken with 2.8 million single-nucleotide polymorphisms.Nature 432, 717–722 (2004). https://doi.org/10.1038/nature03156
- Received: 22 July 2004
- Accepted: 01 November 2004
- Issue Date: 09 December 2004
- DOI: https://doi.org/10.1038/nature03156