Mouse genomic variation and its effect on phenotypes and gene regulation (original) (raw)
Main
Until the end of the 20th century the molecular basis for morphological, physiological, biochemical and behavioural variation in laboratory mice remained largely obscure1,2,3. At the beginning of the 21st century, decoding the complete genome of one strain, C57BL/6J, the mouse reference genome, revolutionized our ability to relate sequence to function4,5. It enabled genetic screens in mice to be performed on an unprecedented scale6, it facilitated the task of creating a complete set of null alleles for all genes7,8, and it accelerated the discovery of mouse sequence diversity9,10.
Our catalogues, however, remain incomplete and some forms of variation are largely undocumented. Whereas we now know more about the extent of phenotypic variation among laboratory strains of mice11,12,13,14,15,16 and the complexity of genetic action, from fully penetrant Mendelian effects, partially penetrant modifiers17,18 and non-additive effects18, to the quasi-infinitesimal genetic architecture that underlies most quantitative traits19, we are still largely ignorant of the molecular basis of the majority of genetically influenced phenotypes.
Here we describe the generation and analysis of sequence from 17 key mouse genomes, obtained using next-generation sequencing20,21. The genomes include those of the classical laboratory strains C3H/HeJ, CBA/J, A/J, AKR/J, DBA/2J, LP/J, BALB/cJ, NZO/HlLtJ and NOD/ShiLtJ, and those of four wild-derived inbred strains CAST/EiJ, PWK/PhJ, WSB/EiJ and SPRET/EiJ, which include the progenitors of the common laboratory strains and are representative of the Mus musculus castaneus, Mus musculus musculus, Mus musculus domesticus and Mus spretus taxa, respectively. We also sequenced three related 129-strains, (129S5SvEvBrd, 129P2/OlaHsd and 129S1/SvImJ) representing the genetic backgrounds on which more than 5,000 knockout mice have been generated22 and C57BL/6NJ, the strain used by the genome-wide knockout programmes KOMP, NorCOMM and EUCOMM7,8,22. Collectively the sequences of these strains capture the genomes of most of the commonly used strains of mice and their progenitors14,23,24,25.
We document the variation we have discovered, describe the distribution of variants between strains, and explore the evolutionary origins of the subspecies that gave rise to the laboratory mouse. Using two examples we demonstrate how the sequence can be used to investigate the molecular origins of phenotypic variation. First, we use sequence variation to assay allele-specific variation in gene expression. We show how, in combination with a measure of activity at gene promoters, it is possible to implicate functional variants in gene expression regulation. Second, we explore the molecular basis of quantitative traits. We ask whether functional variants responsible for quantitative variation have common molecular features, in terms of their position (inside or outside genes) and their molecular class (single nucleotide polymorphisms (SNPs), indels or structural variants).
Data generation and variant discovery
Figure 1 and Table 1 summarize the sequence generated and the variants discovered. We defined all sequence as either the same as, or different from, that of the reference strain (C57BL/6J; MGSCv37 assembly) and we report our results with respect to an accessible genome: those sites to which sequence reads can be uniquely mapped with mapping qualities greater than 40 (Supplementary Methods). This represented on average 83.8% of the reference genome and 94.7% of coding sequence of each strain.
Figure 1: An overview of variants called from 17 mouse genomes relative to the reference.
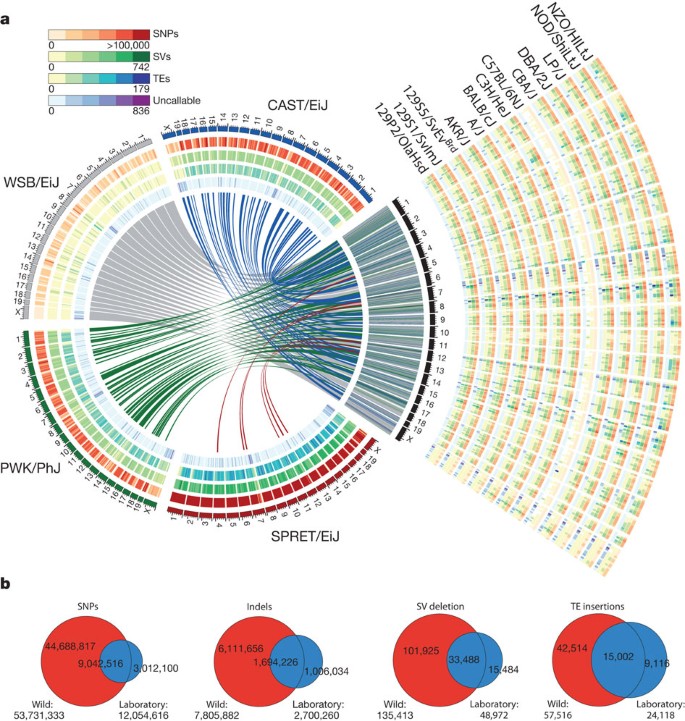
a, The four wild-derived strains (CAST/EiJ, WSB/EiJ, PWK/PhJ and SPRET/EiJ) are representative of the Mus musculus castaneus, Mus musculus musculus, Mus musculus domesticus and Mus spretus taxa and include the progenitors from which the classical laboratory strains were derived. These genomes are shown in a circle with tracks indicating the relative density of SNPs, structural variants (SVs) and uncallable regions (binned into 10-Mb regions). Transposable element (TE) insertions, which are a subset of the structural variant calls, are shown as a separate track. Corresponding tracks are shown for each of the 13 classical laboratory strains to the right of the circle. Links crossing the circle indicate regions on the reference where the wild-derived strain is closest to the reference (375-kb bins). b, The numbers inside the Venn diagrams indicate the number of SNPs, indels, structural variant deletions and transposable element insertions in the wild-derived and classical laboratory strains. The numbers beneath each Venn diagram indicate totals for each type of variant in the wild and classical laboratory strains.
Table 1 An overview of the sequence and variants called from 17 mouse genomes.
Between 13% and 23% of each genome is inaccessible (Table 1 and Supplementary Figs 1–17). The higher proportion of inaccessible regions in the wild-derived strains indicates that divergence from the mouse reference is a major contributor to inaccessibility. In the accessible mouse genome, we identified 56.7 million (M) unique SNPs, 8.8M unique indels and 0.28M structural variants including 0.07M transposable element insertion sites (Table 1).
The sensitivity and specificity of our variant calls were established using 17.5 million bases (Mb) of DNA from one non-reference strain (NOD/ShiLtJ) that we generated with established sequencing technology. We sequenced 107 bacterial artificial chromosomes (BACs)26 spread over loci on chromosomes 1, 6, 11 and 17. The sequence has an estimated accuracy of one error per 100,000 base pairs (bp). We aligned 16.2 Mb of the BAC sequence to the MGSCv37 mouse reference and from that estimated that 3.6% of our next-generation-derived NOD/ShiLtJ SNP calls were false positives, and 6.5% were false negatives. We compared our genotype calls to those in public databases and found over 99.4% and 99.1% agreement with the two largest SNP data sets (Perlegen9 and dbSNP27). However, we also found that these data sets have large false-negative rates of 83.7% and 84.1%, respectively.
We identified far fewer indels (1–100 bp) than SNPs and with lower confidence (Table 1). We relied for validation on comparison with the NOD/ShiLtJ BAC sequences and estimated false-positive and -negative rates to be 2.2% and 20.1%, respectively. Collectively, we estimate an average of 2.61 sequence errors per 10 kilobases (kb) of accessible sequence, an accuracy of 99.97% in NOD/ShiLtJ, which should extend to the other sequenced strains.
We used the NOD/ShiLtJ BAC sequence to estimate how many variants are contained within inaccessible regions. We found that the BAC sequence in inaccessible regions has approximately 2.8 times more SNPs per base than the rest of the BAC sequence. Sequence reads could not be unambiguously mapped to these regions, resulting in missed variant calls. An analysis of the content of the inaccessible sequence is provided in Supplementary Table 1. Our analysis of the NOD/ShiLtJ BAC sequence implies that at least 30% of all SNPs in the genomes of the strains we sequenced remain to be discovered. The majority of these SNPs are located in intergenic regions of the genome. In addition to homozygous SNP positions we also called 5.2M heterozygous positions. These result from misalignments around indels and structural variant breakpoints, duplicated loci and low depth positions.
We called 0.71M structural variants >100 bp (0.41M simple deletions, 0.29M simple insertions, 2,100 inversions, 1,556 copy number gains and 3,658 complex structural variants) (Table 1 and Fig. 1) at 0.28M positions, as described in our accompanying paper28. On average 48.4 Mb of sequence of each strain falls into structurally variant regions of the genome (33 Mb for the laboratory strains and 98.2 Mb for wild-derived strains). Structural variants cluster with SNPs in each strain (Supplementary Fig. 1–17), indicating that the vast majority of these events may be ancestral in origin. This may also reflect high rates of polymorphism consequent to break-induced replication involved in the production of a structural variant29. Only 7.5% of structural variants were private to one of the classical laboratory strains.
Functional variants
We identified 0.12M SNP positions in protein-coding sequence that lead to amino acid changes (non-synonymous substitutions) and 0.26M that do not (synonymous substitutions). In total 2,051 stop codons across all strains and transcripts were discovered, an average of 85 for the classical laboratory strains and 251 for the wild-derived strains. Supplementary Fig. 18 shows the distribution of these variants across the strains. Non-synonymous changes are seen, on average, every 1,454 codons, and rarely cluster. Extreme variation, however, occurs within a coding exon of Prdm9, a ‘speciation gene’30, whose zinc-finger-encoding domains vary greatly across the sequenced strains (Supplementary Fig. 19). By sequencing RNA we confirmed 99.84% of the coding SNPs that were covered by 10 or more RNA-Seq reads in expressed genes (Supplementary Table 2).
Some functional variants previously reported in one strain were found for the first time in others. In LP/J mice we identified a mutation in the DNA polymerase iota (Poli) gene. This premature stop codon, which ablates gene function, has previously been identified in 129-derived mice (MMU18:70688442)31. We also discovered that a mutation in Disc1, known in 129-derived mice and associated with a deficit in working memory32, is also present in LP/J. Further, we discovered a truncating mutation (MMU10:53345838) in the mini-chromosome maintenance gene Mcm9 (ref. 33) in SPRET/EiJ. This gene is thought to have an important role in replication, suggesting functional redundancy or the existence of a paralogous gene in SPRET/EiJ.
Variation between mouse strains
The classical laboratory strains of mice carried relatively few private variants (∼2% of all variants called in each strain) (Table 1). These variants were distributed genome-wide, indicating that they had either arisen since the divergence of these strains (Supplementary Fig. 1–17), or are errors. We observed significant differences in transposable element families across the laboratory and wild-derived strains (Fig. 1). Transposon element variants (TEVs) were found to be depleted near transcriptional start sites, in or near exons, and long interspersed nuclear element (LINE) variants were depleted within the introns of transcription factor genes. Within introns, we find a significantly reduced number of endogenous retroviral (ERV) TEVs that are inserted in the sense transcriptional orientation.
Loci that are absent from the C57BL/6J reference genome are difficult to access. We identified 424 Mb of novel sequence (contigs >100 bp; 48.4 Mb for contigs >1 kb)(Supplementary Fig. 20). Unsurprisingly, more is found in the wild-derived strains than in the classical laboratory strains, which are largely derived from a common pool of founders. Of the novel sequence 20.4 Mb aligned with the Celera mixed strain assembly34 and other mouse sequence not present in the reference genome; 562.9 kb mapped to the rat reference genome and 18.9 kb to the rabbit reference. About 30 Mb of novel sequence was conserved across multiple strains (Supplementary Fig. 20).
The phylogenetic history of the mouse
We used the accessible sequences of the wild-derived strains to explore the evolutionary history of the primary subspecies that gave rise to the laboratory mouse. We conducted a Bayesian concordance analysis35 with the sequences of M. m. musculus (PWK/PhJ), M. m. domesticus (WSB/EiJ), M. m. castaneus (CAST/EiJ) and M. spretus (SPRET/EiJ), using rat as an outgroup.
We observed substantial phylogenetic discordance across the genomes of M. m. musculus, M. m. domesticus and M. m. castaneus (Fig. 2). In the face of this discordance, we identified a M. m. musculus/M. m. castaneus primary subspecies history (concordance factor (CF) = 37.9%; 95% credibility interval (CI) = 37.8–38.0%). The two other possible histories were supported by equal numbers of loci (CF = 30.3%; 95% CI = 30.2–30.4%; and CF = 30.2%; 95% CI = 30.1–30.3%), closely matching expectations from theoretical models of incomplete lineage sorting36,37,38. Phylogenetic switching occurs over a short physical scale, in rough agreement with the spatial pattern of linkage disequilibrium in natural populations of house mice39, and median locus sizes parallel the three phylogenetic histories (primary history, 40,975 bp; alternative histories, 33,626 bp and 33,412 bp). Despite its considerable divergence time from house mice, we also found phylogenetic discordance involving M. spretus: 12.1% of loci did not place this species as the outgroup to a M. musculus subspecies clade.
Figure 2: Genomic partitioning of phylogenetic history.
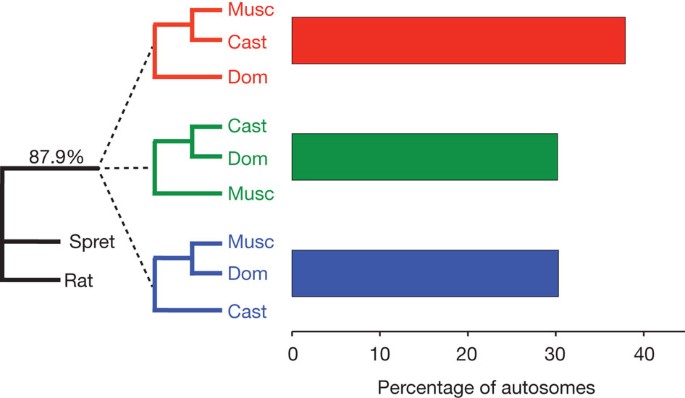
Bayesian concordance factors were estimated from 43,255 individual locus trees. 87.9% of loci place M. spretus (Spret) and rat as the outgroup to the M. musculus subspecies. Within M. musculus, there is a primary history supporting a M. m. musculus (Musc)/M. m. castaneus (Cast) sister relationship (37.9%) with M. m. domesticus (Dom) branching off first. The two alternative topologies are supported by equal percentages of the genome (30.3% and 30.2%). 95% credibility intervals on all estimates are ± 0.1%.
Allele-specific functional differences
We combined a measure of allele-specific variation with a measure of activity at gene promoters to implicate functional variants. Sequencing RNA from an F1 hybrid of two sequenced strains and assaying the relative abundance of allelic variants in transcripts makes it possible to assess the variation in gene expression. We sequenced RNA from six tissues (liver, thymus, spleen, lung, hippocampus and heart (Supplementary Table 2)) obtained from an F1 generated by crossing the reference strain (C57BL/6J) with one sequenced strain (DBA/2J). A total of 40,521 SNP positions were covered by RNA reads spread over 15,884 genes (≥1 read per gene), of which 6,975 had at least 20 reads crossing SNP positions40.
We define allelic bias as the proportion of expression attributable to a particular parental strain, ranging from 0 to 1, with the null hypothesis of 0.5 in the absence of any bias. Due to the very high abundance of RNA sequence data and of SNPs within many genes revealed by whole genome sequencing, many (41%) loci show a significant bias towards one or other allele in at least one tissue; 12% of all loci showed a substantial expression bias (expression below 25% or above 75% of the reference allele).
Figure 3 shows the distribution of allele-specific biases between tissue pairs at the gene level and Supplementary Table 3 shows the concordance of allele-specific biases for each pair of tissues examined. 2,871 genes were found to be significantly different (0.01 false discovery rate, FDR) in at least one tissue pair (Supplementary Table 4). Most differences (95%) between tissues were due to biased allelic expression occurring in one tissue only. However, 336 (4.8%) of tested transcripts showed a different pattern: they show a biased allelic expression in more than one tissue, but the bias occurs in opposing directions. One example is the Phb gene: in liver, 76% of informative reads derive from the C57BL/6J haplotype, but in spleen the figure is just 39%.
Figure 3: Allele-specific biases in RNA expression levels between tissues from C57BL/6J x DBA/2J F1 mice.
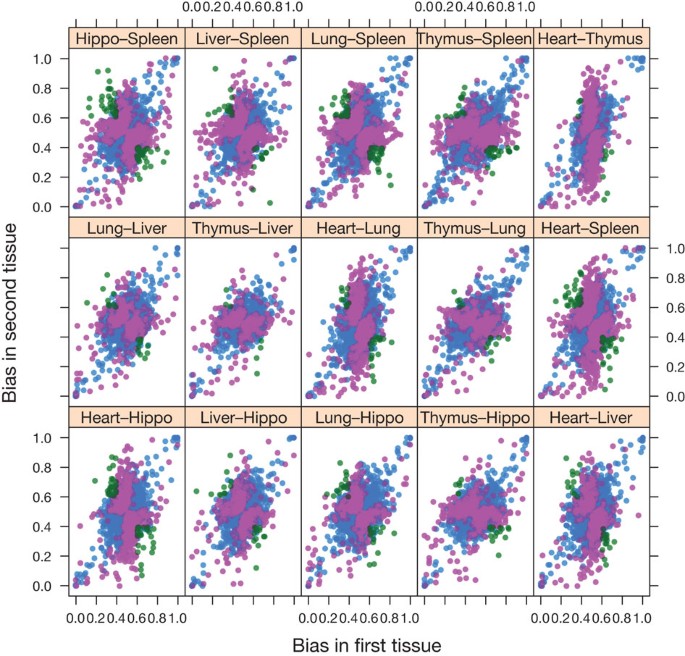
RNA was sequenced from six tissues: hippocampus (hippo), spleen, liver, heart, lung and thymus. Each point represents a gene, and the bias ranges from 1.0 (exclusively C57BL/6J) to 0.0 (exclusively DBA/2J). The tissue comparison is shown above each plot. The points are coloured by whether the difference in bias is not significant (blue), significantly different bias but in the same direction (pink) or significantly different but switching direction (green).
Genes showing divergent allele-specific patterns between tissues were clustered into different functional classes using the DAVID tool41. Among such genes, those encoding proteins found in mitochondria are significantly enriched between liver and spleen (FDR = 9.5 × 10⁻⁶), as are cell cycle genes between thymus and spleen (FDR = 3.4 × 10⁻⁴), indicating that allele-specific biases are related to the functional program occurring in these tissues.
To characterize the molecular source of allele-specific biases we sequenced DNA from liver bound to chromatin precipitated by a marker for active gene promoters (histone 3, lysine 4 trimethylation; H3K4me3). Of 19,258 SNPs in these ChIP-Seq (chromatin immunoprecipitation followed by sequencing) reads with greater than seven informative reads for H3K4me3, 386 (2%) showed a significant allelic bias. There was unsurprisingly a highly significant correlation between allelic biases of H3K4me3 in the promoters of genes with allelic expression biases (P < 10−10). Histone modification of promoter regions, as opposed to other parts of genes, is most predictive of transcriptional bias (Spearman’s rho = 0.29), particularly so for the strongly biased genes, showing below 25% or above 75% of the reference allele expression (Spearman’s rho = 0.67). Therefore, we have been able to identify genes where differences in _cis_-regulatory promoter sequence between C57BL/6J and DBA/2J are likely to contribute significantly to allele-specific expression biases. With access to the genome sequences, we can use the functionally defined cis sequence variants to identify the important regulatory elements.
Molecular basis of quantitative traits
We used the complete genome sequence of multiple inbred strains to address a key challenge in complex trait genetics: the identification of sequence variants that underlie quantitative traits. We asked whether functional variants have common molecular features, and if they were more likely to lie within genes or outside them, and to comprise structural variants, indels or SNPs. We tested the hypothesis that quantitative trait loci (QTLs) with large effects (expressed as the percentage of total phenotypic variation attributable to the locus) are more likely to consist of certain categories of sequence variant.
We examined this relationship using 843 QTLs identified in over 2,000 heterogeneous stock mice, animals that are descended from eight of the sequenced strains (A/J, AKR/J, BALB/cJ, C3H/HeJ, C57BL/6J, CBA/J, DBA/2J and LP/J)24. Because many recombinants have accumulated in the heterogeneous stock since its creation, the QTLs are resolved to an average genomic size of 3 Mb. The 100 traits mapped include disease models (asthma, anxiety and type 2 diabetes), as well as haematological, immunological, biochemical and anatomical phenotypes24,42.
We imputed the genotypes of the heterogeneous stock mice for all variants and then applied a test that discriminates between variants that could be functional and those that are not43. At each variant we compared two models. In one (the haplotype model) the effect on the QTL was modelled with eight alleles (representing each of the founder haplotypes). In the second, the effect on the QTL was modelled with the number of alleles of the variant (usually two for a SNP). At 718 QTLs (85%) there was at least one variant where the fit of the allelic model was better than a haplotype based model44. This implies that, at these QTLs, there is either a single functional variant, or a series of functional variants on the same haplotype. The median number of variants per QTL with a merge _P_-value exceeding the minimum haplotype _P_-value was 7; we refer to these variants as functional variants. At 10% of QTLs there is a single functional variant so defined.
We asked whether functional variants are more likely to occur in certain locations relative to genes and whether they are more likely to belong to certain molecular classes. Suppose at a QTL we classify 0.1% of the variants as potentially functional. If there is no relationship between the position of a gene and a functional variant, we expect 0.1% of the variants within genes to be classified as functional. We calculated the ratio of the percentage of functional variants at a QTL over the percentage of variants in five locations relative to genes: intergenic, exonic, intronic or flanking (upstream or downstream lying within 2 kb of the transcriptional start or end sites). Ratios greater than 1 indicate that functional variants are enriched in a classification and less than 1 indicate relative deficiency. We calculated the significance of the ratios’ departure from 1 empirically (Table 2). We carried out a similar analysis of molecular categories, comparing SNPs, structural variants, indels and coding polymorphisms predicted to be harmful to protein function.
Table 2 The molecular nature of sequence variants and their effect on phenotypic variation.
Figure 4 shows results for 718 QTLs, grouped by effect size (the percentage of phenotypic variance attributed to the QTL) so that each group contains approximately 100 QTLs. We also show results for the 22 largest effect QTLs (explaining more than 10% of the variance). Table 2 shows the results of testing for significant differences between large effect (>4%) and small effect (<4%) QTLs.
Figure 4: Enrichment of functional variants.
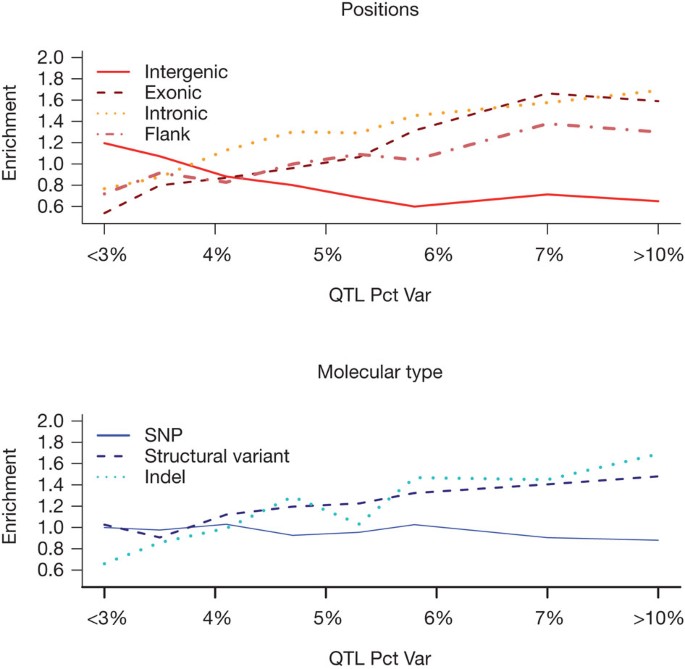
Each line shows the ratio of the percentage of functional variants at a QTL over the percentage of variants expected. Ratios greater than one indicate that functional variants are enriched in a classification and ratios less than one indicate a dearth of functional variants. Functional variants are classified by their position relative to a gene and by their molecular class: SNPs, structural variants and insertion/deletions (indels) polymorphisms.
Functional variants at small effect QTLs are significantly more likely to be intergenic and less likely to be a structural variant; by contrast, functional variants at large effect QTLs are significantly less likely to be intergenic, and more likely to be intronic. However, it is only with the 3% of QTLs that explain more than 10% of the phenotypic variance that we find significant enrichment for coding variants predicted to be detrimental. These latter QTLs are significantly more likely to arise from indels and structural variants. Our analysis therefore indicates that both the position and molecular nature of quantitative trait variants influence the effect size of the QTL.
Discussion
The sequence we have obtained has a number of notable features. First is the sheer magnitude of the number of variants we have found. An earlier catalogue, based on re-sequencing by hybridization to oligonucleotide arrays, identified SNPs at 8.3M unique sites in 15 strains9; our total count in 17 strains is 56.7M unique sites. In addition, our catalogue includes other types of sequence polymorphism that have previously been difficult to assess on a genome-wide scale: indels at 8.8M unique sites and 0.28M structural variants.
Second, we have estimated the false positive and false negative rates by exploiting 17.5 Mb of very high quality sequence from one non-reference strain. We should caution, however, that the BAC sequences were not chosen randomly from the genome; their collinearity when mapped back to the reference genome indicates that they do not lie in regions replete with structural variation for example. Importantly, access to the BAC sequence tells us what the new sequencing technology misses, information currently lacking for other vertebrate sequence projects. We find that inaccessible regions contain almost three times the amount of sequence variation expected from the rate observed in the accessible regions. This observation, gained from the analysis of inbred genomes that represent a best-case scenario for variant calling, has important implications for the whole genome sequencing of outbred populations such as humans, where variant calling is significantly more difficult.
What use is the current catalogue of variants? First, simply knowing the distribution of variants across the genomes of the sequenced strains is important. The short evolutionary timescale of domestication suggests that many genetic differences among classical inbred strains originated in natural populations. Our phylogenetic analyses both confirm that M. m. musculus and M. m. castaneus are sister subspecies45 and demonstrate that wild mouse genomes are complex mosaics of alternative evolutionary histories. Widespread phylogenetic discordance indicates that polymorphisms are often shared among subspecies, challenging the assignment of subspecific ancestry across the genomes of the classical inbred strains. Our results further suggest that M. spretus is not a reliable outgroup for determining the ancestral state of house mice in some genomic regions. Analyses of genome sequences from larger numbers of wild mice will provide a more detailed understanding of the origins of laboratory mice.
A second use of our catalogue is for exploring the relationship between genotype and phenotype. We have demonstrated this with two examples. By examining six tissues in a single cross (C57BL/6J × DBA/2J) we were able to detect high levels of allelic bias at 12% of expressed loci. Furthermore, 4.8% of tested transcripts showed divergent allele-specific patterns between tissues: the allele that is relatively highly expressed in one tissue is relatively under-expressed in a second tissue. Again using our catalogue, and the genome sequences reported here, we have begun to identify the molecular basis for this complex pattern of gene regulation. Further analysis and functional studies will allow us to identify the exact sequence differences responsible for these allelic expression differences.
We also show that the molecular nature of sequence variants and their position relative to genes influence the likelihood that they are functional. Using a statistical method to predict whether the allelic pattern of a variant is consistent with its action as the molecular cause of quantitative trait variation, we are able to show that functional variants contributing to small effect QTLs are significantly more likely to be intergenic; by contrast, larger effect QTLs are more likely to be caused by intronic variants, and are significantly less likely to be intergenic.
Together with the accumulated phenotypic information on inbred strains, provided by the Mouse Phenome Project, the sequence of the 17 mouse genomes and the associated catalogue of variants will serve as a basis for understanding trait differences, and will allow further insights into the nature of functional variants. Furthermore, near complete sequence will make it possible to impute the genomes of any derivative of the sequenced strains, including the Collaborative Cross23, a large set of recombinant inbred strains to be used for high-resolution mapping of multiple complex phenotypes. Collectively, the sequence we describe here will help dissect the path from sequence variant to phenotype.
Methods Summary
The Supplementary Information provides full details of samples, data generation protocols, read mapping, SNP calling, short insertion and deletion calling, structural variation calling and all other computational methods.
Accession codes
Data deposits
Genomic structural variant study data is deposited in dbSNP (Handle: SC_MOUSE_GENOMES) and DGVa (estd118). Sequence accession numbers are provided in the Supplementary Information.
References
- Paigen, K. One hundred years of mouse genetics: an intellectual history. II. The molecular revolution (1981–2002). Genetics 163, 1227–1235 (2003)
CAS PubMed PubMed Central Google Scholar - Paigen, K. One hundred years of mouse genetics: an intellectual history. I. The classical period (1902–1980). Genetics 163, 1–7 (2003)
CAS PubMed PubMed Central Google Scholar - Dietrich, W. F. et al. Genetic identification of Mom-1, a major modifier locus affecting _Min_-induced intestinal neoplasia in the mouse. Cell 75, 631–639 (1993)
Article CAS Google Scholar - Church, D. M. et al. Lineage-specific biology revealed by a finished genome assembly of the mouse. PLoS Biol. 7, e1000112 (2009)
Article Google Scholar - Waterston, R. H. et al. Initial sequencing and comparative analysis of the mouse genome. Nature 420, 520–562 (2002)
Article ADS CAS Google Scholar - van der Weyden, L., Adams, D. J. & Bradley, A. Tools for targeted manipulation of the mouse genome. Physiol. Genomics 11, 133–164 (2002)
Article CAS Google Scholar - Ringwald, M. et al. The IKMC web portal: a central point of entry to data and resources from the International Knockout Mouse Consortium. Nucleic Acids Res. 39, D849–D855 (2011)
Article CAS Google Scholar - Skarnes, W. C. et al. A conditional knockout resource for the genome-wide study of mouse gene function. Nature 474, 337–342 (2011)
Article CAS Google Scholar - Frazer, K. A. et al. A sequence-based variation map of 8.27 million SNPs in inbred mouse strains. Nature 448, 1050–1053 (2007)
Article ADS CAS Google Scholar - Quinlan, A. R. et al. Genome-wide mapping and assembly of structural variant breakpoints in the mouse genome. Genome Res. 20, 623–635 (2010)
Article CAS Google Scholar - Gale, G. D. et al. A genome-wide panel of congenic mice reveals widespread epistasis of behavior quantitative trait loci. Mol. Psychiatry 14, 631–645 (2009)
Article CAS Google Scholar - Iakoubova, O. A. et al. Genome-tagged mice (GTM): two sets of genome-wide congenic strains. Genomics 74, 89–104 (2001)
Article CAS Google Scholar - Bennett, B. J. et al. A high-resolution association mapping panel for the dissection of complex traits in mice. Genome Res. 20, 281–290 (2010)
Article CAS Google Scholar - Singer, J. B. et al. Genetic dissection of complex traits with chromosome substitution strains of mice. Science 304, 445–448 (2004)
Article ADS CAS Google Scholar - Shao, H. et al. Analyzing complex traits with congenic strains. Mamm. Genome 21, 276–286 (2010)
Article Google Scholar - Hunter, K. W. & Crawford, N. P. The future of mouse QTL mapping to diagnose disease in mice in the age of whole-genome association studies. Annu. Rev. Genet. 42, 131–141 (2008)
Article CAS Google Scholar - Rozmahe, R. et al. Modulation of disease severity in cystic fibrosis transmembrane conductance regulator deficient mice by a secondary genetic factor. Nature Genet. 12, 280–287 (1996)
Article Google Scholar - Shao, H. et al. Genetic architecture of complex traits: large phenotypic effects and pervasive epistasis. Proc. Natl Acad. Sci. USA 105, 19910–19914 (2008)
Article ADS CAS Google Scholar - Flint, J. & Mackay, T. F. Genetic architecture of quantitative traits in mice, flies, and humans. Genome Res. 19, 723–733 (2009)
Article CAS Google Scholar - Bentley, D. R. et al. Accurate whole human genome sequencing using reversible terminator chemistry. Nature 456, 53–59 (2008)
Article ADS CAS Google Scholar - Turner, D. J., Keane, T. M., Sudbery, I. & Adams, D. J. Next-generation sequencing of vertebrate experimental organisms. Mamm. Genome 20, 327–338 (2009)
Article CAS Google Scholar - Guan, C., Ye, C., Yang, X. & Gao, J. A review of current large-scale mouse knockout efforts. Genesis 48, 73–85 (2010)
CAS PubMed Google Scholar - Churchill, G. A. et al. The Collaborative Cross, a community resource for the genetic analysis of complex traits. Nature Genet. 36, 1133–1137 (2004)
Article CAS Google Scholar - Valdar, W. et al. Genome-wide genetic association of complex traits in heterogeneous stock mice. Nature Genet. 38, 879–887 (2006)
Article CAS Google Scholar - Davis, R. C. et al. A genome-wide set of congenic mouse strains derived from DBA/2J on a C57BL/6J background. Genomics 86, 259–270 (2005)
Article CAS Google Scholar - Steward, C. A. et al. Genome-wide end-sequenced BAC resources for the NOD/MrkTac and NOD/ShiLtJ mouse genomes. Genomics 95, 105–110 (2010)
Article CAS Google Scholar - Sherry, S. T., Ward, M. & Sirotkin, K. dbSNP-database for single nucleotide polymorphisms and other classes of minor genetic variation. Genome Res. 9, 677–679 (1999)
CAS PubMed Google Scholar - Yalcin, B. et al. Sequence-based characterization of structural variation in the mouse genome. Nature doi:10.1038/nature10432 (this issue) .
- Deem, A. et al. Break-induced replication is highly inaccurate. PLoS Biol. 9, e1000594 (2011)
Article CAS Google Scholar - Mihola, O., Trachtulec, Z., Vlcek, C., Schimenti, J. C. & Forejt, J. A mouse speciation gene encodes a meiotic histone H3 methyltransferase. Science 323, 373–375 (2009)
Article ADS CAS Google Scholar - McDonald, J. P. et al. 129-derived strains of mice are deficient in DNA polymerase iota and have normal immunoglobulin hypermutation. J. Exp. Med. 198, 635–643 (2003)
Article CAS Google Scholar - Koike, H., Arguello, P. A., Kvajo, M., Karayiorgou, M. & Gogos, J. A. Disc1 is mutated in the 129S6/SvEv strain and modulates working memory in mice. Proc. Natl Acad. Sci. USA 103, 3693–3697 (2006)
Article ADS CAS Google Scholar - Lutzmann, M. & Mechali, M. How to load a replicative helicase onto chromatin: a more and more complex matter during evolution. Cell Cycle 8, 1309–1313 (2009)
Article CAS Google Scholar - Mural, R. J. et al. A comparison of whole-genome shotgun-derived mouse chromosome 16 and the human genome. Science 296, 1661–1671 (2002)
Article ADS CAS Google Scholar - Ané, C., Larget, B., Baum, D. A., Smith, S. D. & Rokas, A. Bayesian estimation of concordance among gene trees. Mol. Biol. Evol. 24, 412–426 (2007)
Article Google Scholar - Pamilo, P., Nei, M. & Li, W. H. Accumulation of mutations in sexual and asexual populations. Genet. Res. 49, 135–146 (1987)
Article CAS Google Scholar - Rosenberg, N. A. The probability of topological concordance of gene trees and species trees. Theor. Popul. Biol. 61, 225–247 (2002)
Article Google Scholar - Baum, D. A. Concordance trees, concordance factors, and the exploration of reticulate genealogy. Taxon 56, 417–426 (2007)
Article Google Scholar - Laurie, C. C. et al. Linkage disequilibrium in wild mice. PLoS Genet. 3, e144 (2007)
Article Google Scholar - McDaniell, R. et al. Heritable individual-specific and allele-specific chromatin signatures in humans. Science 328, 235–239 (2010)
Article ADS CAS Google Scholar - Huang, D. W. et al. Extracting biological meaning from large gene lists with DAVID. Curr. Protoc. Bioinformatics 13, Unit 13.11. (2009)
- Solberg, L. C. et al. A protocol for high-throughput phenotyping, suitable for quantitative trait analysis in mice. Mamm. Genome 17, 129–146 (2006)
Article Google Scholar - Yalcin, B., Flint, J. & Mott, R. Using progenitor strain information to identify quantitative trait nucleotides in outbred mice. Genetics 171, 673–681 (2005)
Article CAS Google Scholar - Mott, R., Talbot, C. J., Turri, M. G., Collins, A. C. & Flint, J. A method for fine mapping quantitative trait loci in outbred animal stocks. Proc. Natl Acad. Sci. USA 97, 12649–12654 (2000)
Article ADS Google Scholar - White, M. A. Ané, C. Dewey, C. N., Larget, B. R. & Payseur, B. A. Fine-scale phylogenetic discordance across the house mouse genome. PLoS Genet. 5, e1000729 (2009)
Article Google Scholar
Acknowledgements
This project was supported by The Medical Research Council, UK, and the Wellcome Trust. D.J.A. is supported by Cancer Research UK and L.R., L.R.-D. and A.C. were supported by the Jackson Laboratory. B.A.P. was supported by NSF Grant DEB 0918000 and M.A.W. was supported by an NLM training grant in Computation and Informatics in Biology and Medicine to the University of Wisconsin (NLM 2T15LM007359). R.M., L.G. were supported by Wellcome Trust Grants 085906/Z/08/Z and 083573/Z/07/Z and BBSRC grant BB/F022697/1. The NOD/ShiLtJ BAC sequencing and the next generation Illumina sequencing was funded by Immune Tolerance Network Contract AI 15416, which was sponsored by the National Institute of Allergy and Infectious Diseases, the National Institute of Diabetes and Digestive and Kidney Diseases, and Juvenile Diabetes Research Foundation International. We thank staff in the Sanger Institute sequencing and informatics teams for making this project possible.
Author information
Author notes
- Thomas M. Keane, Leo Goodstadt and Petr Danecek: These authors contributed equally to this work.
Authors and Affiliations
- The Wellcome Trust Sanger Institute, Hinxton, Cambridge CB10 1HH, UK ,
Thomas M. Keane, Petr Danecek, Kim Wong, Guy Slater, Rebecca E. McIntyre, Louise van der Weyden, Charles A. Steward, Sendu Bala, Jim Stalker, Richard Durbin & David J. Adams - The Wellcome Trust Centre for Human Genetics, Roosevelt Drive, Oxford OX3 7BN, UK ,
Leo Goodstadt, Binnaz Yalcin, Avigail Agam, Martin Goodson, Helen Whitley, James Cleak, Deborah Janowitz, Polinka Hernandez-Pliego, Andrew Edwards, Amarjit Bhomra, Jérôme Nicod, Xiangchao Gan, Wei Yuan, Richard Mott & Jonathan Flint - Laboratory of Genetics, University of Wisconsin, Madison, 53706, Wisconsin, USA
Michael A. White & Bret A. Payseur - Department of Physiology, MRC Functional Genomics Unit, Anatomy and Genetics, University of Oxford, South Parks Road, OX13QX, Oxford, UK
Andreas Heger, Avigail Agam, Christoffer Nellåker, T. Grant Belgard, Peter L. Oliver & Chris P. Ponting - University of California, Los Angeles, 90095-1596, California, USA
Nicholas A. Furlotte & Eleazar Eskin - Department of Psychiatry and Psychotherapy, Ernst-Moritz-Arndt-Universität Greifswald Klinikum der Hansestadt Stralsund, Rostocker Chaussee 70, 18437 Stralsund, Germany,
Deborah Janowitz - Medical Research Council Human Genetics Unit, Crewe Road, Edinburgh EH4 2XU, UK ,
Ian J. Jackson - The Jackson Laboratory, Bar Harbor, 04609, Maine, USA
Anne Czechanski, Leah Rae Donahue & Laura G. Reinholdt - European Bioinformatics Institute, Wellcome Trust Genome Campus, Hinxton, Cambridge CB10 1SD, UK ,
José Afonso Guerra-Assunção & Ewan Birney
Authors
- Thomas M. Keane
You can also search for this author inPubMed Google Scholar - Leo Goodstadt
You can also search for this author inPubMed Google Scholar - Petr Danecek
You can also search for this author inPubMed Google Scholar - Michael A. White
You can also search for this author inPubMed Google Scholar - Kim Wong
You can also search for this author inPubMed Google Scholar - Binnaz Yalcin
You can also search for this author inPubMed Google Scholar - Andreas Heger
You can also search for this author inPubMed Google Scholar - Avigail Agam
You can also search for this author inPubMed Google Scholar - Guy Slater
You can also search for this author inPubMed Google Scholar - Martin Goodson
You can also search for this author inPubMed Google Scholar - Nicholas A. Furlotte
You can also search for this author inPubMed Google Scholar - Eleazar Eskin
You can also search for this author inPubMed Google Scholar - Christoffer Nellåker
You can also search for this author inPubMed Google Scholar - Helen Whitley
You can also search for this author inPubMed Google Scholar - James Cleak
You can also search for this author inPubMed Google Scholar - Deborah Janowitz
You can also search for this author inPubMed Google Scholar - Polinka Hernandez-Pliego
You can also search for this author inPubMed Google Scholar - Andrew Edwards
You can also search for this author inPubMed Google Scholar - T. Grant Belgard
You can also search for this author inPubMed Google Scholar - Peter L. Oliver
You can also search for this author inPubMed Google Scholar - Rebecca E. McIntyre
You can also search for this author inPubMed Google Scholar - Amarjit Bhomra
You can also search for this author inPubMed Google Scholar - Jérôme Nicod
You can also search for this author inPubMed Google Scholar - Xiangchao Gan
You can also search for this author inPubMed Google Scholar - Wei Yuan
You can also search for this author inPubMed Google Scholar - Louise van der Weyden
You can also search for this author inPubMed Google Scholar - Charles A. Steward
You can also search for this author inPubMed Google Scholar - Sendu Bala
You can also search for this author inPubMed Google Scholar - Jim Stalker
You can also search for this author inPubMed Google Scholar - Richard Mott
You can also search for this author inPubMed Google Scholar - Richard Durbin
You can also search for this author inPubMed Google Scholar - Ian J. Jackson
You can also search for this author inPubMed Google Scholar - Anne Czechanski
You can also search for this author inPubMed Google Scholar - José Afonso Guerra-Assunção
You can also search for this author inPubMed Google Scholar - Leah Rae Donahue
You can also search for this author inPubMed Google Scholar - Laura G. Reinholdt
You can also search for this author inPubMed Google Scholar - Bret A. Payseur
You can also search for this author inPubMed Google Scholar - Chris P. Ponting
You can also search for this author inPubMed Google Scholar - Ewan Birney
You can also search for this author inPubMed Google Scholar - Jonathan Flint
You can also search for this author inPubMed Google Scholar - David J. Adams
You can also search for this author inPubMed Google Scholar
Contributions
D.J.A. and J.F. conceived the study, directed the research, and wrote the paper. T.M.K., P.D., L.G., B.P., M.W., K.W., B.Y., A.H., A.A., G.S., M.G., N.F., E.E., C.N., H.W., J.C., D.J., P.H.-P., A.B., J.N., X.G., W.Y., A.B., L.v.d.W., C.A.S., S.B., J.S., R.M., R.D., I.J., C.P.P. and E.B. performed data analysis. L.R., A.C. and L.D. provided essential biological resources.
Corresponding authors
Correspondence toJonathan Flint or David J. Adams.
Ethics declarations
Competing interests
The authors declare no competing financial interests.
Supplementary information
Supplementary Information 1
This file contains Supplementary Methods and Data, Supplementary Tables 1-4 and additional references. (PDF 449 kb)
Supplementary Information 2
This file contains Supplementary Figures 1-20 with legends and Supplementary Tables 1 and 4 (see separate file for Supplementary Tables 2 and 3). (PDF 5600 kb)
Supplementary Tables
This file contains Supplementary Tables 2 and 3. (ZIP 43 kb)
PowerPoint slides
Rights and permissions
This article is distributed under the terms of the Creative Commons Attribution-Non-Commercial-Share Alike licence (http://creativecommons.org/licenses/by-nc-sa/3.0/), which permits distribution, and reproduction in any medium, provided the original author and source are credited. This licence does not permit commercial exploitation, and derivative works must be licensed under the same or similar licence.
About this article
Cite this article
Keane, T., Goodstadt, L., Danecek, P. et al. Mouse genomic variation and its effect on phenotypes and gene regulation.Nature 477, 289–294 (2011). https://doi.org/10.1038/nature10413
- Received: 05 July 2011
- Accepted: 05 August 2011
- Published: 14 September 2011
- Issue Date: 15 September 2011
- DOI: https://doi.org/10.1038/nature10413