The accessible chromatin landscape of the human genome (original) (raw)
Main

ENCODE Encyclopedia of DNA Elements nature.com/encode
Cell-selective activation of regulatory DNA drives the gene expression patterns that shape cell identity. Regulatory DNA is characterized by the cooperative binding of sequence-specific transcriptional regulatory factors in place of a canonical nucleosome, leading to a remodelled chromatin state characterized by markedly heightened accessibility to nucleases1. DNase I hypersensitive sites (DHSs) in chromatin were first identified over 30 years ago, and have since been used extensively to map regulatory DNA regions in diverse organisms2. DNase I hypersensitivity is central to all defined classes of active _cis_-regulatory elements including enhancers, promoters, silencers, insulators and locus control regions2,3,4. Because DNase I hypersensitivity overlies _cis_-regulatory elements directly and is maximal over the core region of regulatory factor occupancy, it enables precise delineation of the genomic _cis_-regulatory compartment. DHSs are flanked by nucleosomes, which may acquire histone modification patterns that reflect the functional role of the adjoining regulatory DNA, such as the association of histone H3 lysine 4 trimethylation (H3K4me3) with promoter elements5. Recent advances have enabled genome-scale mapping of DHSs in mammalian cells6,7,8, laying the foundations for comprehensive catalogues of human regulatory DNA.
General features of the accessible chromatin landscape
Two ENCODE production centres (University of Washington and Duke University) profiled DNase I sensitivity genome-wide using massively parallel sequencing7,8,9 in a total of 125 human cell and tissue types including normal differentiated primary cells (n = 71), immortalized primary cells (n = 16), malignancy-derived cell lines (n = 30) and multipotent and pluripotent progenitor cells (n = 8) (Supplementary Table 1). The density of mapped DNase I cleavages as a function of genome position provides a continuous quantitative measure of chromatin accessibility, in which DHSs appear as prominent peaks within the signal data from each cell type (Fig. 1a and Supplementary Figs 1 and 2). Analysis using a common algorithm (see Methods) identified 2,890,742 distinct high-confidence DHSs (false discovery rate (FDR) of 1%; see Methods), each of which was active in one or more cell types. Of these DHSs, 970,100 were specific to a single cell type, 1,920,642 were active in 2 or more cell types, and a small minority (3,692) was detected in all cell types. The relative accessibility of DHSs along the genome varies by >100-fold and is highly consistent across cell types (Supplementary Figs 1 and 2). To estimate the sensitivity and accuracy of the sequencing-derived DHS maps, one ENCODE production centre (University of Washington) performed 7,478 classical DNase I hypersensitivity experiments by the Southern hybridization method2. Using Southern blots as the standard, the average sensitivity, per cell type, of DNase I-seq (at a sequencing depth of 30 M uniquely mapping reads) was 81.6%, with specificity of 99.5–99.9%. Of DHSs classified as false negatives within a particular cell type, an average of 92.4% were detected as a DHS in another cell type or upon deeper sequencing. As such, we estimate that the overall sensitivity for DHSs of the combined cell type maps is >98%.
Figure 1: General features of the DHS landscape.
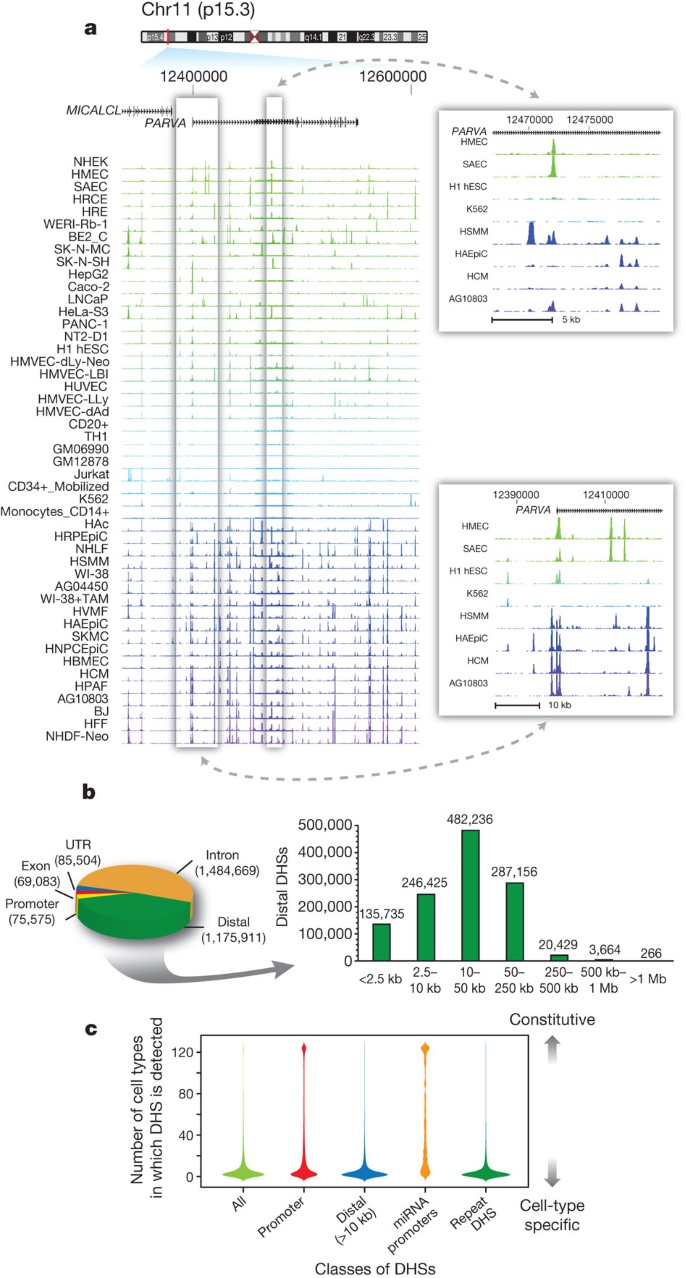
a, Density of DNase I cleavage sites for selected cell types, shown for an example ∼350-kb region. Two regions are shown to the right in greater detail. b, Left: distribution of 2,890,742 DHSs with respect to GENCODE gene annotations. Promoter DHSs are defined as the first DHS localizing within 1 kb upstream of a GENCODE TSS. Right: distribution of intergenic DHSs relative to Gencode TSSs. c, Distributions of the number of cell types, from 1 to 125 (y axis), in which DHSs in each of four classes (x axis) are observed. Width of each shape at a given y value shows the relative frequency of DHSs present in that number of cell types.
Approximately 3% (n = 75,575) of DHSs localize to transcriptional start sites (TSSs) defined by GENCODE10 and 5% (n = 135,735, including the aforementioned) lie within 2.5 kilobases (kb) of a TSS. The remaining 95% of DHSs are positioned more distally, and are roughly evenly divided between intronic and intergenic regions (Fig. 1b). Promoters typically exhibit high accessibility across cell types, with the average promoter DHS detected in 29 cell types (Fig. 1c, second column). By contrast, distal DHSs are largely cell selective (Fig. 1c, third column).
MicroRNAs (miRNAs) comprise a major class of regulatory molecules and have been extensively studied, resulting in consensus annotation of hundreds of conserved miRNA genes11, approximately one-third of which are organized in polycistronic clusters12. However, most predicted promoters driving microRNA expression lack experimental evidence. Of 329 unique annotated miRNA TSSs (Supplementary Methods), 300 (91%) either coincided with or closely approximated (<500 base pairs (bp)) a DHS. Chromatin accessibility at miRNA promoters was highly promiscuous compared with GENCODE TSSs (Fig. 1c, fourth column), and showed cell lineage organization, paralleling the known regulatory roles of well-annotated lineage-specific miRNAs (Supplementary Fig. 3).
The 20–50-bp read lengths from DNase I-seq experiments enabled unique mapping to 86.9% of the genomic sequence, allowing us to interrogate a large fraction of transposon sequences. A surprising number contain highly regulated DHSs (Fig. 1c, fifth column and Supplementary Figs 4 and 5), compatible with cell-specific transcription of repetitive elements detected using ENCODE RNA sequencing data[13](/articles/nature11232#ref-CR13 "Djebali, S. et al. Landscape of transcription in human cells. Nature http://dx.doi.org/10.1038/nature11233
(this issue)"). DHSs were most strongly enriched at long terminal repeat (LTR) elements, which encode retroviral enhancer structures ([Supplementary Table 2](/articles/nature11232#MOESM261)). Two such examples are shown in [Supplementary Fig. 4](/articles/nature11232#MOESM261), which also illustrates the strong cell-selectivity of chromatin accessibility seen for each major repeat class. We also documented numerous examples of transposon DHSs that displayed enhancer activity in transient transfection assays ([Supplementary Table 3](/articles/nature11232#MOESM261)).Comparison with an extensive compilation of 1,046 experimentally validated distal, non-promoter _cis_-regulatory elements (enhancers, insulators, locus control regions, and so on) revealed the overwhelming majority (97.4%) to be encompassed within DNase I hypersensitive chromatin (Supplementary Table 4), typically with strong cell selectivity (Supplementary Fig. 2b).
Transcription factor drivers of chromatin accessibility
DNase I hypersensitive sites result from cooperative binding of transcriptional factors in place of a canonical nucleosome1,2. To quantify the relationship between chromatin accessibility and the occupancy of regulatory factors, we compared sequencing-depth-normalized DNase I sensitivity in the ENCODE common cell line K562 to normalized chromatin immunoprecipitation and high-throughput sequencing (ChIP-seq) signals from all 42 transcription factors mapped by ENCODE ChIP-seq[14](/articles/nature11232#ref-CR14 "ENCODE Project Consortium An integrated encyclopedia of DNA elements in the human genome. Nature http://dx.doi.org/10.1038/nature11247
(this issue)") in this cell type ([Fig. 2](/articles/nature11232#Fig2)). Simple summation of the ChIP-seq signals markedly parallels quantitative DNase I sensitivity at individual DHSs ([Fig. 2a](/articles/nature11232#Fig2)) and across the genome (_r_ \= 0.79, [Fig. 2b](/articles/nature11232#Fig2)). For example, the β-globin locus control region contains a major enhancer element at hypersensitive site 2 (HS2), which appears to be occupied by dozens of transcription factors ([Supplementary Fig. 6a](/articles/nature11232#MOESM261)). Such highly overlapping binding patterns have been interpreted to signify weak interactions with lower-affinity recognition sequences potentiated by an accessible DNA template[15](/articles/nature11232#ref-CR15 "Biggin, M. D. Animal transcription networks as highly connected, quantitative continua. Dev. Cell 21, 611–626 (2011)"). However, HS2 is a compact element with a functional core spanning ∼110 bp that contains 5–8 sites of transcription factor–DNA interaction _in vivo_ depending on the cell type[16](/articles/nature11232#ref-CR16 "Reddy, P. M., Stamatoyannopoulos, G., Papayannopoulou, T. & Shen, C. K. Genomic footprinting and sequencing of human β-globin locus. Tissue specificity and cell line artifact. J. Biol. Chem. 269, 8287–8295 (1994)"),[17](/articles/nature11232#ref-CR17 "Forsberg, E. C., Downs, K. M. & Bresnick, E. H. Direct interaction of NF-E2 with hypersensitive site 2 of the β-globin locus control region in living cells. Blood 96, 334–339 (2000)"),[18](/articles/nature11232#ref-CR18 "Talbot, D. & Grosveld, F. The 5′HS2 of the globin locus control region enhances transcription through the interaction of a multimeric complex binding at two functionally distinct NF-E2 binding sites. EMBO J. 10, 1391–1398 (1991)"). The fact that the cumulative ChIP-seq signal closely parallels the degree of nuclease sensitivity at HS2 and elsewhere is thus most readily explained by interactions between DNA-bound factors and other interacting factors that collectively potentiate the accessible chromatin state ([Supplementary Fig. 6b](/articles/nature11232#MOESM261)). Given the relatively limited number of factors studied, it may seem surprising that such a close correlation should be evident. However, most of the factors selected for ENCODE ChIP-seq studies have well-described or even fundamental roles in transcriptional regulation, and many were identified originally based on their high affinity for DNA. Alternatively, as originally proposed in ref. [19](/articles/nature11232#ref-CR19 "Weisbrod, S. & Weintraub, H. Isolation of a subclass of nuclear proteins responsible for conferring a DNase I-sensitive structure on globin chromatin. Proc. Natl Acad. Sci. USA 76, 630–634 (1979)"), a limited number of factors may be involved in establishment and maintenance of chromatin remodelling, whereas others may interact nonspecifically with the remodelled state. We also found that the recognition sequences for a small number of factors were consistently linked with elevated chromatin accessibility across all classes of sites and all cell types ([Supplementary Fig. 6c](/articles/nature11232#MOESM261)), indicating that regulators acting through these sequences are key drivers of the accessibility landscape.Figure 2: Transcription factor drivers of chromatin accessibility.
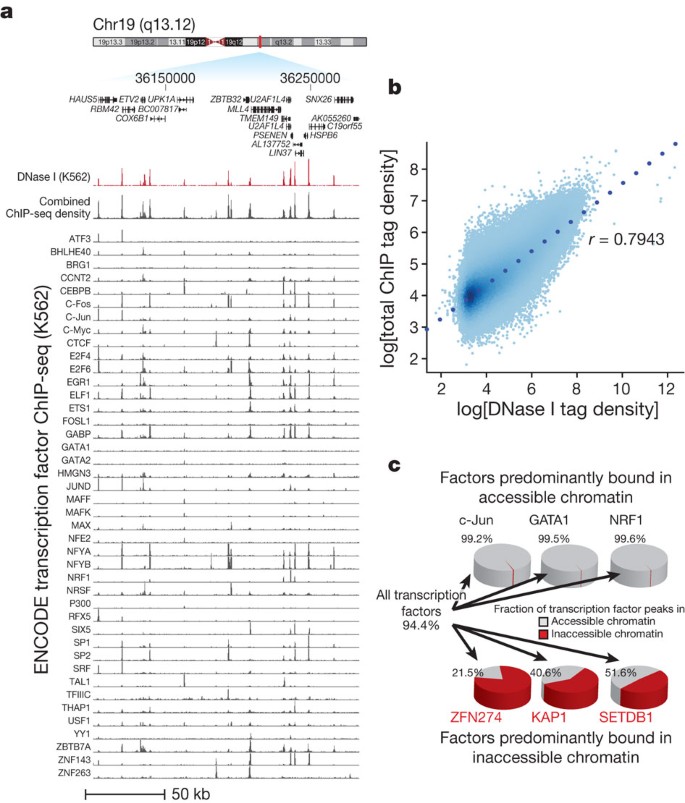
a, DNase I tag density is shown in red for a 175-kb region of chromosome 19. Below: normalized ChIP-seq tag density for 45 ENCODE ChIP-seq experiments from K562 cells, with a cumulative sum of the individual tag density tracks shown immediately below the K562 DNase I data. b, Genome-wide correlation (r = 0.7943) between ChIP-seq and DNase I tag densities (log10) in K562 cells. c, Left: 94.4% of a combined 1,108,081 ChIP-seq peaks from all transcription factors assayed in K562 cells fall within accessible chromatin (grey areas of pie chart). Top: three examples of transcription factors localizing almost exclusively within accessible chromatin. Bottom: three transcription factors from the KRAB-associated complex localizing partially or predominantly within inaccessible chromatin.
Overall, 94.4% of a combined 1,108,081 ChIP-seq peaks from all ENCODE transcription factors fall within accessible chromatin (Fig. 2c and Supplementary Fig. 7a), with the median factor having 98.2% of its binding sites localized therein. Notably, a small number of factors diverged from this paradigm, including known chromatin repressors, such as the KRAB-associated factors KAP1 (also called TRIM28), SETDB1 and ZNF274 (refs 20, 21) (Fig. 2c). We hypothesized that a proportion of the occupancy sites of these factors represented binding within compacted heterochromatin. To test this, we developed targeted mass spectrometry assays22 for KAP1 and three factors localizing almost exclusively within accessible chromatin (GATA1, c-Jun, NRF1), and quantified their abundance in biochemically defined heterochromatin23 against a total chromatin fraction (Supplementary Fig. 7b). This analysis confirmed that factors such as KAP1 show a significant level of heterochromatin occupancy (Supplementary Fig. 7c).
An invariant directional promoter chromatin signature
The annotation of sites of transcription origination continues to be an active and fundamental endeavour[13](/articles/nature11232#ref-CR13 "Djebali, S. et al. Landscape of transcription in human cells. Nature http://dx.doi.org/10.1038/nature11233
(this issue)"). In addition to direct evidence of TSSs provided by RNA transcripts, H3K4me3 modifications are closely linked with TSSs[24](/articles/nature11232#ref-CR24 "Li, G. et al. Extensive promoter-centered chromatin interactions provide a topological basis for transcription regulation. Cell 148, 84–98 (2012)"). We therefore explored systematically the relationship between chromatin accessibility and H3K4me3 patterns at well-annotated promoters, its relationship to transcription origination, and its variability across ENCODE cell types.We performed ChIP-seq for H3K4me3 in 56 cell types using the same biological samples used for DNase I data (Supplementary Table 1, column D). Plotting DNase I cleavage density against ChIP-seq tag density around TSSs reveals highly stereotyped, asymmetrical patterning of these chromatin features with a precise relationship to the TSS (Fig. 3a, b). This directional pattern is consistent with a rigidly positioned nucleosome immediately downstream from the promoter DHS, and is largely invariant across cell types (Fig. 3b and Supplementary Fig. 8).
Figure 3: Identification and directional classification of novel promoters.
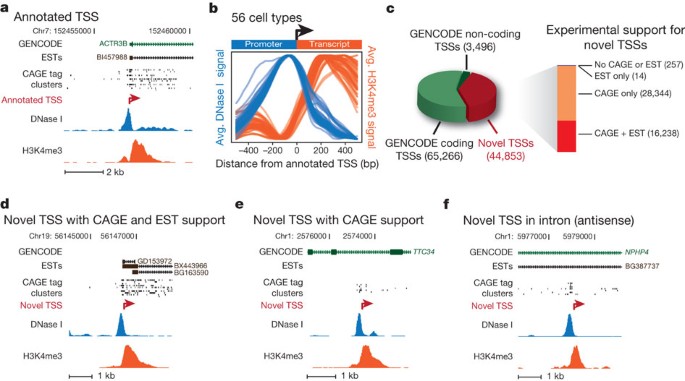
a, DNase I (blue) and H3K4me3 (red) tag densities for K562 cells around annotated TSS of ACTR3B. b, Averaged H3K4me3 tag density (red, right y axis) and log DNase I tag density (blue, left y axis) across 10,000 randomly selected GENCODE TSSs, oriented 5′→3′. Each blue and red curve is for a different cell type, showing invariance of the pattern. c, Relation of 113,615 promoter predictions to GENCODE annotations, with supporting EST and CAGE evidence (bar at right). d–f, Examples of novel promoters identified in K562; red arrow marks predicted TSS and direction of transcription, with CAGE tag clusters, spliced ESTs and GENCODE annotations above. d, Novel TSS confirmed by CAGE and ESTs. e, Novel TSS confirmed by CAGE, no ESTs. Note intronic location. f, Antisense prediction within annotated gene.
To map novel promoters (and their directionality) not encompassed by the GENCODE consensus annotations, we applied a pattern-matching approach to scan the genome across all 56 cell types (Supplementary Methods). Using this approach we identified a total of 113,622 distinct putative promoters. Of these, 68,769 correspond to previously annotated TSSs, and 44,853 represent novel predictions (versus GENCODE v7). Of the novel sites, 99.5% are supported by evidence from spliced expressed sequence tags (ESTs) and/or cap analysis of gene expression (CAGE) tag clusters (Fig. 3c and Supplementary Fig. 9, P < 0.0001; see Supplementary Methods). We found novel sites in every configuration relative to existing annotations (Fig. 3d–f and Supplementary Fig. 10). For example, 29,203 putative promoters are contained in the bodies of annotated genes, of which 17,214 are oriented antisense to the annotated direction of transcription, and 2,794 lie immediately downstream of an annotated gene’s 3′ end, with 1,638 in antisense orientation. The results indicate that chromatin data can systematically inform RNA transcription analyses, and suggest the existence of a large pool of cell-selective transcriptional promoters, many of which lie in antisense orientations.
Chromatin accessibility and DNA methylation patterns
CpG methylation has been closely linked with gene regulation, based chiefly on its association with transcriptional silencing25. However, the relationship between DNA methylation and chromatin structure has not been clearly defined. We analysed ENCODE reduced-representation bisulphite sequencing (RRBS) data, which provide quantitative methylation measurements for several million CpGs (K. E. Varley et al., manuscript submitted; see Gene Expression Omnibus accession GSE27584). We focused on 243,037 CpGs falling within DHSs in 19 cell types for which both data types were available from the same sample. We observed two broad classes of sites: those with a strong inverse correlation across cell types between DNA methylation and chromatin accessibility (Fig. 4a and Supplementary Fig. 11a), and those with variable chromatin accessibility but constitutive hypomethylation (Fig. 4a, right). To quantify these trends globally, we performed a linear regression analysis between chromatin accessibility and DNA methylation at the 34,376 CpG-containing DHSs (see Supplementary Methods). Of these sites, 6,987 (20%) showed a significant association (1% FDR) between methylation and accessibility (Supplementary Fig. 11b). Increased methylation was almost uniformly negatively associated with chromatin accessibility (>97% of cases). The magnitude of the association between methylation and accessibility was strong, with the latter on average 95% lower in cell types with coinciding methylation versus cell types lacking coinciding methylation (Supplementary Fig. 11c). Fully 40% of variable methylation was associated with a concomitant effect on accessibility.
Figure 4: Chromatin accessibility and DNA methylation patterns.
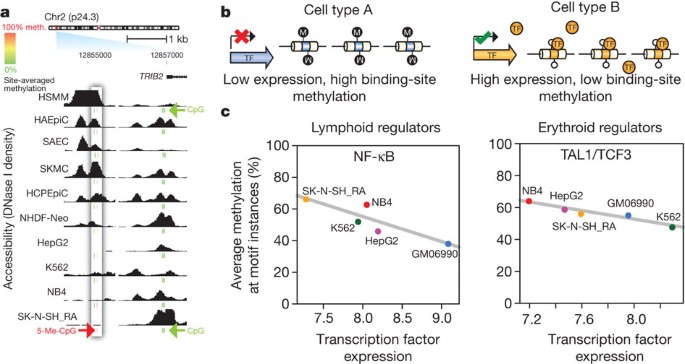
a, DNase I sensitivity in 10 cell types with ENCODE reduced representation bisulphite sequencing data. Inset box: accessibility (y axis) decreases quantitatively as methylation increases. Other DHSs (right) show low correlation between accessibility and methylation. CpG methylation scale: green, 0%; yellow, 50%; red, 100%. b, Model of transcription factor (TF)-driven methylation patterns in which methylation passively mirrors transcription factor occupancy. c, Relationship between transcription factor transcript levels and overall methylation at cognate recognition sequences of the same transcription factors. Lymphoid regulators in B-lymphoblastoid line GM06990 (left) and erythroid regulators in the erythroleukaemia line K562 (right). Negative correlation indicates that site-specific DNA methylation follows transcription factor vacation of differentially expressed transcription factors.
The role of DNA methylation in causation of gene silencing is presently unclear. Does methylation reduce chromatin accessibility by evicting transcription factors? Or does DNA methylation passively ‘fill in’ the voids left by vacating transcription factors? Transcription factor expression is closely linked with the occupancy of its binding sites26. If the former of the two above hypotheses is correct, methylation of individual binding site sequences should be independent of transcription factor gene expression. If the latter, methylation at transcription factor recognition sequences should be negatively correlated with transcription factor abundance (Fig. 4b).
Comparing transcription factor transcript levels to average methylation at cognate recognition sites within DHSs revealed significant negative correlations between transcription factor expression and binding site methylation for most (70%) transcription factors with a significant association (P < 0.05). Representative examples are shown in Fig. 4c and Supplementary Fig. 12a. These data argue strongly that methylation patterning paralleling cell-selective chromatin accessibility results from passive deposition after the vacation of transcription factors from regulatory DNA, confirming and extending other recent reports27.
Interestingly, a small number of factors showed positive correlations between expression and binding site methylation (Supplementary Fig. 12b), including MYB and LUN-1 (also known as TOPORS). Both of these transcription factors showed increased transcription and binding site methylation specifically within acute promyelocytic leukaemia cells (NB4), and both interact with promyelocytic leukaemia (PML) bodies28,29, a sub-nuclear structure disrupted in PML cells. The anomalous behaviour of these two transcription factors with respect to chromatin structure and DNA methylation may thus be related to a specialized mechanism seen only in pathologically altered cells.
A map of distal DHS-to-promoter connections
From examination of DNase I profiles across many cell types we observed that many known cell-selective enhancers become DHSs synchronously with the appearance of hypersensitivity at the promoter of their target gene (Supplementary Fig. 13). To generalize this, we analysed the patterning of 1,454,901 distal DHSs (DHSs separated from a TSS by at least one other DHS) across 79 diverse cell types (Supplementary Methods and Supplementary Table 6), and correlated the cross-cell-type DNase I signal at each DHS position with that at all promoters within ±500 kb (Supplementary Fig. 14a). We identified a total of 578,905 DHSs that were highly correlated (r > 0.7) with at least one promoter (P < 10−100), providing an extensive map of candidate enhancers controlling specific genes (Supplementary Methods and Supplementary Table 7). To validate the distal DHS/enhancer–promoter connections, we profiled chromatin interactions using the chromosome conformation capture carbon copy (5C) technique30. For example, the phenylalanine hydroxylase (PAH) gene is expressed in hepatic cells, and an enhancer has been defined upstream of its TSS (Fig. 5a). The correlation values for three DHSs within the gene body closely parallel the frequency of long-range chromatin interactions measured by 5C. The three interacting intronic DHSs cloned downstream of a reporter gene driven by the PAH promoter all showed increased expression ranging from three- to tenfold over a promoter-only control, confirming enhancer function.
Figure 5: A genome-wide map of distal DHS-to-promoter connectivity.
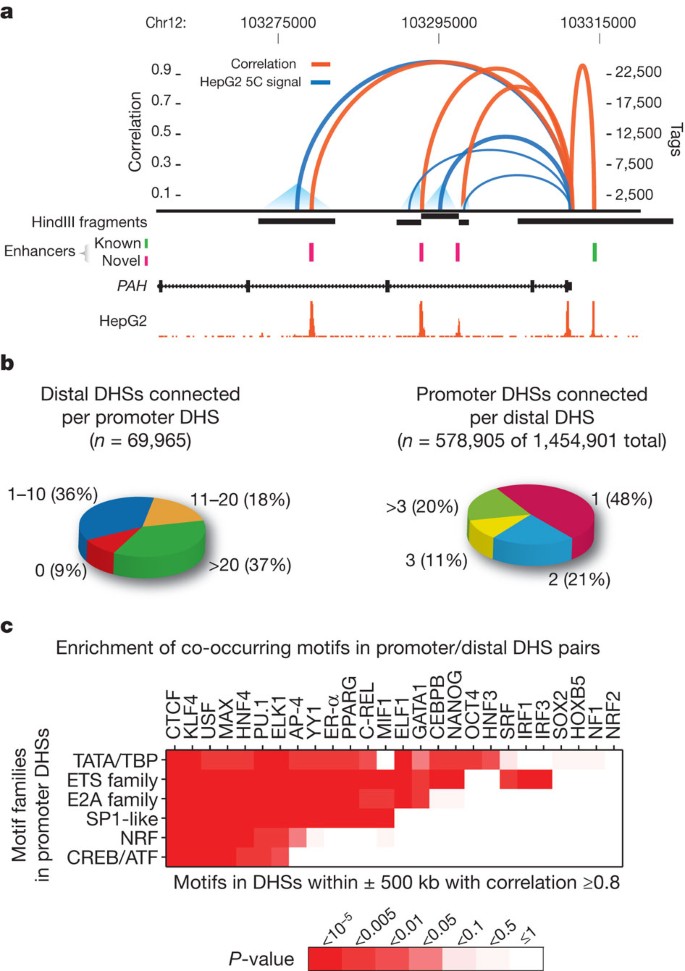
a, Cross-cell-type correlation (red arcs, left y axis) of distal DHSs and PAH promoter closely parallels chromatin interactions measured by 5C-seq (blue arcs, right y axis); black bars indicate HindIII fragments used in 5C assays. Known (green) and novel (magenta) enhancers confirmed in transfection assays are shown below. Enhancer at far right is not separable by 5C as it lies within the HindIII fragment containing the promoter. b, Left: proportions of 69,965 promoters correlated (r > 0.7) with 0 to >20 DHSs within 500 kb. Right: proportions of 578,905 non-promoter DHSs (out of 1,454,901) correlated with 1 to >3 promoters within 500 kb. c, Pairing of canonical promoter motif families with specific motifs in distal DHSs.
We next examined comprehensive promoter-versus-all 5C experiments performed over 1% of the human genome[31](/articles/nature11232#ref-CR31 "Sanyal, A., Lajoie, B., Jain, G. & Dekker, J. The long-range interaction landscape of gene promoters. Nature http://dx.doi.org/10.1038/nature11279
(this issue)") in K562 cells. DHS–promoter pairings were markedly enriched in the specific cognate chromatin interaction (_P_ < 10−13, [Supplementary Fig. 14b](/articles/nature11232#MOESM261)). We also examined K562 promoter–DHS interactions detected by polymerase II chromatin interaction analysis with paired-end tag sequencing (ChIA-PET)[24](/articles/nature11232#ref-CR24 "Li, G. et al. Extensive promoter-centered chromatin interactions provide a topological basis for transcription regulation. Cell 148, 84–98 (2012)"), which quantifies interactions between promoter-bound polymerase and distal sites. The ChIA-PET interactions were also markedly enriched for DHS–promoter pairings (_P_ < 10−15, [Supplementary Fig. 14c](/articles/nature11232#MOESM261)). Together, the large-scale interaction analyses affirm the fidelity of DHS–promoter pairings based on correlated DNase I sensitivity signals at distal and promoter DHSs.Most promoters were assigned to more than one distal DHS, indicating the existence of combinatorial distal regulatory inputs for most genes (Fig. 5b and Supplementary Table 7). A similar result is forthcoming from large-scale 5C interaction data[31](/articles/nature11232#ref-CR31 "Sanyal, A., Lajoie, B., Jain, G. & Dekker, J. The long-range interaction landscape of gene promoters. Nature http://dx.doi.org/10.1038/nature11279
(this issue)"). Surprisingly, roughly half of the promoter-paired distal DHSs were assigned to more than one promoter ([Fig. 5b](/articles/nature11232#Fig5) and [Supplementary Methods](/articles/nature11232#MOESM261)), indicating that human _cis_\-regulatory circuitry is significantly more complicated than previously anticipated, and may serve to reinforce the robustness of cellular transcriptional programs.The number of distal DHSs connected with a particular promoter provides, for the first time, a quantitative measure of the overall regulatory complexity of that gene. We asked whether there are any systematic functional features of genes with highly complex regulation. We ranked all human genes by the number of distal DHSs paired with the promoter of each gene, then performed a Gene Ontology analysis on the rank-ordered list. We found that the most complexly regulated human genes were markedly enriched in immune system functions (Supplementary Fig. 14d), indicating that the complexity of cellular and environmental signals processed by the immune system is directly encoded in the _cis_-regulatory architecture of its constituent genes.
Next, we asked whether DHS–promoter pairings reflected systematic relationships between specific combinations of regulatory factors (Supplementary Methods). For example, KLF4, SOX2, OCT4 (also called POU5F1) and NANOG are known to form a well-characterized transcriptional network controlling the pluripotent state of embryonic stem cells32. We found significant enrichment (P < 0.05) of the KLF4, SOX2 and OCT4 motifs within distal DHSs correlated with promoter DHSs containing the NANOG motif; enrichment of NANOG, SOX2 and OCT4 distal motifs co-occurring with promoter motif OCT4; and enrichment of distal SOX2 and OCT4 motifs with promoter SOX2 motifs (Supplementary Fig. 15a). By contrast, promoters containing KLF4 motifs were associated with KLF4-containing distal DHSs, but not with DHSs containing NANOG, SOX2 or OCT4 motifs (Supplementary Fig. 15a, bottom).
We also tested for significant co-associations between promoter types (defined by the presence of cognate motif classes; see Supplementary Methods) and motifs in paired distal DHSs (Fig. 5c and Supplementary Fig. 15b, c). For example, when a member of the ETS domain family (motifs ETS1, ETS2, ELF1, ELK1, NERF (also called ELF2), SPIB, and others) is present within a promoter DHS, motif PU.1 (also called SPI1) is significantly more likely to be observed in a correlated distal DHS (P < 10−5). These results suggest that a limited set of general rules may govern the pairing of co-regulated distal DHSs with particular promoters.
Stereotyped chromatin accessibility parallels function
In addition to the synchronized activation of distal DHSs and promoters described above, we observed a surprising degree of patterned co-activation among distal DHSs, with nearly identical cross-cell-type patterns of chromatin accessibility at groups of DHSs widely separated in trans (Supplementary Figs 16 and 17). For many patterns, we observed tens or even hundreds of like elements around the genome. The simplest explanation is that such co-activated sites share recognition motifs for the same set of regulatory factors. We found, however, that the underlying sequence features for a given pattern were surprisingly plastic. This suggests that the same pattern of cell-selective chromatin accessibility shared between two DHSs can be achieved by distinct mechanisms, probably involving complex combinatorial tuning.
We next asked whether distal DHSs with specific functions such as enhancers exhibited stereotypical patterning, and whether such patterning could highlight other elements with the same function. We examined one of the best-characterized human enhancers, DNase I HS2 of the β-globin locus control region16,17,18. HS2 is detected in many cell types, but exhibits potent enhancer activity only in erythroid cells33. Using a pattern-matching algorithm (see Supplementary Methods) we identified additional DHSs with nearly identical cross-cell-type accessibility patterns (Fig. 6a). We selected 20 elements across the spectrum of the top 200 matches to the HS2 pattern, and tested these in transient transfection assays in K562 cells (Supplementary Methods). Seventy per cent (14 of 20) of these displayed enhancer activity (mean 8.4-fold over control) (Fig. 6a, f). Of note, one (E3) showed a greater magnitude of enhancement (18-fold versus control) than HS2, which is itself one of the most potent known enhancers4. Next we selected three elements from the 14 HS2-like enhancers, applied pattern matching (Methods) to each to identify stereotyped elements, and tested samples of each pattern for enhancer activity, revealing additional K562 enhancers (total 15 of 25 positive) (Fig. 6b–d, f). In each case, therefore, we were able to discover enhancers by simply anchoring on the cross-cell-type DHS pattern of an element with enhancer activity. Collectively, these results show that co-activation of DHSs reflected in cross-cell-type patterning of chromatin accessibility is predictive of functional activity within a specific cell type, and suggest more generally that DHSs with stereotyped cellular patterning are likely to fulfil similar functions.
Figure 6: Stereotyped regulation of chromatin accessibility.
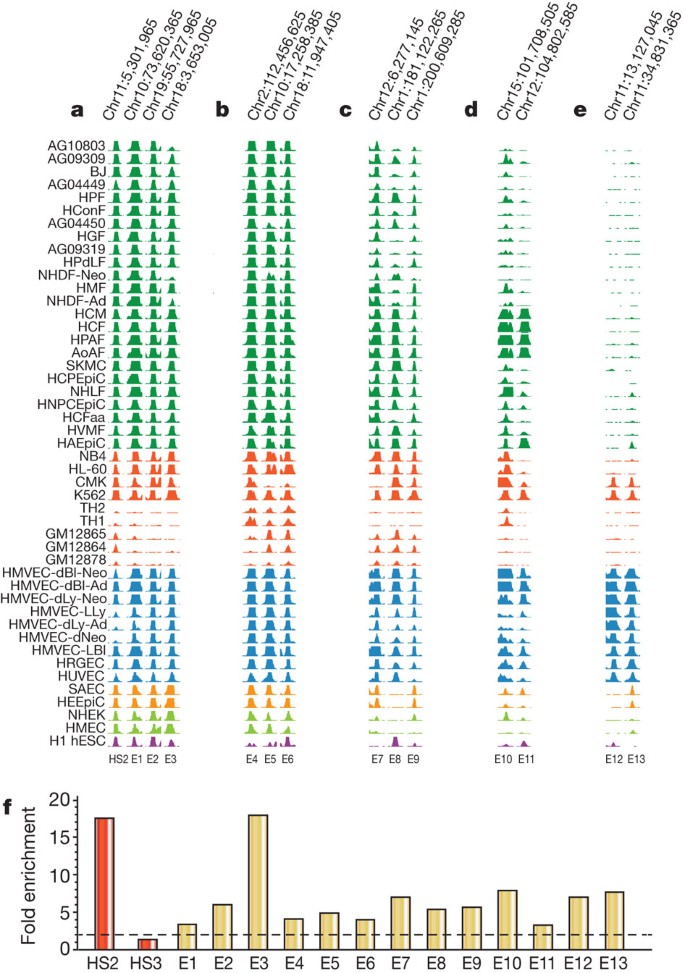
a–e, Enhancers grouped by similar chromatin stereotypes. Related cell lines are colour matched. HS2 from the β-globin locus control region is at left. E1–E11 represent progressively weaker matches to the HS2 stereotype. E12–13 derive from matches to a different stereotype based on another K562 enhancer. f, Experimental validation of enhancers detected by pattern matching. Bars indicate fold enrichment observed in transient assays in K562 relative to promoter-only control; mean of testing in both orientations is shown. Red bars indicate data from two potent in vivo enhancers, β-globin LCR HS2 and HS3; the latter requires chromatinization to function and is not active in transient assays. Gold bars indicate data from E1–E13 from a–e above.
To visualize the qualities and prevalence of different stereotyped cross-cellular DHS patterns, we constructed a self-organizing map of a random 10% subsample of DHSs across all cell types and identified a total of 1,225 distinct stereotyped DHS patterns (Supplementary Figs 18 and 19). Many of the stereotyped patterns discovered by the self-organizing map encompass large numbers of DHSs, with some counting >1,000 elements (Supplementary Fig. 20).
Taken together, the above results show that chromatin accessibility at regulatory DNA is highly choreographed across large sets of co-activated elements distributed throughout the genome, and that DHSs with similar cross-cell-type activation profiles probably share similar functions.
Variation in regulatory DNA linked to mutation rate
The DHS compartment as a whole is under evolutionary constraint, which varies between different classes and locations of elements[14](/articles/nature11232#ref-CR14 "ENCODE Project Consortium An integrated encyclopedia of DNA elements in the human genome. Nature http://dx.doi.org/10.1038/nature11247
               (this issue)"), and may be heterogeneous within individual elements[34](/articles/nature11232#ref-CR34 "Neph, S. et al. An expansive human regulatory lexicon encoded in transcription factor footprints. Nature
                http://dx.doi.org/10.1038/nature11212

               (this issue)"). To understand the evolutionary forces shaping regulatory DNA sequences in humans, we estimated nucleotide diversity (_π_) in DHSs using publicly available whole-genome sequencing data from 53 unrelated individuals[35](/articles/nature11232#ref-CR35 "Vernot, B. et al. Personal and population genomics of human regulatory variation. Genome Res. (in the press)") (see [Supplementary Methods](/articles/nature11232#MOESM261)). We restricted our analysis to nucleotides outside of exons and RepeatMasked regions. To provide a comparison with putatively neutral sites, we computed _π_ in fourfold degenerate synonymous positions (third positions) of coding exons. This analysis showed that, taken together, DHSs exhibit lower _π_ than fourfold degenerate sites, compatible with the action of purifying selection.
Figure 7a shows π for the DHSs of all analysed cell types, with colour coding to indicate the origin of each cell type. Particularly striking is the distribution of diversity relative to proliferative potential. DHSs in cells with limited proliferative potential have uniformly lower average diversity than immortal cells, with the difference most pronounced in malignant and pluripotent lines. This ordering is identical when highly mutable CpG nucleotides are removed from the analysis.
Figure 7: Genetic variation in regulatory DNA linked to mutation rate.
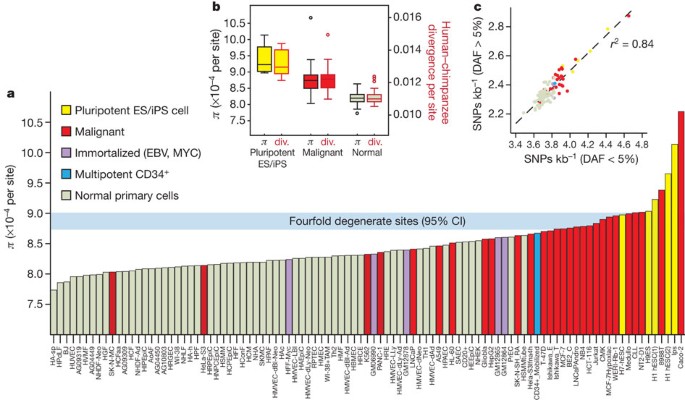
a, Mean nucleotide diversity (π, y axis) in DHSs of 97 diverse cell types (x axis) estimated using whole-genome sequencing data from 53 unrelated individuals. Cell types are ordered left-to-right by increasing mean π. Horizontal blue bar shows 95% confidence intervals on mean π in a background model of fourfold degenerate coding sites. Note the enrichment of immortal cells at right. ES, embryonic stem; iPS, induced pluripotent stem. b, Mean π (left y axis) for pluripotent (yellow) versus malignancy-derived (red) versus normal cells (light green), plotted side-by-side with human–chimpanzee divergence (right y axis) computed on the same groups. Boxes indicate 25–75 percentiles, with medians highlighted. c, Both low- and high-frequency derived alleles show the same effect. Density of SNPs in DHSs with derived allele frequency (DAF) <5% (x axis) is tightly correlated (_r_2 = 0.84) with the same measure computed for higher-frequency derived alleles (y axis). Colour-coding is the same as in panel a.
If differences in π are due to mutation rate differences in different DHS compartments, the ratio of human polymorphism to human–chimpanzee divergence should remain constant across cell types. By contrast, differences in π due to selective constraint should result in pronounced differences. To distinguish between these alternatives, we first compared polymorphism and human–chimpanzee divergence for DHSs from normal, malignant and pluripotent cells (Fig. 7b). Differences in polymorphism and divergence between these three groups are nearly identical, compatible with a mutational cause. Second, raw mutation rate is expected to affect rare and common genetic variation equally, whereas selection is likely to have a larger impact on common variation. We consistently observe ∼62% of single nucleotide polymorphisms (SNPs) in DHSs of each group to have derived-allele frequencies below 0.05. DHSs in different cell lines exhibit differences in SNP densities but not in allele frequency distribution (Fig. 7c). Collectively, these observations are consistent with increased relative mutation rates in the DHS compartment of immortal cells versus cell types with limited proliferative potential, exposing an unexpected link between chromatin accessibility, proliferative potential and patterns of human variation.
Discussion
Since their discovery over 30 years ago, DNase I hypersensitive sites have guided the discovery of diverse _cis_-regulatory elements in the human and other genomes. Here we have presented by far the most comprehensive map of human regulatory DNA, revealing novel relationships between chromatin accessibility, transcription, DNA methylation and the occupancy of sequence-specific factors. The wide spectrum of different cell and tissue types covered by our data greatly expands the horizons of cell-selective gene regulation analysis, enabling the recognition of systematic long-distance regulatory patterns, and previously undescribed phenomena such as stereotyping of DHS activation and mutation rate variation in normal versus immortal cells. The extensive resources we have provided should greatly facilitate future analyses, and stimulate new areas of investigation into the organization and control of the human genome. Co-published ENCODE-related papers can be explored online via the Nature ENCODE explorer (http://www.nature.com/ENCODE), a specially designed visualization tool that allows users to access the linked papers and investigate topics that are discussed in multiple papers via thematically organized threads.
Methods Summary
DNase I hypersensitivity mapping was performed using protocols developed by Duke University7 or University of Washington8 on a total of 125 cell types (Supplementary Table 1). Data sets were sequenced to an average depth of 30 million uniquely mapping sequence tags (27–36 bp for University of Washington and 20 bp for Duke University) per replicate. For uniformity of analysis, some cell-type data sets that exceeded 40M tag depth were randomly subsampled to a depth of 30 million tags. Sequence reads were mapped using the Bowtie aligner, allowing a maximum of two mismatches. Only reads mapping uniquely to the genome were used in our analyses. Mappings were to male or female versions of hg19/GRCh37, depending on cell type, with random regions omitted. Data were analysed jointly using a single algorithm7 (Supplementary Methods) to localize DNase I hypersensitive sites. H3K4me3 ChIP-seq was performed using antibody 9751 (Cell Signaling) on 1% formaldehyde crosslinked samples sheared by Diagenode Bioruptor. Gene expression measurements for each cell type were performed on Affymetrix human exon microarrays. 5C experiments were performed as described30,[31](/articles/nature11232#ref-CR31 "Sanyal, A., Lajoie, B., Jain, G. & Dekker, J. The long-range interaction landscape of gene promoters. Nature http://dx.doi.org/10.1038/nature11279
(this issue)"). Transcription factor recognition motif occurrences within DHSs were defined with FIMO[36](/articles/nature11232#ref-CR36 "Grant, C. E., Bailey, T. L. & Noble, W. S. FIMO: scanning for occurrences of a given motif. Bioinformatics 27, 1017–1018 (2011)") at significance _P_ < 10−5 using motif models from the TRANSFAC database.Accession codes
Primary accessions
Gene Expression Omnibus
Data deposits
DNase I-seq data are available through the UCSC browser, and through the NCBI Gene Expression Omnibus (GEO) data repository under accessions GSE29692 and GSE32970. H3K4me3 data are available through the UCSC browser, and through theNCBIGEOdata repository under accession GSE35583.Data for 5Care available through the UCSC browser under accession wgEncodeEH002102. Gene expression data are available through the UCSC browser, and through the NCBI GEO data repositoryunder accessions GSE19090, GSE15805 and GSE17778.
References
- Felsenfeld, G., Boyes, J., Chung, J., Clark, D. & Studitsky, V. Chromatin structure and gene expression. Proc. Natl Acad. Sci. USA 93, 9384–9388 (1996)
Article CAS ADS Google Scholar - Gross, D. S. & Garrard, W. T. Nuclease hypersensitive sites in chromatin. Annu. Rev. Biochem. 57, 159–197 (1988)
Article CAS Google Scholar - Gaszner, M. & Felsenfeld, G. Insulators: exploiting transcriptional and epigenetic mechanisms. Nature Rev. Genet. 7, 703–713 (2006)
Article CAS Google Scholar - Li, Q., Harju, S. & Peterson, K. R. Locus control regions: coming of age at a decade plus. Trends Genet. 15, 403–408 (1999)
Article Google Scholar - Heintzman, N. D. et al. Distinct and predictive chromatin signatures of transcriptional promoters and enhancers in the human genome. Nature Genet. 39, 311–318 (2007)
Article CAS Google Scholar - Hesselberth, J. R. et al. Global mapping of protein-DNA interactions in vivo by digital genomic footprinting. Nature Methods 6, 283–289 (2009)
Article CAS Google Scholar - Boyle, A. P. et al. High-resolution mapping and characterization of open chromatin across the genome. Cell 132, 311–322 (2008)
Article CAS Google Scholar - John, S. et al. Chromatin accessibility pre-determines glucocorticoid receptor binding patterns. Nature Genet. 43, 264–268 (2011)
Article CAS Google Scholar - Song, L. et al. Open chromatin defined by DNase I and FAIRE identifies regulatory elements that shape cell-type identity. Genome Res. 21, 1757–1767 (2010)
Article Google Scholar - Harrow, J. et al. GENCODE: The reference human genome annotation for the ENCODE project. Genome Res. (in the press)
- Griffiths-Jones, S., Saini, H. K., van Dongen, S. & Enright, A. J. miRBase: tools for microRNA genomics. Nucleic Acids Res. 36, D154–D158 (2008)
Article CAS Google Scholar - Farazi, T. A., Spitzer, J. I., Morozov, P. & Tuschl, T. miRNAs in human cancer. J. Pathol. 223, 102–115 (2011)
Article CAS Google Scholar - Djebali, S. et al. Landscape of transcription in human cells. Naturehttp://dx.doi.org/10.1038/nature11233 (this issue)
- ENCODE Project Consortium An integrated encyclopedia of DNA elements in the human genome. Naturehttp://dx.doi.org/10.1038/nature11247 (this issue)
- Biggin, M. D. Animal transcription networks as highly connected, quantitative continua. Dev. Cell 21, 611–626 (2011)
Article CAS Google Scholar - Reddy, P. M., Stamatoyannopoulos, G., Papayannopoulou, T. & Shen, C. K. Genomic footprinting and sequencing of human β-globin locus. Tissue specificity and cell line artifact. J. Biol. Chem. 269, 8287–8295 (1994)
CAS PubMed Google Scholar - Forsberg, E. C., Downs, K. M. & Bresnick, E. H. Direct interaction of NF-E2 with hypersensitive site 2 of the β-globin locus control region in living cells. Blood 96, 334–339 (2000)
CAS PubMed Google Scholar - Talbot, D. & Grosveld, F. The 5′HS2 of the globin locus control region enhances transcription through the interaction of a multimeric complex binding at two functionally distinct NF-E2 binding sites. EMBO J. 10, 1391–1398 (1991)
Article CAS Google Scholar - Weisbrod, S. & Weintraub, H. Isolation of a subclass of nuclear proteins responsible for conferring a DNase I-sensitive structure on globin chromatin. Proc. Natl Acad. Sci. USA 76, 630–634 (1979)
Article CAS ADS Google Scholar - Schultz, D. C., Ayyanathan, K., Negorev, D., Maul, G. G. & Rauscher, F. J. SETDB1: a novel KAP-1-associated histone H3, lysine 9-specific methyltransferase that contributes to HP1-mediated silencing of euchromatic genes by KRAB zinc-finger proteins. Genes Dev. 16, 919–932 (2002)
Article CAS Google Scholar - Frietze, S., O’Geen, H., Blahnik, K. R., Jin, V. X. & Farnham, P. J. ZNF274 recruits the histone methyltransferase SETDB1 to the 3′ ends of ZNF genes. PLoS ONE 5, e15082 (2010)
Article ADS Google Scholar - Stergachis, A. B., Maclean, B., Lee, K., Stamatoyannopoulos, J. A. & MacCoss, M. J. Rapid empirical discovery of optimal peptides for targeted proteomics. Nature Methods 8, 1041–1043 (2011)
Article CAS Google Scholar - Henikoff, S., Henikoff, J. G., Sakai, A., Loeb, G. B. & Ahmad, K. Genome-wide profiling of salt fractions maps physical properties of chromatin. Genome Res. 19, 460–469 (2009)
Article CAS Google Scholar - Li, G. et al. Extensive promoter-centered chromatin interactions provide a topological basis for transcription regulation. Cell 148, 84–98 (2012)
Article CAS Google Scholar - Siegfried, Z. et al. DNA methylation represses transcription in vivo. Nature Genet. 22, 203–206 (1999)
Article CAS Google Scholar - O’Geen, H. et al. Genome-wide analysis of KAP1 binding suggests autoregulation of KRAB-ZNFs. PLoS Genet. 3, e89 (2007)
Article Google Scholar - Stadler, M. B. et al. DNA-binding factors shape the mouse methylome at distal regulatory regions. Nature 480, 490–495 (2011)
Article CAS ADS Google Scholar - Rasheed, Z. A., Saleem, A., Ravee, Y., Pandolfi, P. P. & Rubin, E. H. The topoisomerase I-binding RING protein, topors, is associated with promyelocytic leukemia nuclear bodies. Exp. Cell Res. 277, 152–160 (2002)
Article CAS Google Scholar - Dahle, Ø., Bakke, O. & Gabrielsen, O. S. c-Myb associates with PML in nuclear bodies in hematopoietic cells. Exp. Cell Res. 297, 118–126 (2004)
Article CAS Google Scholar - Dostie, J. et al. Chromosome Conformation Capture Carbon Copy (5C): a massively parallel solution for mapping interactions between genomic elements. Genome Res. 16, 1299–1309 (2006)
Article CAS Google Scholar - Sanyal, A., Lajoie, B., Jain, G. & Dekker, J. The long-range interaction landscape of gene promoters. Nature http://dx.doi.org/10.1038/nature11279 (this issue)
- Kim, J., Chu, J., Shen, X., Wang, J. & Orkin, S. H. An extended transcriptional network for pluripotency of embryonic stem cells. Cell 132, 1049–1061 (2008)
Article CAS Google Scholar - Tuan, D., Kong, S. & Hu, K. Transcription of the hypersensitive site HS2 enhancer in erythroid cells. Proc. Natl Acad. Sci. USA 89, 11219–11223 (1992)
Article CAS ADS Google Scholar - Neph, S. et al. An expansive human regulatory lexicon encoded in transcription factor footprints. Nature http://dx.doi.org/10.1038/nature11212 (this issue)
- Vernot, B. et al. Personal and population genomics of human regulatory variation. Genome Res. (in the press)
- Grant, C. E., Bailey, T. L. & Noble, W. S. FIMO: scanning for occurrences of a given motif. Bioinformatics 27, 1017–1018 (2011)
Article CAS Google Scholar
Acknowledgements
We thank our ENCODE colleagues for many insights into the data types generated by different centres and for help with coordinated analyses. We thank I. Stanaway for assistance with the variation analysis, and many colleagues, particularly F. Urnov, for helpful critiques of the manuscript and figures. This work was funded by National Institutes of Health grants HG004592 (J.A.S.), HG004563 (G.E.C.), GM076036 (J.M.A.) and R01MH084676 (S.R.S), and J.V. is supported by the National Science Foundation Graduate Research Fellowship under grant no. DGE-0718124. N.C.S. is supported by a National Science Foundation Graduate Research Fellowship and the Research Council of Norway. M.T. and K.G. acknowledge funding support from the caBIG In Silico Center of Excellence, NCI/NIH contract no. HHSN261200800001E.
Author information
Author notes
- Boris Lenhard
Present address: Present address: Institute for Clinical Sciences, Faculty of Medicine, Imperial College London, and MRC Clinical Sciences Centre, London W12 0NN, UK., - Robert E. Thurman, Eric Rynes and Richard Humbert: These authors contributed equally to this work.
Authors and Affiliations
- Department of Genome Sciences, University of Washington, Seattle, 98195, Washington, USA
Robert E. Thurman, Eric Rynes, Richard Humbert, Jeff Vierstra, Matthew T. Maurano, Eric Haugen, Andrew B. Stergachis, Hao Wang, Benjamin Vernot, Sam John, Richard Sandstrom, Daniel Bates, Theresa K. Canfield, Morgan Diegel, Douglas Dunn, Erika Giste, Audra K. Johnson, Tanya Kutyavin, Kristen Lee, Shane Neph, Fidencio Neri, Hongzhu Qu, Alex P. Reynolds, Vaughn Roach, Anthony Shafer, Shinny Vong, Molly Weaver, Joshua M. Akey, Peter J. Sabo & John A. Stamatoyannopoulos - Institute for Genome Sciences and Policy, Duke University, Durham, 27708, North Carolina, USA
Nathan C. Sheffield, Darin London, Alexias Safi, Lingyun Song & Gregory E. Crawford - Division of Human Biology, Fred Hutchinson Cancer Research Center, Seattle, 98109, Washington, USA
Kavita Garg & Muneesh Tewari - Department of Medicine, Division of Medical Genetics, University of Washington, Seattle, 98195, Washington, USA
Lisa Boatman, Abigail K. Ebersol, Tristan Frum, Ericka M. Johnson, Dimitra Lotakis, Eric D. Nguyen, Minerva E. Sanchez, Yongqi Yan, R. Scott Hansen, Patrick A. Navas, George Stamatoyannopoulos & Rajinder Kaul - Program in Systems Biology, University of Massachusetts Medical School, Worcester, 01605, Massachusetts, USA
Bryan Lajoie, Amartya Sanyal & Job Dekker - Institute for Cellular and Molecular Biology, University of Texas, Austin, 78712, Texas, USA
Bum-Kyu Lee & Vishwanath R. Iyer - Laboratory of Disease Genomics and Individualized Medicine, Beijing Institute of Genomics, Chinese Academy of Sciences, 100029, Beijing, China
Hongzhu Qu - Department of Biology, University of North Carolina, Chapel Hill, 27599, North Carolina, USA
Jeremy M. Simon, Zhancheng Zhang, Zhuzhu Zhang, Jason D. Lieb & Terrence S. Furey - Department of Biology and Bergen Center for Computational Science, University of Bergen, Bergen 5008, Norway,
Boris Lenhard - Department of Psychiatry and Behavioral Sciences, University of Washington, Seattle, 98195, Washington, USA
Michael O. Dorschner - Department of Medicine, Division of Genetics, Brigham & Women’s Hospital and Harvard Medical School, Boston, 02115, Massachusetts, USA
Shamil R. Sunyaev - Department of Medicine, Division of Oncology, University of Washington, Seattle, 98195, Washington, USA
John A. Stamatoyannopoulos
Authors
- Robert E. Thurman
You can also search for this author inPubMed Google Scholar - Eric Rynes
You can also search for this author inPubMed Google Scholar - Richard Humbert
You can also search for this author inPubMed Google Scholar - Jeff Vierstra
You can also search for this author inPubMed Google Scholar - Matthew T. Maurano
You can also search for this author inPubMed Google Scholar - Eric Haugen
You can also search for this author inPubMed Google Scholar - Nathan C. Sheffield
You can also search for this author inPubMed Google Scholar - Andrew B. Stergachis
You can also search for this author inPubMed Google Scholar - Hao Wang
You can also search for this author inPubMed Google Scholar - Benjamin Vernot
You can also search for this author inPubMed Google Scholar - Kavita Garg
You can also search for this author inPubMed Google Scholar - Sam John
You can also search for this author inPubMed Google Scholar - Richard Sandstrom
You can also search for this author inPubMed Google Scholar - Daniel Bates
You can also search for this author inPubMed Google Scholar - Lisa Boatman
You can also search for this author inPubMed Google Scholar - Theresa K. Canfield
You can also search for this author inPubMed Google Scholar - Morgan Diegel
You can also search for this author inPubMed Google Scholar - Douglas Dunn
You can also search for this author inPubMed Google Scholar - Abigail K. Ebersol
You can also search for this author inPubMed Google Scholar - Tristan Frum
You can also search for this author inPubMed Google Scholar - Erika Giste
You can also search for this author inPubMed Google Scholar - Audra K. Johnson
You can also search for this author inPubMed Google Scholar - Ericka M. Johnson
You can also search for this author inPubMed Google Scholar - Tanya Kutyavin
You can also search for this author inPubMed Google Scholar - Bryan Lajoie
You can also search for this author inPubMed Google Scholar - Bum-Kyu Lee
You can also search for this author inPubMed Google Scholar - Kristen Lee
You can also search for this author inPubMed Google Scholar - Darin London
You can also search for this author inPubMed Google Scholar - Dimitra Lotakis
You can also search for this author inPubMed Google Scholar - Shane Neph
You can also search for this author inPubMed Google Scholar - Fidencio Neri
You can also search for this author inPubMed Google Scholar - Eric D. Nguyen
You can also search for this author inPubMed Google Scholar - Hongzhu Qu
You can also search for this author inPubMed Google Scholar - Alex P. Reynolds
You can also search for this author inPubMed Google Scholar - Vaughn Roach
You can also search for this author inPubMed Google Scholar - Alexias Safi
You can also search for this author inPubMed Google Scholar - Minerva E. Sanchez
You can also search for this author inPubMed Google Scholar - Amartya Sanyal
You can also search for this author inPubMed Google Scholar - Anthony Shafer
You can also search for this author inPubMed Google Scholar - Jeremy M. Simon
You can also search for this author inPubMed Google Scholar - Lingyun Song
You can also search for this author inPubMed Google Scholar - Shinny Vong
You can also search for this author inPubMed Google Scholar - Molly Weaver
You can also search for this author inPubMed Google Scholar - Yongqi Yan
You can also search for this author inPubMed Google Scholar - Zhancheng Zhang
You can also search for this author inPubMed Google Scholar - Zhuzhu Zhang
You can also search for this author inPubMed Google Scholar - Boris Lenhard
You can also search for this author inPubMed Google Scholar - Muneesh Tewari
You can also search for this author inPubMed Google Scholar - Michael O. Dorschner
You can also search for this author inPubMed Google Scholar - R. Scott Hansen
You can also search for this author inPubMed Google Scholar - Patrick A. Navas
You can also search for this author inPubMed Google Scholar - George Stamatoyannopoulos
You can also search for this author inPubMed Google Scholar - Vishwanath R. Iyer
You can also search for this author inPubMed Google Scholar - Jason D. Lieb
You can also search for this author inPubMed Google Scholar - Shamil R. Sunyaev
You can also search for this author inPubMed Google Scholar - Joshua M. Akey
You can also search for this author inPubMed Google Scholar - Peter J. Sabo
You can also search for this author inPubMed Google Scholar - Rajinder Kaul
You can also search for this author inPubMed Google Scholar - Terrence S. Furey
You can also search for this author inPubMed Google Scholar - Job Dekker
You can also search for this author inPubMed Google Scholar - Gregory E. Crawford
You can also search for this author inPubMed Google Scholar - John A. Stamatoyannopoulos
You can also search for this author inPubMed Google Scholar
Contributions
Generation of DNase I data was supervised by J.A.S. and G.E.C., with data collection carried out by M.O.D., P.J.S., R.K., D.B., T.K.C., R.S.H., M.D., D.D., E.G., T.K., K.L., F.N., V.R., A. Shafer, S.V., M.W., B.-K.L., D. London, L.S., Zhancheng Z. and Zhuzhu Z. 5C experiments were supervised by J.D. and performed by A. Sanyal. Primary DNase I data processing was performed by R.S., T.S.F., A.K.J. and A.P.R. Hypersensitivity Southern blots and enhancer cloning and transfection experiments were performed by E.M.J., A.K.E., T.F., E.D.N., L.B., D. Lotakis, M.E.S. and Y.Y. and supervised by P.A.N. and G.S. H3K4me3 ChIP-seq experiments were performed by H.W. Primary analysis of DNase I data was performed by R.E.T., R.S. and R.H. Joint analysis of DNase I and transcription factor ChIP-seq data was performed by J.V., S.N., A.B.S. and H.Q. Promoter prediction analysis was performed by R.E.T. DNase I versus DNA methylation analysis was performed by M.T.M. DHS–promoter connectivity analysis was performed by E.R. Integration of DNase I and 5C data was performed by R.H. with assistance from B. Lajoie. DHS stereotyping pattern analysis was performed by E.H. Self-organizing map analysis was performed by N.C.S. and B. Lenhard. MicroRNA analysis was performed by K.G., J.M.S. and M.T. Variation analysis was performed by B.V. and E.R. under direction of S.R.S., J.M.A. and J.A.S. Data interpretation and figure design were performed by J.A.S., R.E.T., J.D.L., V.R.I., G.E.C. and T.S.F. J.A.S., R.E.T., E.R., R.H., J.V., M.T.M., A.B.S., S.J. and N.S. wrote the paper.
Corresponding author
Correspondence toJohn A. Stamatoyannopoulos.
Ethics declarations
Competing interests
The authors declare no competing financial interests.
Supplementary information
Supplementary information
This file contains Supplementary Figures 1-20, Supplementary Tables 1-10, supplementary Methods and Supplementary References. (PDF 5563 kb)
PowerPoint slides
Rights and permissions
This article is distributed under the terms of the Creative Commons Attribution-Non-Commercial-Share Alike licence (http://creativecommons.org/licenses/by-nc-sa/3.0/).
About this article
Cite this article
Thurman, R., Rynes, E., Humbert, R. et al. The accessible chromatin landscape of the human genome.Nature 489, 75–82 (2012). https://doi.org/10.1038/nature11232
- Received: 15 December 2011
- Accepted: 15 May 2012
- Published: 05 September 2012
- Issue Date: 06 September 2012
- DOI: https://doi.org/10.1038/nature11232