Lineage correlations of single cell division time as a probe of cell-cycle dynamics (original) (raw)
- Letter
- Published: 11 March 2015
- Sivan Pearl Mizrahi1,2 na1,
- Noga Weiss2,
- Oded Agam2,
- Itamar Simon1 na2 &
- …
- Nathalie Q. Balaban2 na2
Nature volume 519, pages 468–471 (2015) Cite this article
- 21k Accesses
- 148 Citations
- 40 Altmetric
- Metrics details
Subjects
Abstract
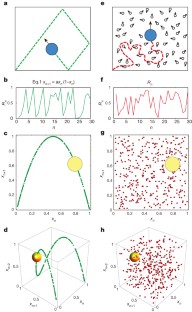
Stochastic processes in cells are associated with fluctuations in mRNA1, protein production and degradation2,3, noisy partition of cellular components at division4, and other cell processes. Variability within a clonal population of cells originates from such stochastic processes, which may be amplified or reduced by deterministic factors5. Cell-to-cell variability, such as that seen in the heterogeneous response of bacteria to antibiotics, or of cancer cells to treatment, is understood as the inevitable consequence of stochasticity. Variability in cell-cycle duration was observed long ago; however, its sources are still unknown. A central question is whether the variance of the observed distribution originates from stochastic processes, or whether it arises mostly from a deterministic process that only appears to be random. A surprising feature of cell-cycle-duration inheritance is that it seems to be lost within one generation but to be still present in the next generation, generating poor correlation between mother and daughter cells but high correlation between cousin cells6. This observation suggests the existence of underlying deterministic factors that determine the main part of cell-to-cell variability. We developed an experimental system that precisely measures the cell-cycle duration of thousands of mammalian cells along several generations and a mathematical framework that allows discrimination between stochastic and deterministic processes in lineages of cells. We show that the inter- and intra-generation correlations reveal complex inheritance of the cell-cycle duration. Finally, we build a deterministic nonlinear toy model for cell-cycle inheritance that reproduces the main features of our data. Our approach constitutes a general method to identify deterministic variability in lineages of cells or organisms, which may help to predict and, eventually, reduce cell-to-cell heterogeneity in various systems, such as cancer cells under treatment.
This is a preview of subscription content, access via your institution
Access options
Subscribe to this journal
Receive 51 print issues and online access
$199.00 per year
only $3.90 per issue
Buy this article
- Purchase on SpringerLink
- Instant access to the full article PDF.
USD 39.95
Prices may be subject to local taxes which are calculated during checkout
Additional access options:
Figure 1: Schematic illustration of stochastic versus deterministic variability.
The alternative text for this image may have been generated using AI.
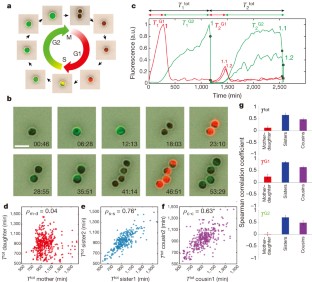
Figure 2: Pedigree analysis of the cell-cycle duration in L1210 cells.
The alternative text for this image may have been generated using AI.
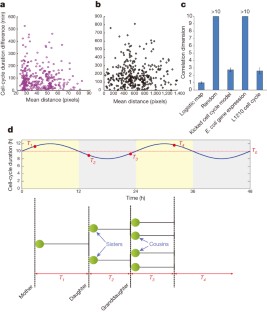
Figure 3: Evidence for deterministic inheritance of the cell cycle duration.
The alternative text for this image may have been generated using AI.
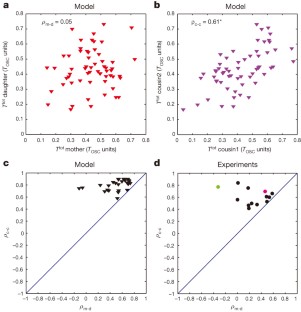
Figure 4: The cousin–mother inequality as a probe of deterministic tendencies in the inheritance of cell-cycle duration.
The alternative text for this image may have been generated using AI.
References
- Blake, W. J., Kærn, M., Cantor, C. R. & Collins, J. J. Noise in eukaryotic gene expression. Nature 422, 633–637 (2003)
Article ADS CAS Google Scholar - Sigal, A. et al. Variability and memory of protein levels in human cells. Nature 444, 643–646 (2006)
Article ADS CAS Google Scholar - Elowitz, M. B., Levine, A. J., Siggia, E. D. & Swain, P. S. Stochastic gene expression in a single cell. Science 297, 1183–1186 (2002)
Article ADS CAS Google Scholar - Huh, D. & Paulsson, J. Random partitioning of molecules at cell division. Proc. Natl Acad. Sci. USA 108, 15004–15009 (2011)
Article ADS CAS Google Scholar - Paulsson, J. Summing up the noise in gene networks. Nature 427, 415–418 (2004)
Article ADS CAS Google Scholar - Staudte, R. G., Guiguet, M. & d'Hooghe, M. C. Additive models for dependent cell populations. J. Theor. Biol. 109, 127–146 (1984)
Article CAS Google Scholar - Ferrell, J. E., Jr, Tsai, T. Y. & Yang, Q. Modeling the cell cycle: why do certain circuits oscillate? Cell 144, 874–885 (2011)
Article CAS Google Scholar - Tyson, J. J. & Novak, B. Regulation of the eukaryotic cell cycle: molecular antagonism, hysteresis, and irreversible transitions. J. Theor. Biol. 210, 249–263 (2001)
Article CAS Google Scholar - Nurse, P. Cell-cycle control - both deterministic and probabilistic. Nature 286, 9–10 (1980)
Article ADS CAS Google Scholar - May, R. M. Simple mathematical models with very complicated dynamics. Nature 261, 459–467 (1976)
Article ADS CAS Google Scholar - Shields, R. Transition-probability and origin of variation in cell-cycle. Nature 267, 704–707 (1977)
Article ADS CAS Google Scholar - Grasman, J. A deterministic model of the cell-cycle. Bull. Math. Biol. 52, 535–547 (1990)
Article CAS Google Scholar - Lloyd, D., Lloyd, A. L. & Olsen, L. F. The cell division cycle: a physiologically plausible dynamic model can exhibit chaotic solutions. Biosystems 27, 17–24 (1992)
Article CAS Google Scholar - Sakaue-Sawano, A. et al. Visualizing spatiotemporal dynamics of multicellular cell-cycle progression. Cell 132, 487–498 (2008)
Article CAS Google Scholar - Froese, G. Disbribution and interdependence of generation times of HeLa cells. Exp. Cell Res. 35, 415–419 (1964)
Article CAS Google Scholar - Kuczek, T. & Axelrod, D. E. The importance of clonal heterogeneity and interexperiment variability in modeling the eukaryotic cell-cycle. Math. Biosci. 79, 87–96 (1986)
Article Google Scholar - Cowan, R. & Staudte, R. The bifurcating autoregression model in cell lineage studies. Biometrics 42, 769–783 (1986)
Article CAS Google Scholar - Powell, E. O. Some features of the generation times of individual bacteria. Biometrika 42, 16–44 (1955)
Article Google Scholar - Grassberger, P. & Procaccia, I. Characterization of strange attractors. Phys. Rev. Lett. 50, 346–349 (1983)
Article ADS MathSciNet Google Scholar - Theiler, J., Eubank, S., Longtin, A., Galdrikian, B. & Farmer, J. D. Testing for nonlinearity in time-series - the method of surrogate data. Physica D 58, 77–94 (1992)
Article ADS Google Scholar - Skinner, J. E. Low-dimensional chaos in biological-systems. Bio/Technology 12, 596–600 (1994)
CAS PubMed Google Scholar - Wang, P. et al. Robust growth of Escherichia coli. Curr. Biol. 20, 1099–1103 (2010)
Article CAS Google Scholar - Nagoshi, E. et al. Circadian gene expression in individual fibroblasts: cell-autonomous and self-sustained oscillators pass time to daughter cells. Cell 119, 693–705 (2004)
Article CAS Google Scholar - Yang, Q., Pando, B. F., Dong, G., Golden, S. S. & van Oudenaarden, A. Circadian gating of the cell cycle revealed in single cyanobacterial cells. Science 327, 1522–1526 (2010)
Article ADS CAS Google Scholar - Hejblum, G., Costagliola, D., Valleron, A. J. & Mary, J. Y. Cell-cycle models and mother daughter correlation. J. Theor. Biol. 131, 255–262 (1988)
Article CAS Google Scholar - Altinok, A., Gonze, D., Levi, F. & Goldbeter, A. An automaton model for the cell cycle. Interface Focus 1, 36–47 (2011)
Article Google Scholar - Glass, L. & Kaplan, D. Time-series analysis of complex dynamics in physiology and medicine. Med. Prog. Technol. 19, 115–128 (1993)
CAS PubMed Google Scholar - Theiler, J. On the evidence for low-dimensional chaos in an epileptic electroencephalogram. Phys. Lett. A 196, 335–341 (1995)
Article ADS Google Scholar - Balázsi, G., van Oudenaarden, A. & Collins, J. J. Cellular decision making and biological noise: from microbes to mammals. Cell 144, 910–925 (2011)
Article Google Scholar - Tzur, A., Kafri, R., LeBleu, V. S., Lahav, G. & Kirschner, M. W. Cell growth and size homeostasis in proliferating animal cells. Science 325, 167–171 (2009)
Article ADS CAS Google Scholar - Gefen, O., Gabay, C., Mumcuoglu, M., Engel, G. & Balaban, N. Q. Single-cell protein induction dynamics reveals a period of vulnerability to antibiotics in persister bacteria. Proc. Natl Acad. Sci. USA 105, 6145–6149 (2008)
Article ADS CAS Google Scholar
Acknowledgements
We thank H. Miyoshi at the Riken Tsukuba for the Fucci markers, N. Barkai, N. Shoresh, J. Theiler, S. Kadener, L. Glass, G. Asher, A. W. Murray and J. Paulsson for discussions, and M. Gorfine and R. Heller for advice on statistical analysis. We thank Q. Yang and A. van Oudenaarden for the Cyanobacteria data sets, and the authors of ref. 24 for making their published data available online. This work was supported by the ISF (grants no. 592/10 (N.Q.B.); no. 567/10(I.S.); and no. 9/09, 302/14 (O.A.)) and the ERC Starting Grant no. 281306 (I.S.), no. 260871 (N.Q.B.), the Chief Scientist Office of the Israel Ministry of Health and the Weinkselbaum family medical research fund (I.S.). I.S. thanks the USAID’s ASHA Program for the upgrading of the FACS laboratory. S.P.M. is supported by the Clore Foundation.
Author information
Author notes
- Oded Sandler and Sivan Pearl Mizrahi: These authors contributed equally to this work.
- Itamar Simon and Nathalie Q. Balaban: These authors jointly supervised this work.
Authors and Affiliations
- Department of Microbiology and Molecular Genetics, IMRIC, The Hebrew University Hadassah Medical School, Jerusalem 91120, Israel,
Oded Sandler, Sivan Pearl Mizrahi & Itamar Simon - Racah Institute of Physics, Edmond J. Safra Campus, The Hebrew University, Jerusalem 91904, Israel,
Sivan Pearl Mizrahi, Noga Weiss, Oded Agam & Nathalie Q. Balaban
Authors
- Oded Sandler
- Sivan Pearl Mizrahi
- Noga Weiss
- Oded Agam
- Itamar Simon
- Nathalie Q. Balaban
Contributions
O.S. constructed the Fucci cell lines; S.P.M. performed the time-lapse experiments; O.S. and S.P.M. wrote the image analysis codes; N.Q.B., I.S., S.P.M. and O.S. designed the experiments; N.Q.B., O.A. and S.P.M. developed the model and analysis; N.W. analysed the Cyanobacteria data sets; N.Q.B. and S.P.M. wrote the manuscript
Corresponding authors
Correspondence toOded Agam, Itamar Simon or Nathalie Q. Balaban.
Ethics declarations
Competing interests
The authors declare no competing financial interests.
Extended data figures and tables
Extended Data Figure 1 Mean cell-cycle duration during long-term time-lapse microscopy.
Cycle durations were binned into eight bins according to time elapsed from the beginning of the experiment to the midpoint of the cell cycles (_T_mid). For each bin the mean and s.d. were calculated. Both fluorescence and bright-light exposure were minimized to prevent lengthening of the cell-cycle duration. n = 526; error bars represent the s.d.
Extended Data Figure 2 Lineage correlations in different strains and clones.
Bar graphs of the measured correlations coefficients for _T_tot of pairs of mother–daughter (red), sister (blue) and cousin (purple) cells, in different cell lines: two different clones of L1210 Fucci (n = 423, 432) and a wild-type (WT) L1210 (n = 283). The cousin–mother inequality is observed in all cases. Data are mean and s.d. of 100 independent random samples from the data set, as described in the online methods.
Extended Data Figure 3 No spatial effect detected on the cell-cycle duration.
a, Lineage correlations in microfluidic devices (clone2) (Methods). Cells are monitored under constant media flow, keeping the sample in constant conditions while washing away potential by-products of the cells’ metabolism. Correlation between cousins remains higher than mother–daughter correlation, ruling out micro-environment bias (_ρ_m-d = 0.3 ± 0.03; _ρ_s-s = 0.64 ± 0.01; _ρ_c-c = 0.57 ± 0.05; n = 381; standard deviations represent 100 independent random samples from the data set, as described in the online methods). b, c, Cycle-duration differences within quadruplet cousins. b, A schematic representation of a cousin quadruplet. c, Cell-cycle duration differences in near and far cousin pairs. No significant difference is found. (n = 66; one-tailed Wilcoxon signed rank test, α = 0.05; P > 0.15).
Extended Data Figure 4 Correlation dimension.
a, Computed dimension versus _D_E for a random series (red); L1210 cell-cycle duration data (blue); and the kicked cell cycle model (equations 1–4 (see Supplementary Information); green). b, Correlation dimension for surrogate data obtained from random shuffling of the cell-cycle durations. The mean and s.d. of 59 randomly shuffled data are shown (green), showing that the saturation in the correlation dimension observed for the experimental data (blue) is due to a deterministic process27. c, Correlation dimension for random data (red) and data from a simulation of the additive model developed by Cowan and Staudte17 (green).
Extended Data Figure 5 Correlation-dimension analysis.
The fraction of points closer than a distance r, C(r), is plotted versus r, on a log–log scale.  for small values of r. Therefore, the correlation dimension _d_corr is the saturation of the slope of log(C(r)) versus log(r), with increasing embedding dimension _D_E. a, Experimental data; b, Simulation data of the kicked cell cycle model. Note the saturation of the slope at _D_E = 3 and 4. c, Normally distributed random data with same mean and s.d. as experimental data, n = 236.
Extended Data Figure 6 Inter-generation correlation.
a, b, Simulation results of the kicked cell cycle model (equations 1–4). a, Pearson correlation of mother and daughter cells (_ρ_m-d) is predicted to vary between negative and positive values, depending on k and _T_0. b, Grandmother–granddaughter correlations (_ρ_gm-gd) follow a similar pattern, namely correlations that are close to zero, but can vary between slightly negative and positive values, as observed experimentally. The simulations were run on 300 lineages c, Correlation plot of experimentally observed total cell-cycle duration _T_tot of grandmother and granddaughter cells (clone2) s.d. of 100 independent random samples from the data set, as described in the online methods is 0.06. Spearman; _ρ_gm-gd = 0.22 ± 0.06, n = 380.
Extended Data Figure 7 Total cell-cycle duration (_T_tot) measurements and circadian phase at birth in Cyanobacteria.
Data of circadian phase and cell cycles of single Synechococcus elongatus cells from 29 lineages was obtained from Yang et al.24 a, Mother–daughter correlation (_ρ_m-d); b, Sister–sister correlation (_ρ_s-s); c, Cousin–cousin correlation (_ρ_c-c). Asterisks denote significant (P < 0.002) Spearman correlations. d, Cell-cycle duration versus circadian phase. Each dot represents a cell’s circadian phase at birth and its cell-cycle duration. Experimental data (blue) and simulation (red). The black line denotes the expected trend of the model (equation 5, see Supplementary Information). Parameters used for the simulation are shown on the right.
Extended Data Figure 8 Simulation results of the kicked cell cycle model of G1 and G2 durations fit the experimental observations.
a–c, Pearson correlations of simulated data of the total (_T_tot), G1 (_T_G1) and G2 (_T_G2) durations between mother-daughter cells (red), sisters (blue) and cousins (purple) (equations 6–8, see Supplementary Information). Parameters as in Extended Data Table 1 ; β = 0.07. d, Typical plot of the simulated data for _T_G1 versus _T_G2 (in units of _T_osc). The low correlation (−0.18; P = 0.07) despite the deterministic inheritance is consistent with the experiments: the correlation coefficients from 4 independent experiments range from –0.4 to 0.17.
Extended Data Table 1 Parameters used for the simulations presented in Fig. 3 (equations 1–4)
Extended Data Table 2 A literature compilation of correlation coefficients for mother–daughter cells and sister cells
Supplementary information
Supplementary Information (download PDF )
This file contains Supplementary Text and Data, which relates to the Grassberger-Procaccia algorithm and theoretical model. (PDF 293 kb)
Time-lapse imaging of dividing L1210 Fucci cells. (download AVI )
The video shows time lapse microscopy of dividing L1210 cells and their expression of the Fucci markers (clone 2). Cells were grown in PDMS chambers under the microscope and imaged with x20 magnification. Here a composite of phase-contrast, red fluorescence and green fluorescence is shown with time interval of 23 min. Phase contrast images were acquired at a faster rate. (AVI 7717 kb)
PowerPoint slides
Rights and permissions
About this article
Cite this article
Sandler, O., Mizrahi, S., Weiss, N. et al. Lineage correlations of single cell division time as a probe of cell-cycle dynamics.Nature 519, 468–471 (2015). https://doi.org/10.1038/nature14318
- Received: 04 August 2014
- Accepted: 13 February 2015
- Published: 11 March 2015
- Issue date: 26 March 2015
- DOI: https://doi.org/10.1038/nature14318
This article is cited by
Editorial Summary
Hidden influences on cell-cycle duration
Variability in cell-cycle duration is thought to result from random fluctuations in basic molecular processes such as messenger RNA or protein production and degradation. Based on precise measurement of cell-cycle duration in thousands of mammalian cells, Nathalie Balaban and colleagues now report counter-intuitive correlations among cousin cells, when such correlations are lost between mother and daughter cells. Based on a fully deterministic model that recapitulates their data, the authors propose that observed cellular heterogeneities in response to antibiotics or drug treatments may be attributable to processes less random than previously thought.