Observational constraints indicate risk of drying in the Amazon basin (original) (raw)
Introduction
Combined with increasing water demand due to population growth and economic development, alterations in water availability due to climate change1,2 will significantly impact human health, socioeconomic activities and ecosystems in South America3,4. Even in the present day, partly due to the lack of an adequate disaster prevention strategy, South American countries are vulnerable to floods and droughts related to unforced climate variability3. In addition, if water resources are scarce, the Amazon rainforest may be negatively affected, seriously impacting both biodiversity and the carbon cycle5,6,7. To inform adaptation and mitigation policies for future climate change, it is necessary to provide reliable water resource assessments. However, water resource assessments for South America are subject to substantial uncertainties3,4,8,9. As climate change projections from Atmosphere Ocean General Circulation models (AOGCMs) are fed into impact assessment models, AOGCM uncertainties also result in uncertain impact assessments4. Nevertheless, water resource impact studies (and other impact studies) have used projections from only a single or a few AOGCMs4 for quite some time. Recently, impact studies have started to more vigorously incorporate projections from multiple AOGCMs2,7,8,9,10,11,12,13,14,15. However, studies regarding the mechanisms of the cascade of uncertainty and creditability in impact assessments are in their early stages.
Multiple projections and/or impact assessments were used to create the best-estimate weighted ensemble mean (together with error bars) or the weighted ensemble distribution as an approximation of the probability density function. Whereas this paper focuses on the best estimate, the basic philosophy of weighting discussed below was used for both the best estimate and the probability density function. In the past, three primary approaches were used to weigh regional impact assessments from multiple AOGCMs. The first approach uses the equal-weighted ensemble, which has recently been called model democracy16. The creditability of an impact assessment is established by majority voting from AOGCMs based on the 'one-model, one-vote' assumption9,11,12,14,15. To move beyond this widely used, but naive, approach, the following two approaches have recently been investigated. One approach is to trust climate change projections from AOGCMs with high levels of accuracy for simulating the climate over a target region in the present13,17. However, because climate change patterns have spatial scales of several thousand to tens of thousands of kilometres, it is not clear whether regional climate simulations in the present can provide sufficient information for constraining the uncertainties. In the second approach, overall metrics of accuracy for global-scale present climate simulations (such as the root mean square error of the surface air temperature over a global domain) are used to select or weigh AOGCM projections in an attempt to reduce uncertainties of climate projections and relevant impact assessments. However, two studies using different overall metrics disagreed even about the sign of runoff changes in South America8,10. In addition, recent studies18,19 have suggested that the association between overall metrics and future projections is weak in ensembles of AOGCMs. One intrinsic difficulty of establishing metrics for model skills and weights is that no observations of the future climate are available. Hence, we cannot evaluate the reliabilities of future projections by directly comparing them to any corresponding observations. Metrics should at least be physically reasonable and strongly related to future projections and impact assessments; however, there is no roadmap for determining adequate metrics16 thus far.
Here, we show how to identify global-scale metrics for measuring the reliability of runoff change assessments in South America. The observational constrains indicate a higher probability of drying in the Amazon basin than that expected by the model democracy approach.
Results
Uncertainty propagation
There are substantial inconsistencies in annual mean runoff changes (Δ_R_) in South America. Supplementary Figure S1 shows the pattern of Δ_R_ from the observed climatology in 1980–1999 to the projected 2080–2099 mean under the A2 emissions scenario20 for 14 AOGCMs (Supplementary Table S1) and the ensemble mean. As in our previous study2, we performed ensembles of hydrological simulations using a global water resource model21 (hereafter H08, see Methods) to obtain Δ_R_. Here, we did not take into account the uncertainties in the water resource models. The H08 inputs were the changes in temperature (Δ_T_) and precipitation (percent change, Δ_P_) from 14 AOGCMs. The Δ_T_, Δ_P_ and Δ_R_ were normalized by the global mean temperature change for each AOGCM, meaning that we did not take into account the uncertainty in the global mean temperature change. Whereas the ensemble mean assessment showed increases of Δ_R_ over most areas of South America, the patterns of Δ_R_ were remarkably different across models.
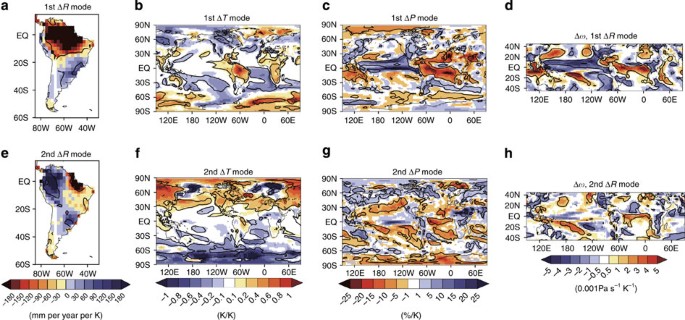
We examined the physical mechanisms underlying uncertainty propagation from climate projections to Δ_R_ (Supplementary Fig. S2). We analysed the covariance matrix among 14 annual mean Δ_R_s in South America and 14 pairs of annual mean Δ_T_s and Δ_P_s over a global domain by applying singular value decomposition (SVD) analysis22, which has been used in meteorological studies (see Methods). This statistical method identifies pairs consisting of a Δ_R_ mode and a (Δ_T_, Δ_P_) mode (Fig. 1a–d for the first mode and Fig. 1e–h for the second mode), so that the covariance between their expansion coefficients (Supplementary Fig. S3) is maximized. The first Δ_R_ mode shows a pattern of drying and wetting over the northern and southern areas of South America, respectively (Fig. 1a). This asymmetric pattern of Δ_R_ in the north versus the south is related to an increase in Δ_T_ over the eastern tropical Pacific Ocean (Fig. 1b), which is known as El-Niño-like warming23. AOGCMs with stronger El-Niño-like warming accompany a greater weakening of the Walker circulation (Fig. 1d). Downward and upward wind anomalies, which are atmospheric teleconnections of El-Niño-like warming, induce decreases and increases of Δ_P_ in northern and southern South America, respectively (Fig. 1c). These changes in precipitation lead to the positive phase of the first Δ_R_ mode.
Figure 1: First and second modes of the SVD analysis.
The alternative text for this image may have been generated using AI.
(a) The first Δ_R_ mode (mm per year per K). (b) The first Δ_T_ mode (K/K). (c) The first Δ_P_ mode (%/K). (d) The regression map between the expansion coefficient of the first Δ_R_ mode and changes in vertical pressure velocity, averaged between 850 and 250 hPa (10−3 Pa s−1 K−1). (e) The second Δ_R_ mode (mm per year per K). (f) The second Δ_T_ mode (K/K). (g) The second Δ_P_ mode (%/K). (h) The regression map between the expansion coefficient of the second Δ_R_ mode and changes in vertical pressure velocity, averaged between 850 and 250 hPa (10−3 Pa s−1 K−1). Contours in the all panel indicate statistically significant correlations at ±10% _t_-test levels.
The second Δ_R_ mode shows drying over northeast South America and wetting over most of the other regions (Fig. 1e). This pattern of Δ_R_ is related to positive and negative anomalies, relative to the ensemble mean, of Δ_T_ over the Northern and Southern Hemispheres, respectively (Fig. 1f). This north–south gradient of Δ_T_ is associated with a northward shift of the Hadley circulation24,25 over the Atlantic Ocean (Fig. 1h). This shift of the Hadley circulation induced downward wind anomalies over northeast South America, resulting in decreases in the Δ_P_ and Δ_R_ values (Fig. 1g,e). Downward wind anomalies over northeast South America are related to a convergence of low-level horizontal winds over northwest South America, leading to upward wind anomalies (Supplementary Fig. S4) and increases in Δ_P_ and Δ_R_ (Fig. 1g,e). The result, that Δ_R_ in South America is influenced by El-Niño-like warming and the north–south Δ_T_ gradient, is consistent with findings from previous studies6,17,24,26.
Present climate patterns related to impact assessments
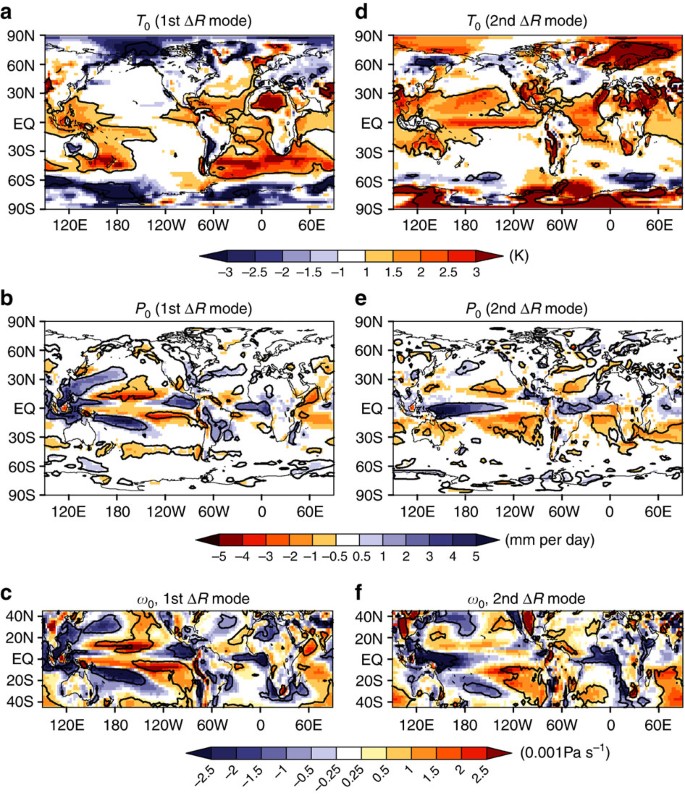
Next, we investigated whether the leading Δ_R_ modes were significantly correlated with particular, physically reasonable patterns of present climate simulations. Figure 2a–c shows the present climate (1980–1999) patterns of surface air temperature (T_0), precipitation (P_0) and atmospheric circulations regressed onto the expansion coefficients of the first Δ_R mode in the impact assessments, respectively (Supplementary Fig. S2). The first Δ_R mode is correlated with a relatively warm _T_0 over the tropical and subtropical ocean, but no significant correlation is found in the central tropical Pacific Ocean. This pattern of _T_0 is associated with higher and lower P_0 values in the western and central tropical Pacific Ocean, respectively, and is related to stronger Walker circulations in the tropical Pacific Ocean. These results indicate that AOGCMs with a stronger Walker circulation in the present climate simulations (Fig. 2c) tend to have stronger El-Niño-like warming patterns in the future climate change projections (Fig. 1b), leading to a more positive phase for the first Δ_R mode (Fig. 1a).
Figure 2: Present climate patterns related to the runoff modes.
The alternative text for this image may have been generated using AI.
(a) Regression maps between T_0 (K) in the present climate and the expansion coefficient of the first Δ_R mode. (b) Regression maps between P_0 (mm per year) in the present climate and the first Δ_R mode. (c) Regression maps between vertical pressure velocity, averaged between 850 and 250 hPa (10−3 Pa s−1), in the present climate and the first Δ_R_ mode. (d) Regression maps between T_0 (K) in the present climate and the expansion coefficient of the second Δ_R mode. (e) Regression maps between P_0 (mm yr−1) in the present climate and the second Δ_R mode. (f) Regression maps between vertical pressure velocity, averaged between 850 and 250 hPa (10−3 Pa s−1), in the present climate and the second Δ_R_ mode. Contours in the all panels indicate statistically significant correlations at ±10% _t_-test levels.
Figure 2d–f shows the present climate patterns related to the second Δ_R_ mode. The second Δ_R_ mode is correlated with more intense precipitation in the Intertropical Convergence Zone of the Atlantic Ocean and a drier subtropical ocean in the present climate simulations. This intense Intertropical Convergence Zone accompanies stronger Hadley circulations over the Atlantic Ocean (Fig. 2f). AOGCMs with stronger Hadley circulations in the present climate simulations (Fig. 2f) tend to have larger northward shifts of the Hadley circulation in the future climate projections (Fig. 1h), leading to a more positive phase for the second Δ_R_ mode (Fig. 1e).
Despite considerable efforts of climate scientists, substantial uncertainties remain in the projections of El-Niño-like warming and the north–south Δ_T_ gradient23,27,28. We identified relationships between future and present climate simulations that concern these phenomena. The physical mechanisms for the relationships between future and present climate simulations are not clear and remain to be investigated in future research.
Global-scale metrics and observational constrains
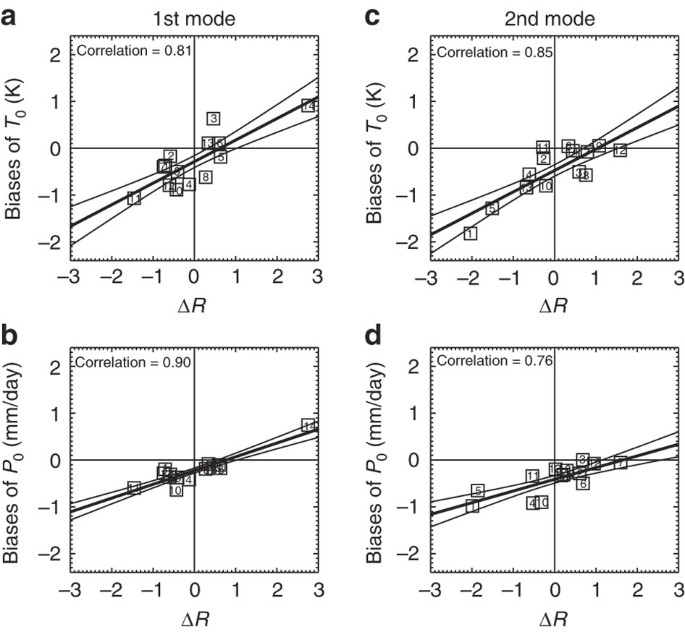
Here, to determine a set of metrics measuring bias magnitudes for each model corresponding to the leading Δ_R_ modes, we computed the inner products of the vectors of bias patterns (the differences between the climatologies predicted by each model and actual observations) for each model (Supplementary Figs S5 and S6) and the vectors of the present climate patterns associated with the leading Δ_R_ modes (Fig. 2, the norms are normalized to 1; Supplementary Fig. S7). There are clear correlations between the expansion coefficients of the leading Δ_R_ modes and the metrics of _T_0 and P_0 (the value 0 indicates the best estimate; Fig. 3). An important finding is that the ensemble mean assessment of the runoff changes (with Δ_R mode expansion coefficients of zero) has considerable negative biases for the present climate patterns corresponding to both the first and the second modes. Thus, we infer that the ensemble mean changes in the Walker and Hadley circulations are underestimated. This result is consistent with previous studies suggesting that past changes in the Walker and Hadley circulations of AOGCMs are smaller than those in the observations28,29, although it is not clear whether historical records are sufficient to constrain the model simulations30.
Figure 3: Metrics for measuring the reliability of the runoff modes.
The alternative text for this image may have been generated using AI.
(a) Scatter plot of the expansion coefficient of the first Δ_R_ mode (normalized by the inter-model standard deviation) and the T_0 biases (K). (b) Scatter plot of the expansion coefficient of the first Δ_R mode and the P_0 biases (mm per day). (c) Scatter plot of the expansion coefficient of the second Δ_R mode and the T_0 biases (K). (d) Scatter plot of the expansion coefficient of the second Δ_R mode and the _P_0 biases (mm per day). The bold and thin lines indicate linear regressions and their corresponding 10 and 90% _t_-test-based confidence intervals, respectively.
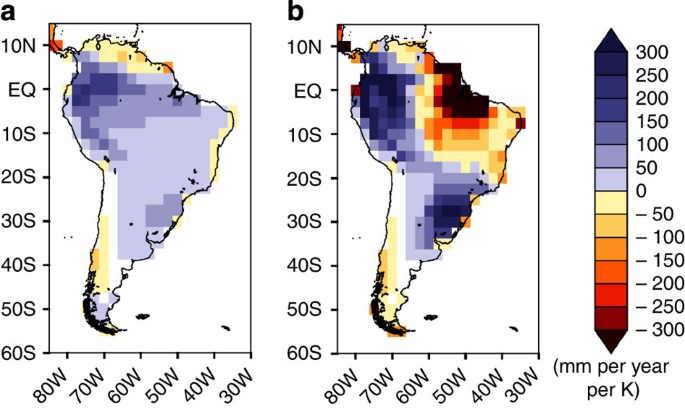
In Figure 3, about +0.7 and +1.6 s.d. of the first and second Δ_R_ mode expansion coefficients (the intersections of the regression lines with the horizontal axes) yield the best estimate (the corresponding biases of the present climate simulations are zero). If we trust the equal-weighted ensemble mean assessment, then the best estimate is 'light wetting over most of South America' (Fig. 4a). By contrast, our evaluation based on the present climate observations suggests that 'drying over the Amazon basin and wetting over the La Plata basin and in northwestern South America' (Fig. 4b) is most plausible.
Figure 4: The ensemble mean and best estimate of runoff changes.
The alternative text for this image may have been generated using AI.
(a) Changes in runoff (mm per year per K) for the ensemble mean. (b) Changes in runoff (mm per year per K) for the observationally constrained best estimate.
Discussion
In the Amazon basin, the sign of Δ_R_ is different between the ensemble mean assessment and our observationally constrained assessment. Adaptation strategies used to cope with increases and decreases of runoff are very different. It has been suggested that an over-reliance on consensus assessments could lead to inappropriate adaptation policies relating to water resources. Notably, the observationally constrained assessment of Δ_R_ seems qualitatively similar to that of the outlier model 14 (HadCM3; Fig. 4b and Supplementary Fig. S1), although this model overestimated the first Δ_R_ mode (Fig. 3a,b; also see Methods). This model projects catastrophic drying that could lead to dieback of the Amazon rainforest5,6. The probability of Amazon rainforest dieback could be higher than that indicated by projections based on model democracy.
Recently, climate scientists have been actively exploring how to evaluate, beyond the use of model democracy, the reliability of climate change projections from AOGCMs16. Although there have been a few successful examples31,32, the problem is still significant16. By contrast, most impact assessment studies use the model democracy approach or the single-model approach. We stress that our study can be used as a possible roadmap for objective development of observational constraints on impact assessments and climate projections for a given target region. Our approach can be applied not only to water resource assessments but also to other impact assessments and climate projection studies.
Investigations of the uncertainty of hydrological models remain for future work. It is better to use multiple global-scale hydrological models and the outputs from multiple AOGCMs. However, it is still difficult for us to use models developed by other institutes, although progress is being made in international coordinated intercomparison projects for global-scale hydrological models33. Although it will be possible to use multiple hydrological models in the future, we should advance our analysis methods so that we can investigate the uncertainty cascades from multiple AOGCMs to multiple hydrological models.
The incorporation of the direct CO2 effect on the transpiration of plants is a challenging issue for global-scale hydrological modelling and also remains to be investigated in future work. H08, along with most current hydrological models, does not take the CO2 effect on plants into account. Some studies have suggested that the CO2 effect on plants will have a major impact on future runoff34,35, whereas one study showed relatively small impacts36.
An alternative methodological option is analysing the direct runoff outputs from the AOGCMs rather than the outputs of H08. AOGCMs have a variety of land hydrological schemes and some AOGCMs take the CO2 effect on plants into account. However, runoffs from AOGCMs have considerable biases; for example, some AOGCMs have negative runoff values in their current climate simulations. The runoff biases in AOGCMs may be partly due to errors in land hydrological schemes and biases in the atmospheric hydrological cycles for the present climate. Therefore, it was preferable to use the outputs of H08 with bias corrections (see Methods) in this study.
Methods
Hydrological simulations
We computed Δ_R_ using a global water resource model of H08 (refs 2, 21) with a methodology typical of that adopted in previous studies of water resource assessments. H08 consists of six modules, including those for anthropogenic activities, but the two modules for natural hydrology (the land surface hydrology and the river routing modules) were used in this study. For the present climate simulation of runoff, we used the 1980–1999 meteorological forcing data set (NCC)37 as the input data for H08. For future climate simulations of runoff, we altered the input data of H08 by adding Δ_T_ to the NCC data and multiplying the NCC data by Δ_P_. It should be noted that these processes (adding Δ_T_ to the NCC data and multiplying the NCC data by Δ_P_) also act as simple bias correction techniques. By subtracting the runoff in the present climate from that in the future climate, we obtained 14 Δ_R_ values. Grids with <1mm per month runoff were eliminated from the calculations. The spatial resolution of the outputs of H08 was 1°×1°, and those of the AOGCMs vary from model to model. For convenience of analysis, these data were interpolated to a 2.5°×2.5° regular latitude/longitude grid. If outputs of some ensemble members with different initial conditions were available for a given AOGCM (Supplementary Table S1), we analysed their average.
SVD analysis
SVD analysis has often been used in meteorology22,38, but impact researchers may not be familiar with this methodology. Therefore, we describe the SVD method below.
Here, M, N_1 and N_2 are the ensemble size (=14), the number of grids for Δ_R and the number of grids for Δ_T and Δ_P_, respectively. We define a i,k as Δ_R_ for the _k_th model and _i_th grid:


Vectors  and
and  are the Δ_T_ and Δ_P_ values of the _k_th model.
  is the combination of
  and
and  :
:


Here, we remove the ensemble means from  and
and  .
.
We investigate the covariance matrix between A and B:

Here, (N_2×2)≥_N_1. Before we compute C, the following preprocesses are applied. Because the units of Δ_R, Δ_T_ and Δ_P_ are different from each other, we divide them by the corresponding inter-model standard deviations aggregated over the analysed areas. Furthermore, a i,k and b j,k are weighted by the square root of the cosine of the latitude.
We compute the SVD of matrix C:


Matrix ∑ is an _N_1×_N_1 diagonal matrix with non-negative elements σ _ll_=σ l (_l_=1,..._N_1;  , called singular values. Here
  and
and  are the _l_th left and right singular vectors of C, respectively.
The fraction of the squared Frobenius norm of the covariance matrix determined by the l_th pair of the Δ_R mode and the (Δ_T_, Δ_P_) mode is computed by
The first and second pairs explain about 45 and 20%, respectively, of the squared Frobenius norm (Supplementary Fig. S3a). The expansion coefficients of the Δ_R_ mode ( ) and the (Δ_T_, Δ_P_) mode (
 ; Supplementary Fig. S3b–c) are obtained by projecting A and B onto
  and
and  , respectively:


The correlation coefficient between the expansion coefficients,  and
and  , provides a measure of how strongly the Δ_R_ mode and the (Δ_T_, Δ_P_) mode are related to each other (Supplementary Fig. S3d). The first ten pairs have high correlations.
By regressing A onto  , we obtain the spatial pattern of Δ_R_ corresponding to the l_th (Δ_T, Δ_P_) mode:

We also compute the spatial patterns of Δ_T_ and Δ_P_ corresponding to the l_th Δ_R mode by regressing B onto  :
:

These patterns are called heterogeneous regression maps. Figure 1a–c,e–g shows heterogeneous regression maps. Heterogeneous correlations are also computed using a similar procedure. We test the statistical significance of the heterogeneous correlations at ±10% _t_-test levels.
Testing the influence of outlier model
Our observationally constrained assessment of Δ_R_ seems ro be similar to that of the outlier model 14 (HadCM3; Fig. 4b and Supplementary Fig. S1). It may be inferred that this single model had a dominant role in producing this result. However, as discussed below, our most plausible Δ_R_ pattern changed little when we excluded HadCM3 from our analyses.
We tested whether our most plausible Δ_R_ pattern is sensitive to the exclusion of HadCM3 from our analyses. Although the first and second modes of Δ_R_ and (Δ_T_, Δ_P_) obtained using the 13 AOGCMs (Supplementary Fig. S8) were similar to those of all of the 14 AOGCMs (Fig. 1), there were some differences. Here, we defined  and
and  as the spatial pattern vectors of the first and second Δ_R_ modes, respectively, using all 14 AOGCMs (Fig. 1). In addition,
  and
and  were the first and second runoff modes when we excluded HadCM3 from our analyses (Supplementary Fig. S8). When we projected
  and
and  onto
onto  and
and  (before the projections, their norms were normalized to 1), it appeared that
  and
and  were mixtures of
  and
and  :
:


Thus, the present climate patterns associated with  and
and  (Supplementary Fig. S9) were also somewhat different from those of
  and
and  (Fig. 2). The most plausible
  and
and  modes were about −0.5 and +1.6 s.d. of their expansion coefficients, respectively (Supplementary Fig. S10). Supplementary Figure S11 demonstrates the runoff changes in the ensemble mean and the best estimate. Although the drying region in the Amazon basin is narrower in the Supplementary Figure 11b than in Figure 4b, these patterns are qualitatively similar to each other. Therefore, our estimates of the most plausible Δ_R_ patterns are not sensitive to the inclusion of HadCM3 in our analyses.
Testing the influence of internal variability
Here, we tested whether our finding is sensitive to the influence of internal variability. For some models, the outputs from members of different initial condition ensembles (DICEs) were available (Supplementary Table S1). In this case, to reduce the influence of internal variability on our results, we used the average of the DICE members for each model in our analyses. Here, we computed the first and second Δ_R_ mode coefficients and the corresponding _T_0 and _P_0 biases for each DICE member (Supplementary Fig. S12). There is little difference between the DICE members for each model. Therefore, our finding is not sensitive to the influence of internal variability.
Additional Information
How to cite this article: Shiogama, H. et al. Observational constraints indicate risk of drying in the Amazon basin. Nat. Commun. 2:253 doi: 10.1038/ncomms1252 (2011).
References
- Allen, M. R. & Ingram, W. J. Constraints on future changes in climate and the hydrologic cycle. Nature 419, 224–232 (2002).
ADS CAS PubMed Google Scholar - Shiogama, H. et al. Emission scenario dependencies in climate change assessments of the hydrological cycle. Clim. Change 99, 321–329 (2010).
Article ADS CAS Google Scholar - Bates, B. C., Kundzewicz, Z. W., Wu, S. & Palutikof, J. P. (eds.), Climate Change and Water. Technical Paper of the Intergovernmental Panel on Climate Change (IPCC Secretariat, 2008).
- Kundzewicz, Z. W. et al. in Climate Change 2007: Impacts, Adaptation and Vulnerability. Contribution of Working Group II to the Fourth Assessment Report of the Intergovernmental Panel on Climate Change (Cambridge Univ. Press, 2007).
- Cox, P. M. et al. Acceleration of global warming due to carbon-cycle feedbacks in a coupled climate model. Nature 408, 184–187 (2000).
Article ADS CAS PubMed Google Scholar - Cox, P. M. et al. Amazonian forest die-back under climate-carbon cycle projections for the 21st century. Theor. Appl. Climatol. 78, 137–156 (2004).
Article ADS Google Scholar - Malhi, Y. et al. Climate change, deforestation, and the fate of the Amazon. Science 319, 169–172 (2008).
Article ADS CAS PubMed Google Scholar - Milly, P. C. D., Dunne1, K. A. & Vecchia, A. V. Global pattern of trends in streamflow and water availability in a changing climate. Nature 438, 347–350 (2005).
Article ADS CAS PubMed Google Scholar - Scholze, M., Knorr, W., Arnell, N. W. & Prentice, I. C. A climate change risk analysis for world ecosystems. Proc. Natl Acad. Sci. 103, 13116–13120 (2006).
Article ADS CAS PubMed Google Scholar - Nohara, D., Kitoh, A., Hosaka, M. & Oki, T. Impact of climate change on river discharge projected by multimodel ensemble. J. Hydromet. 7, 1076–1089 (2006).
Article Google Scholar - Arnell, N. W. Climate change and global water resources: SRES emissions and socio-economic scenarios. Global Environ. Chang. 14, 31–52 (2004).
Article Google Scholar - Oki, T. & Kanae, S. Global hydrological cycles and world water resources. Science 313, 1068–1072 (2006).
Article ADS CAS PubMed Google Scholar - Wilby, R. L. & Harris, I. A framework for assessing uncertainties in climate change impacts: low-flow scenarios for the River Thames, UK. Water Resour. Res. 42, W02419 (2006).
Article ADS Google Scholar - Lobell, D. B. et al. Prioritizing climate change adaptation needs for food security in 2030. Science 319, 607–610 (2008).
Article CAS PubMed Google Scholar - Masutomi, Y., Takahashi, K., Harasawa, H. & Matsuoka, Y. Impact assessment of climate change on rice production in Asia in comprehensive consideration of process/parameter uncertainty in general circulation models. Agri. Ecosys. Env. 131, 281–291 (2009).
Article Google Scholar - Knutti, R. The end of model democracy? Clim. Change 102, 395–404 (2010).
Article ADS Google Scholar - Li, W. H., Fu, R. & Dickinson, R. E. Rainfall and its seasonality over the Amazon in the 21st century as assessed by the coupled models for the IPCC AR4. J. Geophys. Res. 111, D02111 (2006).
Article ADS Google Scholar - Abe, M. et al. Correlation between inter-model similarities in spatial pattern for present and projected future mean climate. SOLA 5, 133–136 (2009).
Article ADS Google Scholar - Knutti, R. et al. Challenges in combining projections from multiple models. J. Clim. 23, 2739–2758 (2010).
Article ADS Google Scholar - Nakicenovic, N. et al. Special Report on Emissions Scenarios, Summary for Policy Makers (Intergovernmental Panel on Climate Change, 2000).
- Hanasaki, N. et al. An integrated model for the assessment of global water resources - Part 1: Model description and input meteorological forcing. Hydrol. Earth Syst. Sci. 12, 1007–1025 (2008).
Article ADS Google Scholar - Wallace, J. M., Smith, C. & Bretherton, C. S. Singular value decomposition of winter time sea surface temperature and 500-mb height anomalies. J. Clim. 5, 562–576 (1992).
Article ADS Google Scholar - Collins, M. & and the CMIP Modelling Groups El Niño or La Niña-like climate change? Clim. Dynam. 24, 89–104 (2005).
Article ADS Google Scholar - Liebmann, B. & Marengo, J. A. Interannual variability of the rainy season and rainfall in the Brazilian Amazon Basin. J. Clim. 14, 4308–4318 (2001).
Article ADS Google Scholar - Broccoli, A. J., Dahl, K. A. & Stouffer, R. J. Response of the ITCZ to Northern Hemisphere cooling. Geophys. Res. Lett. 33, L01702 (2006).
Article ADS Google Scholar - Harris, P. P., Huntingford, C. & Cox, P. M. Amazon basin climate under global warming: the role of the sea surface temperature. Phil. Trans. R. Soc. B 363, 1753–1759 (2008).
Article PubMed Google Scholar - Good, P., Lowe, J. A. & Rowell, D. P. Understanding uncertainty in future projections for the tropical Atlantic: relationships with the unforced climate. Clim. Dyn. 32, 205–218 (2009).
Article Google Scholar - DiNezio, P., Clement, A. & Vecchi, G. A. Reconciling differing views of tropical Pacific climate change. Eos Trans. AGU 91, 141–142 (2010).
Article ADS Google Scholar - Johanson, C. M. & Fu, Q. Hadley cell widening: model simulations versus observations. J. Climate 22, 2713–2725 (2009).
Article ADS Google Scholar - Wittenberg, A. T. Are historical records sufficient to constrain ENSO simulations? Geophys. Res. Lett. 36, L12702 (2009).
Article ADS Google Scholar - Hall, A. & Qu, X. Using the current seasonal cycle to constrain snow albedo feedback in future climate change. Geophys. Res. Lett. 33, L03502 (2006).
ADS Google Scholar - Boé, J., Hall, A. & Qu, X. September sea-ice cover in the Arctic Ocean projected to vanish by 2100. Nat. Geosci. 2, 341–343 (2009).
Article ADS Google Scholar - Dirmeyer, P. A. et al. GSWP-2 - multimodel anlysis and implications for our perception of the land surface. B. Am. Meteorol. Soc. 87, 1381–1397 (2006).
Article Google Scholar - Gedney, N. et al. Detection of a direct carbon dioxide effect in continental river runoff records. Nature 439, 835–838 (2006).
Article ADS CAS PubMed Google Scholar - Betts, R. A. et al. Projected increase in continental runoff due to plant responses to increasing carbon dioxide. Nature 448, 1037–1041 (2007).
Article ADS CAS PubMed Google Scholar - Gerten, D., Rost, S., von Bloh, W. & Lucht, W. Causes of change in 20th century global river discharge. Geophys. Res. Lett. 35, L20405 (2008).
Article ADS Google Scholar - Ngo-Duc, T., Polcher, J. & Laval, K. A 53-year forcing data set for land surface models. J. Geophys. Res. 110, D06116 (2005).
ADS Google Scholar - Gyalistras, D., von Storch, H., Fischlin, A. & Beniston, M. Linking GCM simulated climatic changes to ecosystems models. Case studies of statistical downscaling in the Alps. Climate Res. 4, 167–189 (1994).
Article ADS Google Scholar
Acknowledgements
We acknowledge the AOGCM modelling groups, the Program for Climate Model Diagnosis and Intercomparison, and the Working Group on Coupled Modelling of the World Climate Research Programme for their roles in making the multi-AOGCM data set available. This work was funded by the Global Environment Research Fund (S-5) of the Ministry of the Environment of Japan and by the Innovative Program of Climate Change Projection for the twenty-first century for Scientific Research from the Ministry of Education, Culture, Sports, Science and Technology of Japan. NEC SX8R at NIES was used for the computation.
Author information
Authors and Affiliations
- Atmospheric Environment Division, National Institute for Environmental Studies, 16-2 Onogawa, Tsukuba, Ibaraki 305-8506, Japan.,
Hideo Shiogama & Toru Nozawa - Center for Global Environmental Research, National Institute for Environmental Studies, 16-2 Onogawa, Tsukuba, Ibaraki 305-8506, Japan.,
Seita Emori, Manabu Abe & Kiyoshi Takahashi - Atmosphere and Ocean Research Institute, The University of Tokyo, 5-1-5 Kashiwanoha, Kashiwa, Chiba 277-8568, Japan.,
Seita Emori - Social and Environmental Systems Division, National Institute for Environmental Studies, 16-2 Onogawa, Tsukuba, Ibaraki 305-8506, Japan.,
Naota Hanasaki - Center for Environmental Science in Saitama, 914 Kamitanadare, Kazo, Saitama 347-0115, Japan.,
Yuji Masutomi - Graduate School of Environmental Studies, Nagoya University, Furo-cho, Chikusa-ku, Nagoya 464-8601, Japan.,
Toru Nozawa
Authors
- Hideo Shiogama
- Seita Emori
- Naota Hanasaki
- Manabu Abe
- Yuji Masutomi
- Kiyoshi Takahashi
- Toru Nozawa
Contributions
H.S., S.E. and N.H. directed this work. N.H., Y.M. and K.T. performed the hydrological simulations. H.S., M.A. and T.N. analysed the data. H.S. wrote the paper. All authors discussed the results and commented on the manuscript.
Corresponding author
Correspondence toHideo Shiogama.
Ethics declarations
Competing interests
The authors declare no competing financial interests.
Supplementary information
Rights and permissions
About this article
Cite this article
Shiogama, H., Emori, S., Hanasaki, N. et al. Observational constraints indicate risk of drying in the Amazon basin.Nat Commun 2, 253 (2011). https://doi.org/10.1038/ncomms1252
- Received: 13 December 2010
- Accepted: 23 February 2011
- Published: 29 March 2011
- DOI: https://doi.org/10.1038/ncomms1252