Calibrating genomic and allelic coverage bias in single-cell sequencing (original) (raw)
Introduction
Single-cell sequencing has provided unique insights into the genetic diversity of living organisms and among different cells within the same individual1,2,3. Recent single-cell analyses have uncovered different clonal populations within a single tumour4,5, revealed genomic diversity in gametes6,7 and neurons8,9, and resolved historical cellular lineages during development10,11. Single-cell sequencing also has many potential clinical applications, such as characterization of circulating tumour cells12,13 or fine-needle aspirates for clinical diagnostics.
A major drawback of single-cell sequencing, however, is the need to amplify genomic DNA before genomic characterizations14,15,16,17. Owing to the limited processivity (<100 kb) and strand extension rate (<100 nt per second) of DNA polymerases, the amplification of large genomes requires priming and extension at millions of loci, each amplified 10,000- to 1,000,000-fold. Such a large number of polymerase reactions inevitably generate amplification errors that confound the detection of genetic variants (Supplementary Fig. 1). Furthermore, differential priming efficiencies and extension rates result in uneven amplifications across the genome18,19 and skewed representations of homologous chromosomes. These variations both compromise variant detection sensitivity and may lead to incorrect genotypes5,12. Although technological innovations may improve the fidelity of whole-genome amplification (WGA)15,16,17,20,21,22,23, statistical fluctuations in the amplifications of millions of different DNA templates will persist.
As genetic variants are detected by the relative abundance of variant-containing DNA templates in the library, non-uniformity in genome coverage directly impacts the sensitivity to detect variants. For example, grossly non-uniform libraries emphasize only overrepresented regions of the genome, and contain little information on other regions. Current methods to assess the uniformity of WGA rely on either direct visual inspection or various statistical measures of the sequencing coverage at the base level18,22 or the allele level5,12. These empirical methods and metrics generally require substantial sequencing (10 × or greater) and only gauge the deviation of amplified DNA from the ‘uniform’ bulk DNA at a particular sequencing depth. They fail, however, to characterize the intrinsic non-uniformity resulting from WGA that is independent of sequencing depth (Fig. 1a,b). Moreover, the nature of the main sources of bias remains poorly characterized (Fig. 1c).
Figure 1: Non-uniformity in genome coverage and its impact on the sequencing yield.
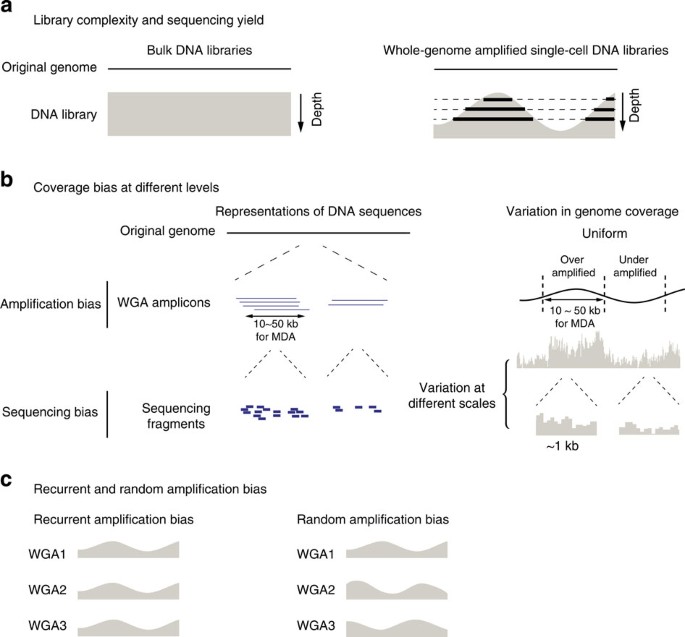
(a) Dependence of the information yield on the sequencing depth. Deeper sequencing of bulk libraries yields information on a larger population of cells; deeper sequencing of whole-genome amplified single-cell libraries reveals information on a larger fraction of the genome (thick lines). (b) Genome coverage bias at different levels. ‘Amplification bias’ (top): whole-genome amplification generates coverage bias at the amplicon level, which is ∼10–50 kb for multi-strand displacement amplification. ‘Sequencing bias’ (bottom): non-uniformity in the selection of sequencing fragments can be caused by multiple sources of bias including whole-genome amplification: the variation in sequencing coverage can be observed from 100 bp to multiple megabases. (c) Schematic representations of recurrent and random amplification bias from multiple independent amplifications of the same DNA material.
Here, we report a systematic analysis of the coverage bias in single-cell whole-genome amplification. We show that the structure of individual WGA amplicons imparts a dominant amplification bias on length scales longer than the average size of sequencing fragments. Sequencing at low depths (0.1–1 × ) can effectively reveal this variation in the amplicon-level coverage and enable accurate predictions of the depth-of-coverage yield when sequencing single-cell libraries to arbitrary depths. We further characterized the amplification bias between homologous chromosomes using analytically solvable models and validated these model predictions of allelic coverage by experimentally observed coverage at heterozygous sites. These results provide a framework for quality assurance of single-cell libraries and for estimating the sensitivity to detect local variants—such as single-nucleotide variants or chromosomal translocations—present in an individual cell at a given sequencing depth. Finally, we demonstrate that the amplification bias in multi-strand displacement amplification (MDA) is more random than recurrent. Although such random bias cannot be corrected systematically, it suggests an efficient census-based strategy to accurately determine somatic genetic variants in small biopsy samples by sequencing multiple single cells from the same sample at modest depths.
Results
Information yield from bulk and single-cell sequencing
In bulk DNA libraries, each sequencing fragment represents genomic information from an individual cell; therefore, the information content increases with the sequencing depth until fragments are sequenced to exhaustion. The information content of a DNA library (‘library complexity’) is thus measured by the total number of distinct molecules (sequencing fragments) in the library24,25,26. This measure is essentially determined by the total number of cells (or the total amount of genomic DNA) used to prepare the library (Fig. 1a, left panel). In single-cell DNA sequencing, WGA precedes the construction of a DNA library and introduces non-uniformity across the genome: As sequencing depth increases, more genomic regions are uncovered (Fig. 1a, right panel). Hence the fraction of the single-cell’s genome uncovered at a given sequencing depth determines the information content of single-cell sequencing. This measure ultimately depends on the uniformity of genome coverage, or the magnitude and spread of whole-genome amplification bias, and is conceptually equivalent to a ‘single-cell DNA library complexity.’
Amplicon-level bias dominates coverage variation
Visual inspection of single-cell sequencing coverage suggests that the genome coverage varies at many different length scales (Fig. 1b). To systematically evaluate the amplification bias in single-cell libraries, we sequenced MDA-generated DNA libraries of diploid RPE-1 cells (5–10 × ) and compared the sequencing coverage to a matched, unamplified bulk DNA library (∼12 × ). To eliminate the effects of sequencing depths, we computationally down-sampled the bulk and single-cell DNA libraries and calculated the auto-correlation of base-level coverage in disomic chromosome 1 at various depths to examine coverage correlations at all length scales (Fig. 2a, Supplementary Fig. 2). Both bulk and MDA libraries exhibited a correlation at length scale _l_c≈100 bp, reflecting the sequencing read length (101 bp). Looking more closely, we also identified a correlation at _l_c≈250 bp, corresponding to the average size of the paired-end fragments (Supplementary Fig. 2). As expected, the magnitude of such correlations at the fragment scale decays with increasing sequencing depth.
Figure 2: Statistical analysis of whole-genome amplification bias and coverage uniformity.
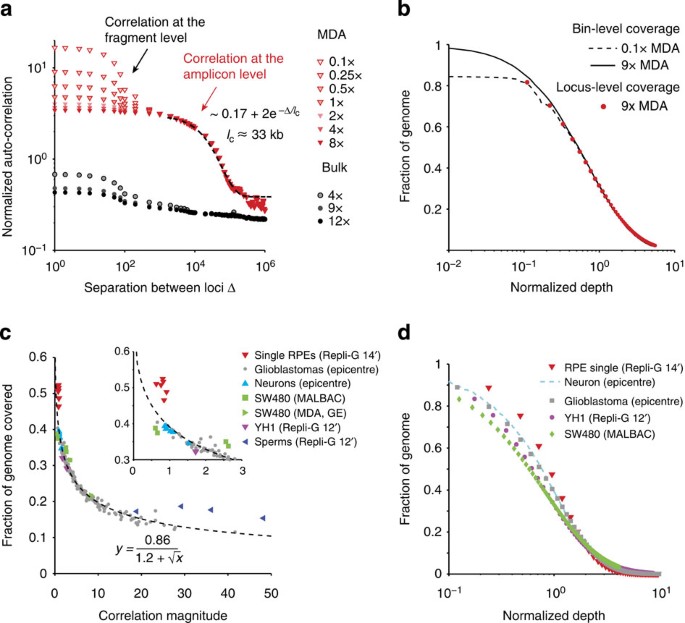
(a) Autocorrelation in the genome coverage of a two-cell RPE-1 DNA library (RPE#1) amplified by multi-strand displacement amplification (MDA). The same library independently sequenced to 0.1 × (open triangles) and to 8 × (solid triangles) and exhibits a correlation above 1 kb that is invariant at intermediate depths (shaded triangles) from downsampling of the 9 × sequencing data. Black-dashed curve represents exponential fitting of the autocorrelation in the 1–100 kb range as 2+0.17e−Δ/_l_c with a correlation length _l_c=33 kb (95% confidence interval: 27–42 kb). This correlation is absent in the bulk library sequenced to different depths. Both the bulk and the MDA-generated libraries show a sequencing-fragment-level correlation (_l_c=100 bp) that decays with the sequencing depth. (b) The identical normalized cumulative coverage at bin size 1/2 × _l_c evaluated from the 9 × (solid) and from the 0.1 × sequencing (dashed) reflects the same amplicon-level variation due to MDA. The agreement between bin-level (dashed and solid lines) and base-level (red dots) depth-of-coverage curves further suggests that the bin-level variation contributes the dominant amplification bias. See Supplementary Figs 2 and 4–8 for more examples of the correlation (a) and coverage (b) analysis of single-cell sequencing data from different studies. (c) Relationship between genome coverage (% covered at 1 × mean sequencing depth) and amplification bias (measured by the amplitude of the amplicon-level correlation) of single-cell libraries from different studies. Coverage is evaluated at Chr. 1 for both haploid sperms and diploid cells, as well as the SW480 tumour cells (disomic in Chr. 1), and at Chr. 10 (monosomic), Chr. 12 (disomic) and Chr. 13 (disomic) for glioblastoma nuclei. The inverse dependence is fitted with an empirical formula, y_=0.86/(1.2+√_x) (R2=0.98). (d) Comparison of the cumulative coverage in the most uniform single-cell library from each study. Data were directly evaluated from high-depth sequencing of all samples except the neuron library for which the curve was interpolated from 0.5 × sequencing as in b.
Besides the fragment-level correlations, the bulk DNA sequencing coverage showed minimal correlation between loci separated by more than 1 kb. In contrast, single-cell libraries exhibited a prominent correlation in 1–100 kb that is independent of the sequencing depth. Independent sequencing of the same single-cell library to 0.1 × on the Illumina MiSeq platform and to 9 × on the HiSeq platform revealed the same correlation with a characteristic length _l_c≈33 kb (Fig. 2a). The sequencing depth-independent correlation reflects the intrinsic non-uniformity in the DNA library and suggests a characteristic length scale of amplification bias.
The predominant correlation at _l_c suggests that adjacent loci within this distance have comparable coverage. This observation implies that the primary source of coverage variation (or amplification bias) is at or above the distance _l_c. Therefore, statistical variation of coverage at the single-base level should reflect coverage variation at the amplicon level. To test this hypothesis, we computed the cumulative distribution of bin-level coverage (bin size≈17 Kb, half of _l_c). Normalizing the bin-level coverage by the mean depth-of-coverage, we found the cumulative distribution of bin-level coverage to be nearly identical between independent sequencing at 9 × or at 0.1 × (Fig. 2b), confirming that the amplicon-level coverage variation is intrinsic to the amplified DNA but independent of the sequencing depth. Furthermore, the cumulative distribution of single-base coverage at 9 × sequencing depth aligned with the bin-level coverage (Fig. 2b, Supplementary Fig. 2), suggesting that the amplicon-level variation was indeed the dominant source of non-uniformity in single-cell libraries.
To further validate this conclusion, we computed the depth-of-coverage curves and the Lorenz curves for the bulk RPE-1 library and a single RPE-1 library by MDA at different bin sizes (Supplementary Fig. 3). For the bulk library, the distribution of single-base-level coverage is indistinguishable from that evaluated at the bin level when the bin size is smaller than the fragment size (∼300 bp); above this scale, the bin-level distribution is more uniform than the single-base level distribution, reflecting smoothing of coverage non-uniformity.
By contrast, for the MDA-generated library, the distribution of single-base-level coverage remains constant until the bin size exceeds the amplicon size, ∼10 kb. Characterization of coverage non-uniformity by Lorenz curves22 also confirmed that the same bias was observed for bin sizes less than or comparable to the amplicon size and was independent of the sequencing depth. In particular, at sequencing depths <<1 × , the majority of the genome is uncovered and shows no variation in the single-base-level coverage; amplification bias, however, is manifested in the correlation between covered loci and can be evaluated by low-pass sequencing. For typical MDA-generated libraries, the amplicon size is on the order of 10 kb, hence, at 0.1 × sequencing depth, there are 0.1 × 10⁴/100≈10 reads (assuming 100 bp single-end reads) on average for each amplicon. As long as the number of reads per amplicon is much larger than the statistical variation due to random selection in sequencing (for example, assuming poisson distribution, the standard deviation of the observable is given by the square root of the expectation), the percentage of such amplicons can be accurately calculated. At 0.1 × sequencing, the amplicon-level coverage can accurately predict the fractional genome coverage down to 0.1 × mean depth, when there is approximately one read for each of these under-represented amplicons; below this depth, low-pass sequencing at 0.1 × cannot distinguish between regions that are severely under-amplified (<0.1 × mean depth) and those that dropped out of amplification.
Magnitude of amplicon-level variation determines coverage
We tested the validity of the correlation analysis by analysing DNA libraries generated from different types of cells and by different amplification technologies. For this purpose, we analysed single-cell sequencing data of additional RPE-1 samples (Supplementary Fig. 2) and data from multiple published studies, including frozen glioblastoma nuclei27 (Supplementary Fig. 4), single diploid lymphoblastoid cells5 (Supplementary Fig. 5), frozen single neuron nuclei8 (Supplementary Fig. 6), single sperms6 (Supplementary Fig. 7) and SW480 tumour cells22 (Supplementary Fig. 8); all samples were amplified by MDA. The SW480 cells were also amplified by quasi-linear multiple annealing and looping-based amplification cycles (MALBAC). The amplicon size in MDA-generated libraries ranged from 5 to 50 kb, with the sperm libraries having the lowest _l_c≈5 kb (Supplementary Fig. 7). Interestingly, MDA of hundreds or thousands of neurons exhibited similar amplicon sizes between 10 and 20 kb (Supplementary Fig. 6), consistent with estimates by standard and alkaline gel electrophoresis8. In contrast, MALBAC showed a much shorter correlation length ∼600 bp (Supplementary Fig. 8), consistent with the reported average amplicon size (500–1,500 bp, ref. 22). We also found significant correlations at the fragment-size level in one single-cell library and the reference bulk library5 that persisted at high sequencing depths (Supplementary Fig. 5); these correlations reflected substantial GC bias at the fragment level absent in the other bulk libraries and likely arose during library preparation due to PCR. Despite the vastly different correlation lengths evident in MDA and MALBAC amplifications, our analysis accurately predicted the cumulative coverage distribution in all libraries sequenced to above 10 × from computationally down-sampled sequencing data at 1 × or less (Supplementary Figs 2 and 4–8).
To benchmark the performance of different single-cell libraries, we compared the fraction of covered genome (≥1 × ) when each library was sequenced to 1 × . This percentage was either computed directly from down-sampled data (when the original data had higher depths) or inferred from the depth-of-coverage curve when the original data had lower depths. The coverage benchmark was plotted against the magnitude of amplicon-level variation as measured by the plateau correlation strength at the amplicon scale (Methods, Fig. 2c). As expected, smaller amplification bias results in a larger fraction of covered genome. Out of the five published single-cell DNA sequencing studies analysed here, the single-neuron libraries had the best overall uniformity, followed by the two single YH1 libraries; the MALBAC libraries overall had less amplification bias than MDA, although optimized MDA libraries performed equally well. The frozen glioblastoma libraries (59 total) exhibited a range of variations that can be fitted by an empirical relationship
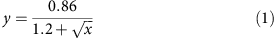
where y is the percentage of covered genome and x is the (dimensionless) correlation magnitude. Except for the single-sperm libraries that exhibited substantial bias, all other analysed data closely followed this relationship. This result suggested that the uniformity of genome coverage is solely determined by the amplicon-level variation but not the amplicon size. Therefore, one can directly use this empirical relationship to benchmark the uniformity of single-cell libraries by the correlation magnitude that can be accurately computed from low-pass sequencing ∼0.1 × .
We further selected the best single-cell libraries from each study and compared the fraction of genome covered at different depths as observed in the original high-depth sequencing (Fig. 2d). Owing to the different sequencing depths applied to these libraries, we plotted all cumulative genome coverage against the normalized depth (by the mean depth). The benchmark of amplification uniformity as measured by the depth-of-coverage curve agrees with the computed correlation magnitude (Fig. 2c inset).
Finally, we also analysed the base-level coverage in single-cell libraries amplified by degenerate oligonucleotide primed PCR (DOP–PCR)28. The correlation was evident both at the read length level (∼50 bp) and on a longer scale of ∼200 bp (Supplementary Fig. 9) that is consistent with the size of purified DOP-PCR product4. In comparison with MDA- or MALBAC-generated libraries, the smaller overall correlation magnitude (at the amplicon level) explains the better uniformity of DOP-PCR. Interestingly, even for the MDA generated libraries, shorter amplicon size tends to result in better uniformity (Supplementary Fig. 9); the underlying mechanism for this observation requires further characterization.
Genome coverage variation reflects allele-level bias
Coverage at the locus level includes contributions from homologous chromosomes (the allele-level coverage). The same non-uniformity in the genome coverage, however, may result from different combinations of non-uniformity at the allelic level (Fig. 3a). Although allele coverage determines the sensitivity to detect heterozygous variants, we rarely consider this aspect in bulk sequencing due to the comparable contributions of all alleles and largely uniform coverage of the genome. In single-cell libraries, however, we often observe disproportionately represented alleles and numerous loci may exhibit ‘allelic dropout’5,12. Consequently, the detection sensitivity of hemizygous variants is measured by the allele coverage and needs to be derived from the genome coverage.
Figure 3: Amplification bias of homologous chromosomes.
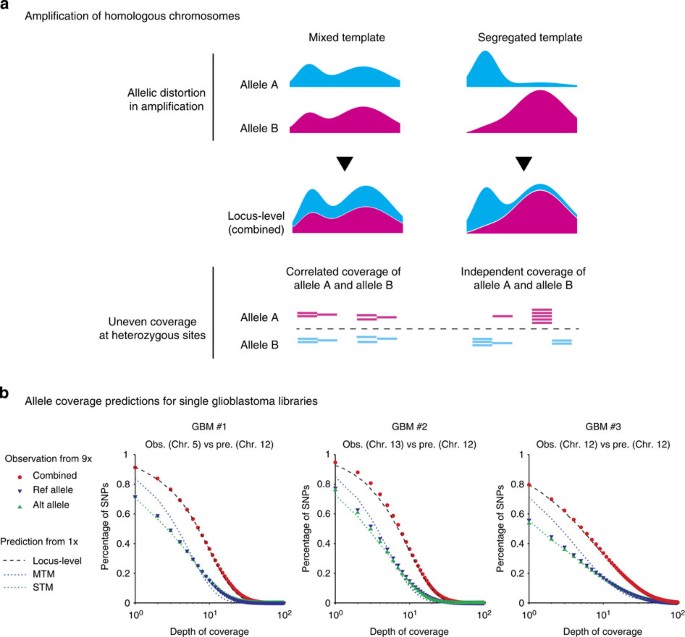
(a) Schematic illustration of the ‘mixed template model’ and the ‘segregated template model’ reflecting different allele-level contributions to the same locus-level coverage. (Methods, Supplementary Fig. 10). (b) Comparison of the allele coverage predictions (‘Pre.’) from 1 × sequencing depth with the observed coverage at heterozygous sites (‘Obs.’) at 9 × sequencing depth in three single glioblastoma libraries. The combined coverage of reference and alternate bases (red dots) at 9 × sequencing validates the prediction from 1 × sequencing (dashed curve). The allele coverage (reference or alternate) is then predicted from the combined coverage assuming mixed templates (MTM, blue dotted lines) or segregated templates (STM, green dotted lines) and compared with the coverage of reference (blue triangles) or alternate (green triangles) bases at heterozygous sites. The predictions were made from the sequence coverage in disomic Chr. 12 but the agreement with observations in different disomic chromosomes demonstrate that amplification bias is consistent in all chromosomes.
To predict the allele coverage from the locus-level genome coverage, we considered two limiting scenarios: a ‘segregated template model’ (STM) assuming completely independent amplification of homologous chromosomes, and a ‘mixed template model’ (MTM) assuming identical coverage of homologous chromosomes (as expected in bulk sequencing, Fig. 3a). The difference between the two models is most evident in highly amplified regions: STM implies preferential amplification of one allele, whereas MTM suggests that both alleles have been highly amplified. Both models are analytically solvable and can be easily implemented computationally (Methods, Supplementary Fig. 10).
We compared the model predictions for allele-level coverage with the observation at germline heterozygous sites detected from bulk DNA sequencing (Fig. 3b, Supplementary Figs 5 and 11). For glioblastoma libraries (Fig. 3b), both locus- and allele-level coverage was calculated from disomic chromosome 12 at 1 × sequencing depth. Coverage at heterozygous sites was evaluated for different disomic chromosomes (5, 12 and 13) from higher-depth sequencing at 9–10 × . As expected, the total coverage (reference plus alternate bases) at these sites agreed well with the prediction for locus-level coverage, reflecting similar amplification bias for different chromosomes with the same copy number. Meanwhile, coverage of either reference or alternate bases followed the same distribution as predicted by the STM model. These results suggested homologous chromosomes are amplified almost independently during WGA and manifest the same degree of amplification bias. This discovery was further underscored by the agreement between the observed coverage of monosomic chromosome 10 and the STM allele-coverage prediction (Supplementary Fig. 11).
We further verified that coverage of alternate or reference alleles was indeed independent of each other in the glioblastoma samples by looking at the distribution of alternate and reference reads at heterozygous sites in disomic chromosome 5 (Supplementary Fig. 12). Interestingly, the two-cell RPE-1 libraries showed positive correlations between the counts of the reference and of the alternate alleles (Supplementary Fig. 12), consistent with the MTM model (Supplementary Fig. 11). Of the two published single YH1 libraries5, one agreed better with the MTM model and the other agreed with the STM model (Supplementary Fig. 5). Whether this difference resulted from the cell’s initial condition (frozen versus fresh), the stage of cell cycle, or other factors requires further characterization.
Census-based strategy enables efficient variant detection
Our analytical prediction of the allele coverage measures the average probability of capturing a single-variant read in single-cell sequencing. In sequencing analysis, however, more than one observation of the variant is necessary to mitigate sequencing errors. This requirement substantially reduces the percentage of detectable variants at low sequencing depths. In one example (GBM #4, correlation magnitude ≈4 for disomic chromosomes), the normalized allele coverage implied that only 13.3% of clonal hemizygous variants could be confidently detected at a mean sequencing depth of 1 × when requiring at least two reads for each variant (Supplementary Fig. 11). This percentage increased with sequencing depth to a limit of 79% at 100 × . In contrast, the sensitivity to detect a subclonal mutation with allelic fraction of 0.4 in a bulk library at 10 × sequencing is ∼80% and quickly reaches >95% at a sequencing depth of 20 × (ref. 29). The reduced dependence of detection sensitivity on sequencing depth for single-cell libraries suggested that deep sequencing of an individual library is not an efficient approach to increase power for detecting variants from libraries prepared by WGA.
To overcome this challenge, we devised an approach to sequence a large number of single-cell genomes at only modest depths (∼1 × ). We simultaneously controlled for errors resulting from random MDA artifacts or from sequencing by requiring true variants to appear in multiple libraries (‘census based’, Fig. 4a). We expected this population-based approach to be effective only when the amplification bias is random, but not recurrent (Fig. 1c). We thus evaluated the correlation between the coverage of reference and alternate alleles in four independent glioblastoma libraries. The small covariance (∼0.01) between the coverage of each given allele in different libraries is consistent with random MDA bias (Table 1). These data contrasted with recurrent locus-specific amplification bias in degenerate-oligonucleotide-primed PCR methods such as GenomePlex30.
Figure 4: Variant detection in single-cell genomes.
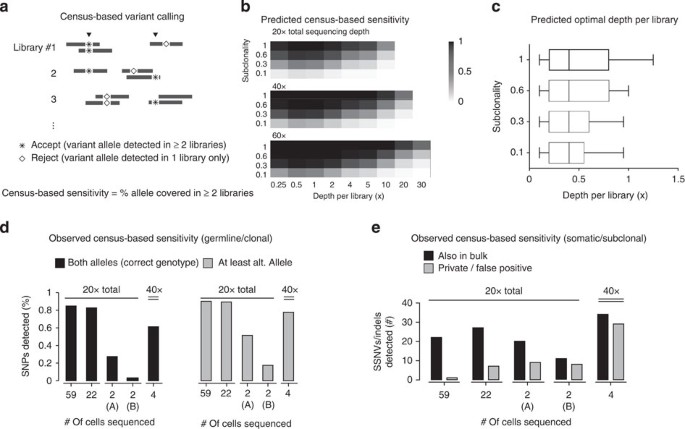
(a) Census-based variant calling requires that acceptable variants be observed in at least two independent single-cell libraries. (b) Estimates of the census-based detection sensitivity for a population of independently amplified single-cell libraries all assumed to have similar amplification bias as GBM #4 (Supplementary Fig. 11). Optimal detection sensitivity is achieved at roughly 0.5 × depth-per-library regardless of the sub-clonal fraction or the total sequencing depth. (c) Optimal depth-per-library for census-based variant detection in a population of independently amplified single-cell libraries assumed to have similar coverage bias. The range of the optimal depths is calculated on the basis of the amplification bias observed in single glioblastoma libraries in Fig. 2b. For libraries with more bias or for the detection of variants with lower clonal fractions, it is optimal to sequence more libraries at modest depths (0.1–0.5 × ). (d) Observed coverage of reference and alternate bases at heterozygous SNP sites in disomic Chr. 5 as an estimate of the census-based detection sensitivity for clonal variants. A varying number of single glioblastoma nuclei (59, 22 and 2) were sequenced to the same total depth (20 × ) and genotyped at germline heterozygous SNP sites. Group (A) included two cells with the best uniformity and group (B) included two cells with average uniformity. For either heterozygous coverage or the detection of alternate bases, the larger pools offer better sensitivity than the two groups of two cells. (e) Comparison between somatic non-synonymous variants detected in different-sized pools of single cells sequenced to the same total depths (20 × ). The truth set (48 variants in total) included 43 variants that were detected in both 30 × whole-genome and 120 × whole-exome sequencing of bulk tumour DNA, plus five additional variants detected in bulk whole-genome and single-cell sequencing. At the same overall sequencing depth, census-based detection from a population of cells (59 and 22) offers higher sensitivity and better specificity over deep sequencing of two libraries. A larger number of private/false positive mutations are observed when individual samples are sequenced to higher depths, and these private calls often arise from sporadic sequencing errors that coincide with amplification errors.
Table 1 Overlap and correlation between allele coverage in independent single-cell libraries by multi-strand displacement amplification.
We next examined how many single cells sequenced to the same total depth would maximize the total allele coverage by census-based variant detection using a representative library with modest bias (GBM #4, correlation magnitude ≈4, Fig. 4b). In all the cases, our model predicted maximum allele coverage when each individual cell was sequenced to a modest depth (∼1 × ). We repeated this calculation using each of the other libraries as the representative, and found that the optimal depth for detecting clonal and subclonal variants is always ≲ 1 × (Fig. 4c).
To test this experimentally, we sequenced each of the following subsets of single glioblastoma libraries to 20 × total depth: 59 libraries (∼0.33 × per library), 22 libraries (∼1 × per library), two libraries (∼10 × each, group A) with minimal bias (correlation magnitude ≈0.9 for disomic chromosomes) and two libraries (∼10 × each, group B) with average bias (correlation magnitude =2∼4). We genotyped germline heterozygous single-nucleotide polymorphisms (SNPs) and detected somatic single-nucleotide variants and small insertion/deletions (indels) by the census-based strategy and compared the call sets with results from bulk DNA sequencing. For germline SNPs in disomic chromosome 5, we observed that census-based detection in the two pools of single-cell libraries (59 and 22 each) each uncovered more than 80% of all SNPs detected in bulk, while the two sets of two libraries with minimal and average bias uncovered only ∼30 and ∼5% of the heterozygous sites, respectively (Fig. 4d). Even combining all four deeply sequenced libraries together to a total depth of 40 × still cannot reach the detection sensitivity offered by the two larger groups. A similar improvement in sensitivity was observed for the detection of somatic single-nucleotide variants and indels among the single cells sequenced to ∼0.33 × and ∼1 × per library (as opposed to ∼10 × per library), detecting more somatic variants found in bulk whole-exome sequencing with fewer private or false positive calls (Fig. 4e, Supplementary Data 1–5). The false positive calls usually occur at low allele frequencies within each library and likely reflect recurrent amplification errors and sequencing errors. Such errors are less frequent when the library is sequenced to a low depth and can be suppressed by requiring more than one read for each variant. Together, these data validate our statistical estimates of the variant detection sensitivity from a population of single cell libraries and demonstrate that a census-based strategy using only modest depths of sequencing for many single cells can substantially improve both sensitivity and specificity for detecting variants compared with deep sequencing of individual libraries.
Discussion
Here we have established a universal method to characterize the amplification bias in single-cell DNA libraries at both locus and allele levels. On the basis of our discovery that intrinsic amplification bias occurs predominantly at the amplicon level, we demonstrated that the cumulative distribution of bin-level coverage (with bin size set to the length scale of dominant amplification bias) directly predicts the depth-of-coverage at any sequencing depth. We further derived a quantitative measure of amplification bias that can directly predict locus-level coverage via an empirical relationship. Our analysis thus provides a statistical description of the relationship between the genomic coverage of single-cell DNA libraries and the intrinsic amplification bias. This metric provides a robust benchmark that enables a quantitative prediction of the complexity of single-cell libraries from low-pass sequencing (0.01∼0.1 × ).
We demonstrated that amplification of different chromosomes (including different homologous chromosomes) in a single cell is often independent (‘segregated template model’), reflecting random priming and amplification. This biophysical feature is fundamentally different from amplification from bulk DNA, where allele-level coverage is strongly correlated31,32 (‘mixed template model’). We proposed analytically solvable models that can quantitatively predict the allele coverage of single-cell libraries at any sequencing depth. These models provide the basic framework for estimating the detection sensitivity of hemizygous genetic variants by single-cell sequencing.
The characteristic length in the coverage autocorrelation also determines the scale at which the source of amplification bias should be characterized. In bulk DNA libraries, a dominant bias at the fragment length level is shown to be associated with the sequence content (GC%), but such bias quickly decays at longer length scales (Supplementary Figs 5 and 6). In MDA-generated libraries, however, we observed substantial variation even in regions with similar GC content (Supplementary Fig. 6). This is in sharp contrast to MDAs from bulk samples18,31,32,33. Such a wide range of variation reflects random priming bias17 instead of recurrent polymerase extension bias, and may also depend on the size of DNA templates after cell lysis, which is known to affect displacement efficiency21. Our discoveries of the amplicon-level correlation and independent allele amplifications are both consistent with the dominant bias being generated in the early stage of amplification of single DNA templates and reflect the discrete nature of single-molecule biochemical reaction. As early stage bias can be exponentially amplified during subsequent cycles of amplification, limited amplification should result in better uniformity27,34.
The random nature of single-cell genome amplification further underscores the necessity of single-cell-specific bioinformatic tools and experimental design. Deep sequencing of single-cell libraries to recover measures of variant alleles easily extends the sequencing cost and becomes prohibitive for libraries with extreme bias. Our analyses suggest a more practical approach by (1) preparing individual sequencing libraries from many independent samples and (2) ranking and selecting the best libraries on the basis of the complexity and the allelic coverage predicted based on low-pass whole-genome sequencing of each library (∼0.1 × ) before extensive sequencing.
For clinical samples with a limited number of cells, such as fine-needle aspirates or circulating tumour cells, the most interesting genetic variants are shared among the cells, including both subclonal and clonal variants. For this purpose, it is most efficient to perform ‘census-based variant detection’ from multiplexed sequencing of independently amplified single-cell DNA libraries each sequenced to modest depths (∼1 × ). The census-based variant detection strategy simultaneously controls random errors due to sequencing (0.1–1% per sequenced base) or amplification (∼1% loci with error reads exceeding 10% allele frequency, Supplementary Fig. 7, refs 27, 34) and maximizes the total allele coverage at a given sequencing depth by sampling many independently amplified libraries, thus enabling accurate detection of somatic variants and dissection of clonal heterogeneity.
One technical complication in single-cell sequencing is DNA contamination. Contamination of non-human-genomic DNA before whole-genome amplification will result in a large percentage of sequencing reads that are not mapped to the reference assembly, which can be readily identified and excluded by low-pass sequencing. The census-based strategy also effectively controls human genomic DNA contamination limited to one single-cell library. Contaminations to multiple single-cell libraries are usually present at many more copies than a single-cell genome at the affected loci and should be recognizable as they are substantially amplified after whole-genome amplification.
At the current stage, errors introduced during WGA prohibit an accurate characterization of individual genetic variants within a single cell. (This task can be accomplished through independent amplifications of biological replicates after cell division.) It is, however, possible to infer global features of mutagenesis, such as the mutation rates in tumour progenitor cells or circulating tumour cells, by single-cell sequencing after correcting the total number of detected genetic variants by the statistical power for detecting variants in a single-cell library sequenced to a certain depth. Our analyses have laid the foundation for single-cell genetic variant detection by calibrating the amplification bias at both genomic and allelic levels.
Methods
Amplification and sequencing of RPE-1 cells
The hTERT RPE-1 (ATCC) cell line stably expressing GFP-H2B was cultured and treated as follows: Briefly, cells were transfected with a pool of siRNAs (Smartpool, Dharmacon) against p53 using RNAiMAX (Invitrogen) according to the manufacturer’s instructions. Eighteen hours later, cells were treated with Nocodazole (100 ng ml−1; Sigma) for 6 h. The G2/M arrested cells were collected by mitotic shake-off and replated after three washes with medium. Four hours after replating, G1-released cells were sorted into 384-well tissue culture plates and cultured. Confirmed single cells were allowed to divide once, before being washed twice with PBS and lysed and amplified within the 384-well tissue culture plate as outlined above35.
Amplified DNA from two RPE-1 cells after one round of cell division was subject to standard whole-genome DNA library preparation and assessed by low-pass sequencing ∼0.1 × using the MiSeq platform (Illumina). DNA libraries of RPE cells (three total) were then sequenced to 4–9 × on the HiSeq2500 platform (Illumina). Bulk RPE-1 DNA was sequenced to ∼12 × on the HiSeq2500 platform (Illumina).
Processing of single-cell sequencing data
Sequencing reads from published studies were downloaded from the NCBI Short Read Archive. For the diploid YH genome, we downloaded all sequencing runs of the bulk reference (SRR294761) and two single-cell samples, ‘BGI_YH1’ (SRR294759) and ‘BGI_YH2’ (SRR294760). For diploid neurons, we downloaded all the data from SRP014781, including sequencing data for the bulk DNA, and for the whole-genome amplified products from single-cell DNA, 100-cell DNA and 50,000-cell DNA. For haploid sperms, we downloaded the deep sequencing data of eight single sperm libraries, ‘Sperm23’ (SRS344176), ‘Sperm24’ (SRS344190), ‘Sperm 27’ (SRS344191), ‘Sperm28’ (SRS344192), ‘Sperm101’ (SRS344222), ‘Sperm113’ (SRS344223), ‘Sperm135’ (SRS344224), ‘Sperm136’ (SRS344225). For SW480 tumour cells, we obtained data corresponding to the bulk reference (SRS374235), a single-cell MDA library (SRS375060) and five single-cell MALBAC libraries (SRS373654, SRS374233, SRS375671, SRS375672, SRS375673). The data of the glioblastoma libraries were generated from a previous study and can be accessible from SRP052627.
Reads were aligned to the human genome reference (hg19/GRCh37) using bwa (http://bio-bwa.sourceforge.net/) in the paired-end mode. The RPE and glioblastoma libraries were aligned by ‘bwa aln’ followed by ‘bwa sampe’ with default parameters. The remaining data were aligned by ‘bwa mem’. PCR duplicates were removed by MarkDuplicates from PICARD (http://picard.sourceforge.net/). Sequencing data of the glioblastoma libraries and the matching blood were re-calibrated and indel-realigned by GATK (http://www.broadinstitute.org/gatk/) before variant detection.
Down-sampling of deep sequencing data to ∼1 × was done by DownsampleSam from PICARD. Base-level sequencing coverage was enumerated by the DepthOfCoverage module from GATK with minimum read mapping quality set to 5.
To evaluate the allele coverage in RPE-1 MDA libraries, we detected heterozygous SNPs in Chr. 1 of the RPE-1 cells from the sequencing of bulk RPE-1 DNA (∼12 × ) and individual MDA libraries by UnifiedGenotyper from GATK; only variants with Qual. ≥100 and at least three reference and three alternate reads in the bulk sample were selected to evaluate the allele coverage in MDA libraries. For other samples, we genotyped HapMap SNPs (v3.3) to estimate the allelic coverage; only variants found to be heterozygous in the matching blood with Qual. ≥500 were selected and genotyped in each set of glioblastoma libraries. Somatic single-nucleotide variants and small insertions/deletions were detected by HaplotypeCaller from GATK in each set of glioblastoma libraries and in the bulk library, and by MuTect29 from bulk whole-exome sequencing.
Computation of auto-correlation function of sequence coverage
The dimensionless auto-correlation function of coverage is defined as
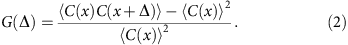
The brackets denote average over all genomic loci x and Δ measures the spread of correlation. In computing the auto-correlation functions, we only include regions not adjacent to the assembly gaps. (Adjacency is determined by the step Δ.)
The correlation function is fitted to an exponential form to estimate the correlation length _l_c:

For MDA, the correlation length _l_c is on the order of 10 kb and the correlation function G(Δ) is roughly constant above the fragment length (∼300 bp) and below the correlation length _l_c. In this regime, G(Δ) can be written as
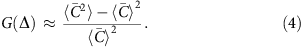
Here  is the average coverage within each bin [x, x+Δ). It becomes evident that G(Δ) measures the standard deviation of bin-level coverage. For convenience, we choose to evaluate G(Δ) at Δ=1 kb as a quantitative metric of the magnitude of amplification bias (correlation magnitude).
Statistical models for predicting allele coverage from genome coverage
The power to detect a genetic variant is given by the probability that this variant locus (usually of one chromosome) is represented in the sequencing data, or the relative abundance of variant-supporting reads. But the direct observable in sequencing data is the total number of reads covering all possible alleles, that is,

where C is the total observed coverage at a given locus as a sum of contributions from each allele denoted by _m_i.
In the presence of amplification bias, both C and _m_i’s vary across the genome. The distribution of C across different loci can be straightforwardly evaluated from the depth-of-coverage curve; here, we want to infer the statistical distribution of _m_i when the distribution of C is known. The STM assumes that amplifications of homologous chromosomes are independent. As a consequence, the counts of reference and of alternate bases at heterozygous sites are independent, and one highly amplified allele may dominate over the remaining ones. In the MTM, different alleles are assumed to be amplified to the same extent at every individual locus. As a result, the counts of reference and of alternate bases at heterozygous sites follow a symmetric binomial distribution.
In mathematical terms, _m_i’s are independent of each other but follow the same distribution in STM. In this scenario, one can numerically compute the distribution of _m_i from the characteristic functions C(k) and m(k) (that is, the Fourier transforms of the probability distribution for C and m), which satisfy

Here, we present an iterative method to calculate the distribution of _m_i and illustrate this method using a diploid genome (that is, _n_=2).
At a given sequencing depth, denote the total percentage of loci that are covered ≥1 × by f,

the percentage of loci that are covered in a particular allele is denoted by

It is then straightforward to see that

or

Hence, in a region with n alleles, the probability that a given allele is covered is given by

For diploid genomes, this becomes

We can expand this further to compute the coverage at higher depths. For example,

If we denote the percentage of loci where total coverage is at or above two as _f_2, and the percentage of loci covered at or above two for each allele as _λ_2, then we have

or
The iteration can be continued to calculate the allele coverage at any depth,
or (denoting _λ_0=1, _λ_1=λ and so on.)
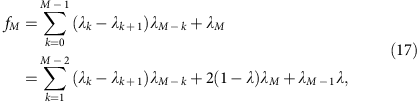
which gives
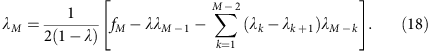
In the mixed template model, we assume that the local coverage C is a mixture of all alleles randomly sampled at the same frequency. In disomic regions, this implies that m follows a binomial distribution B(C, 0.5) at any total coverage C. Under this model, we have
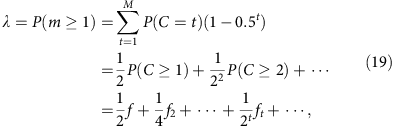
where the sum runs over all observed local coverage (_t_=1, 2, … M). The series converges quickly as both f t and the exponential prefactor decay quickly. Furthermore, one easily verifies that when f is small, this result is equal to the segregated template model to the leading order (f/2).
It is also straightforward to calculate the allele coverage at higher depths.
Census-based detection sensitivity from a pool of single-cell libraries
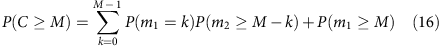
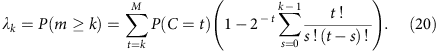
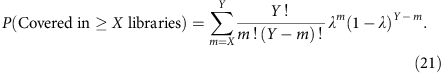
As the percentage of genome that is covered at or above 1 × at any sequencing depth can be estimated, we can also predict the census-based detection power for hemizygous variants in a pool of single-cell libraries. Consider a total number of Y libraries having similar amplification bias and the probability of observing a hemizygous variant in any of the Y libraries is given by λ, then the probability for observing this variant in a subset of libraries (X out of Y) is given by
We can then compute this for a subclonal variant at clonal fraction y in a total of Z libraries from
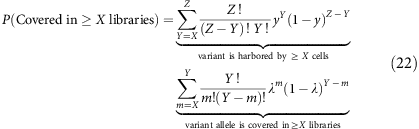
where random selection of cells containing the subclonal variant follows a binomial distribution B(Z,y).
Additional information
Accession codes: The sequence data have been deposited in the Short Read Archive from NCBI under the following accession codes: RPE-1 bulk (SRX858057); two-cell RPE libraries (SRX858832, SRR1779331 for RPE #1, SRR1779329 for RPE #2, SRR1779330 for RPE #3); single RPE libraries (SRX858836, SRX858838, SRX858840, SRX858841); glioblastoma bulk whole-genome sequencing (SRX848889); glioblastoma bulk whole-exome sequencing (SRX857666); single-glioblastoma nuclei pool #1 (59 nuclei, SRX858332); single-glioblastoma nuclei pool #2 (22 nuclei, SRR1778915, SRR1779027, SRR1779078, SRR1779079, SRR1779080, SRR1779083, SRR1779085, SRR1779088, SRR1779089, SRR1779091, SRR1779092, SRR1779093, SRR1779095, SRR1779098, SRR1779157, SRR1779161, SRR1779163, SRR1779167, SRR1779172, SRR1779174, SRR1779175, SRR1779177); deeply sequenced single-glioblastoma nuclei (SRX858848, SRR1779345 for GBM #1, SRR1779347 for GBM #2; SRR1779348 for GBM #3; SRR1779350 for GBM #4); whole-genome sequencing of blood reference for the glioblastoma patient (SRX851083); whole-exome sequencing of the blood reference for the glioblastoma patient (SRX857684).
How to cite this article: Zhang, C.-Z. et al. Calibrating genomic and allelic coverage bias in single-cell sequencing. Nat. Commun. 6:6822 doi: 10.1038/ncomms7822 (2015).
References
- Kalisky, T., Blainey, P. & Quake, S. R. Genomic analysis at the single-cell level. Annu. Rev. Genet. 45, 431–445 (2011).
Article CAS Google Scholar - Shapiro, E., Biezuner, T. & Linnarsson, S. Single-cell sequencing-based technologies will revolutionize whole-organism science. Nat. Rev. Genet. 14, 618–630 (2013).
Article CAS Google Scholar - Chi, K. R. Singled out for sequencing. Nat. Methods 11, 13–17 (2014).
Article CAS Google Scholar - Navin, N. et al. Tumour evolution inferred by single-cell sequencing. Nature 472, 90–94 (2011).
Article ADS CAS Google Scholar - Hou, Y. et al. Single-cell exome sequencing and monoclonal evolution of a JAK2-negative myeloproliferative neoplasm. Cell 148, 873–885 (2012).
Article CAS Google Scholar - Wang, J., Fan, H. C., Behr, B. & Quake, S. R. Genome-wide single-cell analysis of recombination activity and de novo mutation rates in human sperm. Cell 150, 402–412 (2012).
Article CAS Google Scholar - Lu, S. et al. Probing meiotic recombination and aneuploidy of single sperm cells by whole-genome sequencing. Science 338, 1627–1630 (2012).
Article ADS CAS Google Scholar - Evrony, G. D. et al. Single-neuron sequencing analysis of L1 retrotransposition and somatic mutation in the human brain. Cell 151, 483–496 (2012).
Article CAS Google Scholar - McConnell, M. J. et al. Mosaic copy number variation in human neurons. Science 342, 632–637 (2013).
Article ADS CAS Google Scholar - Shalek, A. K. et al. Single-cell transcriptomics reveals bimodality in expression and splicing in immune cells. Nature 498, 236–240 (2013).
Article ADS CAS Google Scholar - Xue, Z. et al. Genetic programs in human and mouse early embryos revealed by single-cell RNA sequencing. Nature 500, 593–597 (2013).
Article ADS CAS Google Scholar - Lohr, J. G. et al. Whole exome sequencing of circulating tumor cells provides a window into metastatic prostate cancer. Nat. Biotechnol. 32, 479–484 (2014).
Article CAS Google Scholar - Ni, X. et al. Reproducible copy number variation patterns among single circulating tumor cells of lung cancer patients. Proc. Natl Acad. Sci. USA 110, 21083–21088 (2013).
Article ADS CAS Google Scholar - Eberwine, J., Sul, J.-Y., Bartfai, T. & Kim, J. The promise of single-cell sequencing. Nat. Methods 11, 25–27 (2013).
Article Google Scholar - Blainey, P. C. The future is now: single-cell genomics of bacteria and archaea. FEMS Microbiol. Rev. 37, 407–427 (2013).
Article CAS Google Scholar - Zhang, L. et al. Whole genome amplification from a single cell: implications for genetic analysis. Proc. Natl Acad. Sci. USA 89, 5847–5851 (1992).
Article ADS CAS Google Scholar - Zhang, K. et al. Sequencing genomes from single cells by polymerase cloning. Nat. Biotechnol. 24, 680–685 (2006).
Article CAS Google Scholar - Pinard, R. et al. Assessment of whole genome amplification-induced bias through high-throughput, massively parallel whole-genome sequencing. BMC Genomics 7, 216 (2006).
Article Google Scholar - Geigl, J. B. et al. Identification of small gains and losses in single cells after whole genome amplification on tiling oligo arrays. Nucleic Acids Res. 37, e105 (2009).
Article Google Scholar - Dean, F. B. et al. Comprehensive human genome amplification using multiple displacement amplification. Proc. Natl Acad. Sci. USA 99, 5261–5266 (2002).
Article ADS CAS Google Scholar - Lage, J. M. et al. Whole genome analysis of genetic alterations in small DNA samples using hyperbranched strand displacement amplification and array-CGH. Genome Res. 13, 294–307 (2003).
Article CAS Google Scholar - Zong, C., Lu, S., Chapman, A. R. & Xie, X. S. Genome-wide detection of single-nucleotide and copy-number variations of a single human cell. Science 338, 1622–1626 (2012).
Article ADS CAS Google Scholar - Gole, J. et al. Massively parallel polymerase cloning and genome sequencing of single cells using nanoliter microwells. Nat. Biotechnol. 31, 1126–1132 (2013).
Article CAS Google Scholar - Lander, E. S. & Waterman, M. S. Genomic mapping by fingerprinting random clones: a mathematical analysis. Genomics 2, 231–239 (1988).
Article CAS Google Scholar - DePristo, M. A. et al. A framework for variation discovery and genotyping using next-generation DNA sequencing data. Nat. Genet. 43, 491–498 (2011).
Article CAS Google Scholar - Daley, T. & Smith, A. D. Predicting the molecular complexity of sequencing libraries. Nat. Methods 10, 325–327 (2013).
Article CAS Google Scholar - Francis, J. M. et al. EGFR variant heterogeneity in glioblastoma resolved through single-nucleus sequencing. Cancer Discov. 4, 956–971 (2014).
Article CAS Google Scholar - Wang, et al. Clonal evolution in breast cancer revealed by single nucleus genome sequencing. Nature 512, 155–160 (2014).
Article ADS CAS Google Scholar - Cibulskis, K. et al. Sensitive detection of somatic point mutations in impure and heterogeneous cancer samples. Nat. Biotechnol. 31, 213–219 (2013).
Article CAS Google Scholar - Voet, T. et al. Single-cell paired-end genome sequencing reveals structural variation per cell cycle. Nucleic Acids Res. 41, 6119–6138 (2013).
Article CAS Google Scholar - Hosono, S. et al. Unbiased whole-genome amplification directly from clinical samples. Genome Res. 13, 954–964 (2003).
Article CAS Google Scholar - Paez, J. G. et al. Genome coverage and sequence fidelity of phi29 polymerase-based multiple strand displacement whole-genome amplification. Nucleic Acids Res. 32, e71 (2004).
Article Google Scholar - Pugh, T. J. et al. Impact of whole genome amplification on analysis of copy number variants. Nucleic Acids Res. 36, e80 (2008).
Article CAS Google Scholar - De Bourcy, et al. A quantitative comparison of single-cell whole genome amplification methods. PLoS ONE 9, e105585 (2014).
Article ADS Google Scholar - Ganem, N. J., Godinho, S. A. & Pellman, D. A mechanism linking extra centrosomes to chromosomal instability. Nature 460, 278–282 (2009).
Article ADS CAS Google Scholar
Acknowledgements
We thank Dr David Pellman for sharing the sequencing data on RPE cells, M. Leibowitz, X. Cai and G. Evrony for discussions, and the Koch Institute Swanson Biotechnology Center (specifically the BioMicro Center) for technical support. C.-Z.Z. was supported by the National Cancer Institute (U24CA143867 to M.M.). V.A.A. was supported, in part, by a graduate fellowship from the National Science Foundation. J.C.L. is a Camille Dreyfus Teacher-Scholar. This work was supported by the Bridge Project, a collaboration between Koch Institute for Integrative Cancer Research at MIT and the Dana-Farber/Harvard Cancer Center (DF/HCC) to (J.C.L., K.L.L. and M.M.) and the National Brain Tumor Society. This work was also supported in part by Janssen Pharmaceuticals, Inc. and the Koch Institute Support (core) Grant P30-CA14051 from the National Cancer Institute.
Author information
Author notes
- Cheng-Zhong Zhang and Viktor A. Adalsteinsson: These authors contributed equally to this work
Authors and Affiliations
- Department of Medical Oncology, Dana-Farber Cancer Institute, Boston, 02215, Massachusetts, USA
Cheng-Zhong Zhang, Joshua Francis, Cecile Maire, Keith L. Ligon & Matthew Meyerson - Cancer Program, Broad Institute of Harvard and MIT, Cambridge, 02142, Massachusetts, USA
Cheng-Zhong Zhang, Viktor A. Adalsteinsson, Joshua Francis, Joonil Jung, Matthew Meyerson & J. Christopher Love - Department of Chemical Engineering Cambridge, Massachusetts Institute of Technology, Cambridge, 02139, Massachusetts, USA
Viktor A. Adalsteinsson & J. Christopher Love - Koch Institute for Integrative Cancer Research, Massachusetts Institute of Technology, Cambridge, 02139, Massachusetts, USA
Viktor A. Adalsteinsson & J. Christopher Love - Department of Pediatric Oncology, Dana-Farber Cancer Institute, Boston, 02215, Massachusetts, USA
Hauke Cornils - Department of Cell Biology, Harvard Medical School, Boston, 02115, Massachusetts, USA
Hauke Cornils - Department of Pathology, Harvard Medical School, Boston, 02115, Massachusetts, USA
Keith L. Ligon & Matthew Meyerson - Department of Pathology, Brigham and Women’s Hospital, Boston, 02115, Massachusetts, USA
Keith L. Ligon - Department of Pathology, Boston Children’s Hospital, Boston, 02115, Massachusetts, USA
Keith L. Ligon - Center for Molecular Oncologic Pathology, Dana Farber Cancer Institute, Boston, 02115, Massachusetts, USA
Keith L. Ligon - Center for Cancer Genome Discovery, Dana Farber Cancer Institute, Boston, 02215, Massachusetts, USA
Matthew Meyerson
Authors
- Cheng-Zhong Zhang
- Viktor A. Adalsteinsson
- Joshua Francis
- Hauke Cornils
- Joonil Jung
- Cecile Maire
- Keith L. Ligon
- Matthew Meyerson
- J. Christopher Love
Contributions
C.-Z.Z. and V.A.A. initiated the project and carried out the analysis. C.-Z.Z. performed analysis of amplification bias; V.A.A. performed analysis of census-based detection sensitivity with help from C.-Z.Z. J.F., H.C., C.M. and K.L.L. prepared sequencing libraries for the RPE cell line and glioblastoma samples. C.-Z.Z., V.A.A., J.C.L. and M.M. wrote the manuscript with help from all the authors. M.M. and J.C.L. supervised the study.
Corresponding authors
Correspondence toMatthew Meyerson or J. Christopher Love.
Ethics declarations
Competing interests
M.M. is a founder and equity holder of Foundation Medicine, a for-profit company that provides next-generation sequencing diagnostic services.
Supplementary information
Supplementary Information
Supplementary Figures 1-12 (PDF 5646 kb)
Supplementary Data 1
Mutations detected in 120x bulk whole-exome sequencing of the BT325 tumor. (XLSX 78 kb)
Supplementary Data 2
Mutations detected in 30x bulk whole-genome sequencing of the BT325 tumor. (XLSX 51 kb)
Supplementary Data 3
Mutations detected among 59 single cells of the BT325 tumor sequenced to 20x total depth. (XLSX 51 kb)
Supplementary Data 4
Mutations detected among 22 single cells of the BT325 tumor sequenced to 20x total depth. (XLSX 57 kb)
Supplementary Data 5
Mutations detected among two sets of two single cells of the BT325 tumor sequenced to 20x total depth per set. (XLSX 56 kb)
Rights and permissions
About this article
Cite this article
Zhang, CZ., Adalsteinsson, V., Francis, J. et al. Calibrating genomic and allelic coverage bias in single-cell sequencing.Nat Commun 6, 6822 (2015). https://doi.org/10.1038/ncomms7822
- Received: 05 August 2014
- Accepted: 03 March 2015
- Published: 16 April 2015
- DOI: https://doi.org/10.1038/ncomms7822