SARS-CoV-2-reactive T cells in healthy donors and patients with COVID-19 (original) (raw)
Main
The COVID-19 pandemic poses a threat to public health and the global economy as the number of cases and COVID-19-related deaths increases worldwide1,2. COVID-19 is routinely diagnosed by the detection of SARS-CoV-2 RNA in nasopharyngeal swabs using PCR3, the detection of which is reliable during the acute phase of COVID-194,5. However, the limited availability of tests and the preferential testing of patients with symptoms has probably led to a marked underestimation of the infection burden and overestimation of fatality rates6. Serological analysis of SARS-CoV-2-induced humoral immunity could reveal asymptomatic infections, but it is not yet widely applied7,8 and is complicated by the fact that coronavirus-induced antibody responses are variable and short-lived9,10. Coronavirus-induced cellular immunity is predicted to be more sustained, but remains poorly characterized. However, several T cell epitopes in the structural proteins of coronaviruses have been predicted or identified9,11,12,13. Notably, T helper (TH) cell responses and the generation of neutralizing antibodies may be interdependent9,14. Studies of the SARS-CoV epidemic in 2002–2003 have shown that adaptive immune responses directed against the spike glycoprotein (S) were protective9,15,16. Therefore, the induction of SARS-CoV-2-specific CD4+ T cells is likely to be critical in the instruction of affinity-maturated and potentially protective antibody responses17. We therefore examined the presence, frequencies and phenotypic characteristics of SARS-CoV-2 S-reactive T cells in patients with COVID-19 compared with SARS-CoV-2-unexposed healthy donors (HDs).
Identification of S-reactive CD4+ T cells
We identified S-reactive CD4+ T cells by flow cytometry according to their expression of CD40L and 4-1BB after in vitro stimulation with S peptides. To this end, we designed two peptide pools (15 amino acids with 11 amino acid overlaps) that spanned the entire S protein and that contained different amounts of putative MHC-II epitopes based on epitopes identified in SARS-CoV11,12,13 (Fig. 1a). SARS-CoV-2 S-peptide pool PepMix 1 (hereafter, S-I) spans the N-terminal part (amino acid residues 1–643) and includes 21 predicted SARS-CoV MHC-II epitopes (Fig. 1a, Extended Data Fig. 1 and Extended Data Table 1). The second peptide pool PepMix 2 (S-II) covered the C-terminal portion (amino acid residues 633–1273) and includes 13 predicted SARS-CoV MHC-II epitopes (Fig. 1a, Extended Data Fig. 1 and Extended Data Table 1). The peptides of the receptor-binding domain in subunit S1, which represents a major target of neutralizing antibodies, are included in S-I[18](/articles/s41586-020-2598-9#ref-CR18 "Meng, T. et al. The insert sequence in SARS-CoV-2 enhances spike protein cleavage by TMPRSS. Preprint at https://www.biorxiv.org/content/10.1101/2020.02.08.926006v3
(2020)."),[19](/articles/s41586-020-2598-9#ref-CR19 "Walls, A. C. et al. Structure, function, and antigenicity of the SARS-CoV-2 spike glycoprotein. Cell 181, 281–292 (2020).").Fig. 1: Structural domains, homology and MHC-II epitopes of the SARS-CoV-2 S protein.
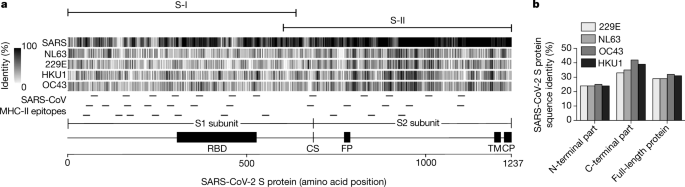
a, The S protein of SARS-CoV-2 (1,237 amino acids) is separated at the cleavage site (CS) into subunit S1, which comprises the receptor-binding domain (RBD), and subunit S2 which contains the fusion peptide (FP), the transmembrane domain (TM) and the cytoplasmic peptide (CP). Sequence homology of S proteins of SARS-CoV-2, SARS-CoV and hCoV strains NL63, 229E, HKU1 and OC43 was calculated as the percentage of amino acid identity in sliding windows of 10 amino acids and is depicted as grey vertical lines. Predicted SARS-CoV MHC-II epitopes are indicated as small horizontal lines. Sequences and references are listed in Extended Data Table 1. Homology is depicted for each reported MHC-II epitope in Extended Data Fig. 1. S-I spans the N-terminal region of S and S-II spans the C-terminal part of S, as indicated above the alignment. b, Proportion of sequence identity of the N-terminal and C-terminal parts of the S protein of SARS-CoV-2 and the S proteins of hCoV strains NL63, 229E, HKU1 and OC43.
For antigen-specific stimulation, peripheral blood mononuclear cells from patients and HDs were stimulated for 16 h with S-I and S-II peptide pools (for characteristics of patients and HDs, see Table 1 and Extended Data Tables 2, 3). Antigen-reactive CD4+ T cells were identified by co-expression of 4-1BB and CD40L, which enables the sensitive detection of S-reactive CD4+ T cells re-activated by T cell receptor engagement ex vivo20,21,22 (Fig. 2a, Extended Data Fig. 2 and Supplementary Information). In 12 (67%) and 15 (83%) out of 18 patients, we detected CD4+ T cells that reacted against the S-I and S-II peptide pools, respectively (Fig. 2b, d, e). Most patients with COVID-19 with critical disease showed no reactivity to the S-I peptide pool (Extended Data Fig. 3).
Table 1 Baseline characteristics of all donors
Fig. 2: SARS-CoV-2 S-reactive CD4+ T cells in patients with COVID-19 and HDs.
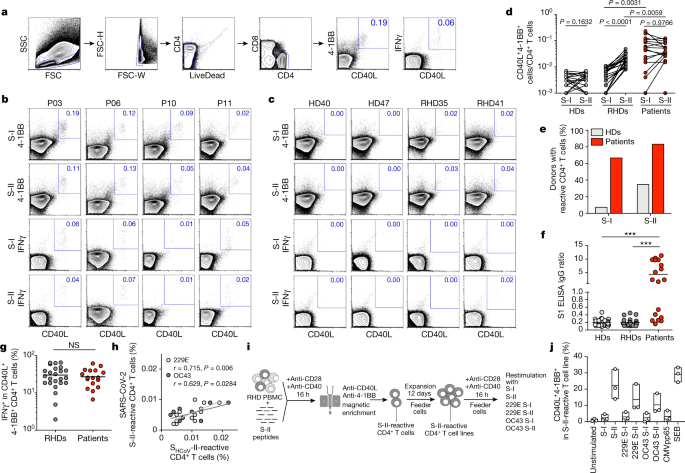
a, Gating strategy to detect SARS-CoV-2 S-reactive CD4+ T cells after in vitro stimulation for 16 h with SARS-CoV-2 S-I and S-II peptide pools. Representative data of one patient with COVID-19 are shown. FSC, forward scatter; FSC-H, forward scatter height; FSC-W, forward scatter width; SSC, side scatter. b, c, Representative plots of CD40L and 4-1BB as well as CD40L and IFNγ expression on CD4+ T cells of patients with COVID-19 (P), HDs and RHDs after 16 h of in vitro stimulation with S-I or S-II peptide pools. Numbers show the percentage of double-positive cells out of the total number of CD4+ T cells. d, Comparison of S-I- or S-II-reactive CD40L+4-1BB+CD4+ T cell frequencies in HDs (n = 44), RHDs (n = 24) and patients (n = 18). e, Percentage of patients and HDs with S-I-reactive and S-II-reactive CD4+ T cells. f, SARS-CoV-2 S1 serology of HDs (n = 44), RHDs (n = 24) and patients (n = 18). ***P < 0.0001. g, Comparison of the frequencies of IFNγ+ cells among CD40L+4-1BB+CD4+ T cells in RHDs (n = 24) and patients (n = 18). NS, not significant. h, Correlation between SARS-CoV-2 S-II and ShCoV-II CD4+ T cell responses. Frequencies of CD40L+4-1BB+CD4+ T cells after stimulation with S-II peptide pools of SARS-CoV-2 (y axis) and S-II peptide pools of hCoVs (x axis) 229E (light grey, n = 12) and OC43 (dark grey, n = 9) from RHDs are shown. i, Schematic summary of the generation of SARS-CoV-2 S-II-reactive CD4+ T cell lines. PBMC, peripheral blood mononuclear cells. j, Enriched and expanded SARS-CoV-2 S-II-reactive CD4+ T cells were restimulated with the indicated S-I and S-II peptide pools of SARS-CoV-2 and the two hCoV strains. SEB, staphylococcal enterotoxin B.d, f, g, Significance was calculated using two-tailed Mann–Whitney _U_-tests. h, The correlation coefficient r was calculated using a bivariate Pearson correlation and the related P value was based on a _t_-distribution.
Notably, S-II-reactive CD4+ T cells—although at slightly lower frequencies compared with patients with COVID-19—could also be detected in 24 out of 68 HDs (35%), who are hereafter referred to as reactive healthy donors (RHDs) (Fig. 2c–e). S-I-reactive CD4+ T cells could be detected in only 6 out of the 24 RHDs, that is, in 5.8% of all HDs (Fig. 2d, e). All HDs were negative for IgG antibodies that were specific to the S1 subunit, in contrast to patients with COVID-19 (Fig. 2f). We further ruled out early SARS-CoV-2 infection at initial sampling by (1) direct standard diagnosis using PCR in 10 RHDs (data not shown); (2) serological testing (Fig. 2f); and (3) by repeated serological testing at least 28 days later for 65 out of 68 HDs (Extended Data Fig. 4).
We further phenotypically and functionally characterized S-reactive CD4+ T cells in additional patients with COVID-19 (Extended Data Table 4) and RHDs. Notably, in both groups, SARS-CoV-2 S-II-reactive CD4+ T cells exhibited a memory phenotype and a significant proportion of the cells expressed IFNγ, indicative of TH1 polarization (Fig. 2g and Extended Data Fig. 5a–d). Most S-reactive CD4+ T cells expressed IL-2 but only few cells expressed IL-17A (Extended Data Fig. 5a–d). Frequencies of S-II-reactive CD4+ T cells that expressed IFNγ were similar in patients and RHDs (Fig. 2g). Testing for TNF expression revealed that S-II-reactive IFNγ+CD4+ T cells from RHDs mostly co-expressed TNF, whereas S-II-reactive IFNγ+CD4+ T cells from patients with COVID-19 showed heterogenous TNF expression patterns (Extended Data Fig. 5e). This probably reflects the different disease stages of the acute SARS-CoV-2 infection of the individual patients included in our study. These results show that S-reactive CD4+ T cells with a predominantly TH1 memory phenotype are present not only in patients with COVID-19 but also in seronegative SARS-CoV-2-unexposed HDs.
S-reactive T cells in RHDs are cross-reactive to hCoVs
S-reactive CD4+ T cells from patients with COVID-19 equally targeted both the N-terminal (S-I) and C-terminal peptide pools (S-II) of S, whereas S-reactive CD4+ T cells from RHDs reacted significantly more strongly to the S-II peptide pool (Fig. 2d). S-II exhibits a higher homology to the human endemic coronaviruses (hCoVs; known as ‘common cold’ viruses) 229E, NL63, OC43 and HKU1 with regard to the SARS-CoV MHC-II epitopes, compared to the S-I peptide pool (Extended Data Table 1 and Extended Data Fig. 1). This suggests that S-reactivity in SARS-CoV-2-naive HDs originated from previous immune responses to hCoVs. We therefore tested 18 out of the 68 HDs for the presence of antibodies that are specific for the four endemic hCoVs. We detected IgG antibodies against all four hCoVs in all tested HDs, regardless of the presence of measurable S-reactive CD4+ T cells (Extended Data Fig. 6a). Frequencies of S-reactive or -cross-reactive CD4+ T cells in RHDs did not correlate with antibody levels against hCoVs, which potentially indicates that these antibodies have not been generated very recently. Similar findings have been obtained for other anti-viral CD4+ T cell responses, for example, after yellow fever vaccination (YFV-17D). CD4+ T cell responses showed a significant correlation with the later generation of high titres of neutralizing antibodies only at very early time points after YFV-17D vaccination23.
We next determined whether SARS-CoV-2 S-reactive CD4+ T cells in RHDs correlated with a CD4+ T cell response to the S protein of endemic hCoVs (ShCoV). To this end, peripheral blood mononuclear cells from HDs and RHDs were stimulated with S-I and S-II pools from SARS-CoV-2 and ShCoV-I and ShCoV-II pools of OC43 and 229E (Fig. 2h and Extended Data Fig. 6b–d). There was a strong positive correlation of CD4+ T cell reactivity against S-II and ShCoV-II of OC43 and 229E (r = 0.629 and r = 0.715, respectively) (Fig. 2h), whereas no or only a weak negative correlation was detected between S-I reactivity and reactivity towards ShCoV-I of OC43 and 229E (r = 0.037 and r = −0.259, respectively) (Extended Data Fig. 6b). No correlation was observed between reactivity to S-I or S-II and CMVpp65 (Extended Data Fig. 6c, d).
We next tested whether the S-reactive CD4+ T cells of RHDs responded to stimulation with ShCoV. To this end, S-II-reactive CD4+ T cells were isolated from three RHDs (RHD01, RHD07 and RHD15), expanded ex vivo for 12 days and subsequently restimulated with ShCoV-I and ShCoV-II of OC43 and 229E, with the S-II pool as positive control, or with S-I and a peptide pool from CMVpp65 as negative controls (Fig. 2i, j). Restimulation with the SARS-CoV-2 S-II peptide pool induced the highest frequencies of 4-1BB+CD40L+CD4+ T cells, whereas negligible responses were measured in the negative controls (S-I, CMVpp65 and unstimulated groups), demonstrating the high specificity of the established S-II-reactive CD4+ T cell lines (Fig. 2j). By contrast, strong responses were observed against the ShCoV-II peptide pools of the two hCoVs (Fig. 2j). These findings provide evidence of the cross-reactivity of SARS-CoV-2 S-II-reactive cells to ShCoV in the tested RHDs, suggesting that pre-existence of SARS-CoV-2-reactive T cells in seronegative SARS-CoV-2-naive individuals originates from previous immune responses to endemic hCoVs.
Activation signatures in patients with COVID-19
Finally, we assessed additional activation marker profiles on S-reactive T cells from patients with COVID-19 and RHDs. Expression of CD38, HLA-DR and Ki-67 has previously been shown to reliably characterize recently in vivo activated human T cells during acute and chronic infections24,25,26,27,28. Notably, S-reactive CD4+ T cells from patients largely expressed CD38, HLA-DR and Ki-67 (Fig. 3a–d). Most S-reactive T cells in patients co-expressed CD38 and HLA-DR (Fig. 3e), which is characteristic of effector T cell responses during acute viral infections24,26, whereas CD38 and Ki-67 co-expression was more variable (Fig. 3f). By contrast, S-reactive CD4+ T cells from RHDs did not express CD38, HLA-DR and Ki-67, or only at low frequencies (Fig. 3b–f), and co-expression was not observed (Fig. 3e, f). In patients, considerable proportions of the entire peripheral CD4+ and CD8+ T cell populations co-expressed CD38 and HLA-DR (data not shown); however, these cells could not be re-activated with our S peptide pools in vitro. These findings are consistent with results of a recent study that showed refractory T cell signatures in patients with COVID-1929. Additionally, a proportion of these CD38+HLA-DR+CD4+ T cells probably targets other structural proteins of SARS-CoV-2. We furthermore show that the presence of S-reactive CD4+ T cells and, in particular, of CD38-expressing cells among S-reactive CD4+ T cells was highly variable among patients during the course of COVID-19 disease (Fig. 3g, h).
Fig. 3: CD38, HLA-DR and Ki-67 expression in SARS-CoV-2 S-I-reactive and S-II-reactive CD4+ T cells discriminates patients with COVID-19 from RHDs.
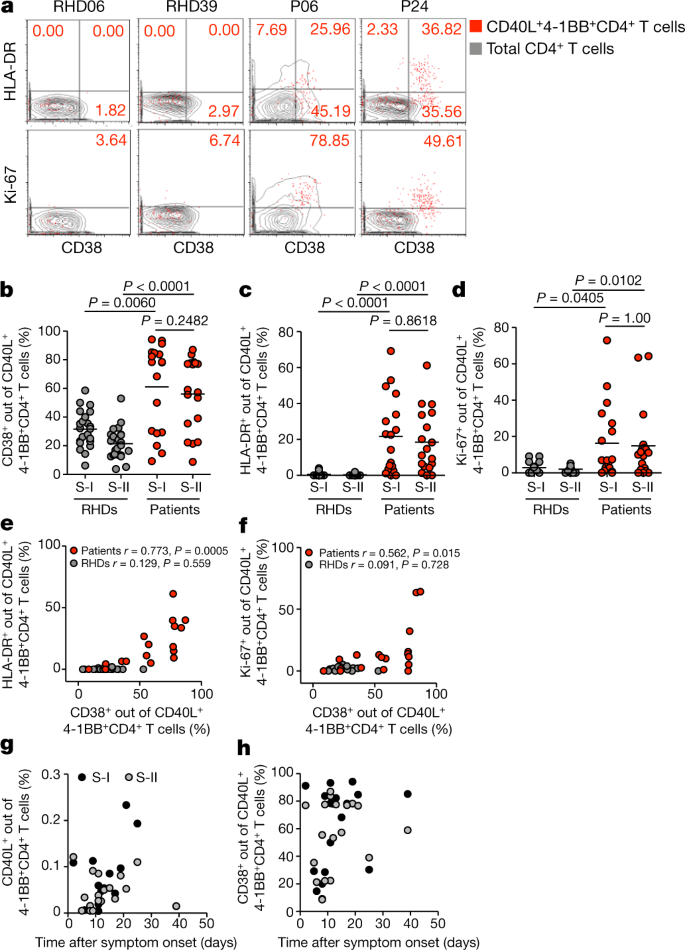
a, Representative examples of HLA-DR and Ki-67 expression plotted against CD38 expression for S-II-reactive CD4+ T cells (red dots) compared with total CD4+ T cells (grey contours) in RHDs and patients with COVID-19. b–d, Comparison of frequencies of CD38+, HLA-DR+ and Ki-67+ cells among S-I-reactive and S-II-reactive CD4+ T cells in RHDs (b, c, n = 23; d, n = 17) and patients (n = 18). Significance was calculated using two-tailed Mann–Whitney _U_-tests. e, f, Co-expression of HLA-DR or Ki-67 and CD38 among S-II-reactive CD4+ T cells from RHDs (e, n = 23; f, n = 17) and patients (n = 18). The correlation coefficient r was calculated using a bivariate Pearson correlation and the related P value was based on a _t_-distribution. g, h, Frequencies of S-I-reactive and S-II-reactive CD40L+4-1BB+CD4+ T cells (g) or CD38+ among S-II-reactive CD4+ T cells (h) of patients (n = 18) plotted against time after symptom onset (days).
Discussion
Our study shows that S-reactive CD4+ T cells are present in patients with COVID-19 and in a considerable proportion of SARS-CoV-2-unexposed HDs. In light of the recent emergence of SARS-CoV-2, our data raise the possibility that such pre-existing S-reactive T cells represent cross-reactive clones that were probably acquired during previous infections with endemic hCoVs. hCoVs account for approximately 20% of ‘common cold’ upper respiratory tract infections and are ubiquitous, although they display winter seasonality30,31,32. On the basis of epidemiological data, it may be extrapolated that adults contract an hCoV infection, on average, every two to three years. Protective antibodies may wane mid-term but cellular immunity could remain10,13. Although the overall homology of the amino acid sequences of the S protein is relatively low compared with spike glycoproteins from hCoVs, there is an overlap in MHC-II epitopes especially in the C-terminal domain of the peptide pools used here (Fig. 1a and Extended Data Fig. 1). This may explain the preferential reactivity of CD4+ T cells to the C-terminal domain in one third of HDs.
The biological role of pre-existing S-cross-reactive CD4+ T cells in 35% of HDs remains unclear. However, assuming that these cells have a protective role in SARS-CoV-2 infection, they may contribute to our understanding of the divergent manifestations of COVID-19, and the notable resilience of children and young adults to symptomatic SARS-CoV-2 infection. Young adults and, especially, children in day-care centres have more frequent social contacts than elderly individuals, and this may therefore lead to a higher hCoV prevalence. This hypothesis requires further investigation in future longitudinal studies that assess the presence of pre-existing SARS-CoV-2-cross-reactive CD4+ T cells and their influence on the susceptibility to SARS-CoV-2 infection and age-related clinical outcomes of COVID-19.
SARS-CoV-neutralizing antibodies are associated with convalescence, and they have been detected 12 months after disease9. However, the durability of neutralizing antibody responses against SARS-CoV-2 remains unknown. Although antibodies against hCoV can wane within months after infection, hCoV reinfection is accompanied by low-level and short-lived virus shedding with only mild symptoms of short duration, which indicates humoral-independent residual immunity10. Cellular immunity has not yet been studied in this context. In mouse models, however, CD4+ as well as CD8+ T cell responses directed against structural proteins such as the spike or nucleocapsid proteins of SARS-CoV critically contributed to viral clearance15,33,34. Understanding the extent to which and how SARS-CoV-2-specific humoral or cellular immunity mediates durable protection against reinfection is of critical importance in the coming months.
Our study reveals pre-existing cellular SARS-CoV-2 cross-reactivity in a substantial proportion of SARS-CoV-2-seronegative HDs. This finding could have considerable epidemiological implications regarding herd immunity thresholds and projections for the COVID-19 pandemic. Our results provide a decisive rationale to initiate worldwide prospective studies to assess the contribution of pre-existing, potentially region-dependent, SARS-CoV-2-cross-reactive immunity to the diverse clinical outcomes of SARS-CoV-2 infection. Together with currently introduced serological tests, the data generated by such studies may critically inform evidence-based risk evaluation, patient monitoring, adaptation of containment methods and vaccine development.
Methods
Data reporting
No statistical methods were used to predetermine sample size. The experiments were not randomized and the investigators were not blinded to allocation during experiments and outcome assessment.
Study participants
The study was approved by the Institutional Review Board of the Charité (EA2/066/20). After providing written informed consent, 68 HDs (Table 1 and Extended Data Table 3) and 18 and 7 additional patients with COVID-19 (Table 1 and Extended Data Table 2, 4) were included in the study. Patients with COVID-19 who tested positive for SARS-CoV-2 RNA in nasopharyngeal swabs were recruited at Charité Campus Virchow-Klinikum, Berlin, between 1 March and 2 April 2020. All patients with COVID-19 were enrolled in the Berlin prospective observation COVID-19 study (PA-COVID-19)35. Disease severity was grouped on the basis of the requirement for supplementary oxygen or ventilation (mild, hospitalized, no supplementary oxygen; severe, hospitalized, supplementary oxygen (including high-flow oxygen); critical, hospitalized, invasive ventilation). For intracellular cytokine and memory T cell staining, seven additional patients with COVID-19 (Extended Data Table 4) were enrolled at later time points and five RHDs were re-recruited. To retrospectively validate SARS-CoV-2 seronegativity, all HDs were re-invited between 4 and 7 May 2020 for re-assessment of anti-S1 IgG titres. In total, 65 out of 68 HDs could be re-recruited and all HDs were seronegative for SARS-CoV-2 (Extended Data Fig. 4).
Serology
Anti-SARS-CoV-2 IgG ELISA was performed using a commercial kit (EUROIMMUN) as described and validated previously8. Recombinant immunofluorescence assays to determine IgG titres against hCoV were performed using VeroB4 cells that expressed cloned recombinant spike proteins from hCoV-229E, hCoV-NL63, hCoV-OC43 and hCoV-HKU1, as previously described36.
Cell isolation and stimulation
Peripheral blood mononuclear cells were isolated from heparinized whole blood by density gradient centrifugation according to manufacturer’s instructions (Leucosep tubes, Greiner; Biocoll, Bio&SELL). Stimulation was performed with 5 × 10⁶ peripheral blood mononuclear cells in RPMI 1640 medium (Gibco) supplemented with 10% heat-inactivated AB serum (Pan Biotech), 100 U/ml penicillin (Biochrom), 0.1 mg/ml streptomycin (Biochrom) and PepMix SARS-CoV-2 spike glycoprotein (JPT) peptide pool 1 or 2 in the presence of 1 μg/ml purified anti-CD28 antibody (clone CD28.2, BD Biosciences). The PepMix SARS-CoV-2 spike glycoprotein pool 1 covering the N-terminal amino acid residues 1–643 (abbreviated to ‘S-I’ (N-term)) contained 158 15-mers that overlapped by 11 amino acids. PepMix SARS-CoV-2 spike glycoprotein pool 2 covered the C-terminal amino acid residues 633–1273 (abbreviated to ‘S-II’ (C-term)) contained 156 15-mers that overlapped by 11 amino acids and one 17-mer at the C terminus, that is, 157 peptides in total. Both peptide pools were used at 1 μg/ml per peptide. Further details on the peptide pools and predicted MHC-II epitopes are provided in Fig. 1, Extended Data Fig. 1 and Extended Data Table 1. Stimulation controls were performed with equal concentrations of DMSO in PBS (unstimulated) or 1.5 mg SEB/1.0 mg TSST1 (Sigma-Aldrich) and PepMix HCMVA (pp65) (>90%; CMVpp65) (JPT) in the presence of 1 μg/ml purified anti-CD28 antibody (clone CD28.2, BD Biosciences) as positive controls. Incubation was performed at 37 °C, 5% CO2 for 16 h with 10 μg/ml brefeldin A (Sigma-Aldrich) added after 2 h. Stimulation was stopped by incubation in 2 mM EDTA for 5 min. Stimulation with hCoV spike glycoprotein (ShCoV) peptide pools was performed using the conditions described above but with 1 μg/ml per peptide of the following peptide pools: PepMix hCoV-229E spike glycoprotein pool 1 or 2 or PepMix hCoV-OC43 spike glycoprotein pool 1 or 2 (all JPT).
Flow cytometry
After stimulation, staining of surface antigens was carried out for 15 min with the following fluorochrome-conjugated antibodies titrated to their optimal concentrations: CD38-PE-Vio770 (clone REA671, Miltenyi, 1:400), CD69-APC-Cy7 (FN50, BioLegend, 1:100), HLAD-DR-VioGreen (REA805, Miltenyi, 1:50), CD4-BrilliantViolet605 (RPA-T4, BioLegend, 1:200), CD8-PerCP (SK1, BioLegend, 1:100) with 1 mg/ml beriglobin (CSL Behring) added before the staining. To exclude dead cells, Zombie Yellow fixable viability staining (BioLegend) was added for the last 10 min of incubation. Fixation and permeabilization were performed with eBioscience FoxP3 fixation and PermBuffer (Invitrogen) according to the manufacturer’s protocol and intracellular staining was carried out for 30 min in the dark at room temperature with beriglobin added before staining with 4-1BB-PE (4-1BB is also known as CD137; clone 4B4-1, BD, 1:10), CD40L-APC (CD40L is also known as CD154; 5C8, Miltenyi, 1:40), IFNγ-AlexaFluor700 (B27, BD, 1:50), TNF-PacificBlue (MAb11, BioLegend, 1:100) and Ki-67-AlexaFluor488 (B56, BD, 1:100). To assess naive/memory T cell phenotypes and cytokine expression, the following antibodies were used: surface staining was performed with CD3-V500 (SP34-2, BD, 1:50), CD8-PerCP (SK1, BioLegend, 1:100), CD4-BrilliantViolet605 (RPA-T4, BioLegend, 1:200), CCR7-AlexaFluor488 (G043H7, BioLegend, 1:150), CD45RA-PE-Cy7 (HI100, BioLegend, 1:200). IFNγ-AlexaFluor700 (B27, BD, 1:100), CD40L-BrilliantViolet421 (24-31, BioLegend, 1:200), IL-2-APC (5344.111, BD, 1:200), 4-1BB-PE (4B4-1, BD, 1:10) and IL-17A-APC-Cy7 (BL168, BioLegend, 1:20) were used for intracellular staining after fixation and permeabilization using BD FACSLysing Buffer and BD Perm2 Buffer, according to the manufacturer’s instructions. Samples were measured on a MACSQuant Analyzer 16 using MACSQuantify software (v.2.13). Instrument performance was monitored daily with Rainbow Calibration Particles (BD).
Cell enrichment, expansion and restimulation
S-II-reactive T cells were enriched by magnetic cell sorting (MACS) from peripheral blood mononuclear cells stimulated with PepMix SARS-CoV-2 spike glycoprotein peptide pool 2 (JPT) in the presence of 1 μg/ml purified anti-CD28 (clone CD28.2, BD Biosciences) and 1 μg/ml anti-CD40 (clone 5C3, BioLegend) antibodies. After stimulation for 16 h, cells were stained with CD40L-APC and 4-1BB-PE and first enriched with anti-APC MultiSort MicroBeads (Miltenyi) according to the manufacturer’s instructions. After the release of anti-APC-MicroBeads, a second enrichment was performed with anti-PE MicroBeads (Miltenyi). Purity was checked each time to >80% of alive cells. Antigen presenting feeder cells were generated by CD3 MicroBead (Miltenyi) depletion of the CD40L-APC-negative fraction and subsequent inactivation by irradiation at 50 Gy. The irradiated feeder cells were co-cultured with the enriched 4-1BB+CD40L+ T cells at a ratio of 1:1 in RPMI 1640 medium (Gibco) supplemented with 10% heat-inactivated AB serum (Pan Biotech), 100 U/ml penicillin (Biochrom), 0.1 mg/ml streptomycin (Biochrom) in the presence of 10 ng/ml IL-7 and IL-15 (both Miltenyi) for 12 days followed by 2-day cytokine starvation before restimulation. Restimulation was carried with the conditions described above and additionally with 1 μg/ml per peptide of the following peptide pools: PepMix hCoV-229E spike glycoprotein pool 1 or 2 or PepMix hCoV-OC43 spike glycoprotein pool 1 or 2 (all JPT).
Data analysis and statistics
Sequence alignments were performed using R (v.3.6.1) including package ClustalX37 and using the Needlemann–Wunsch algorithm38. Flow cytometry data were analysed with FlowJo v.9.9.6 (FlowJo). Microsoft Excel (v.14.1.0) and Prism 5 and 8 (GraphPad) were used for plotting and statistical analysis. In stimulation experiments, frequencies of activated CD4+ T cells were background-subtracted, with the frequency in the unstimulated control sample representing the background. Non-parametric testing was used to compare cell frequencies and antibody titres between groups (two-tailed Mann–Whitney _U_-test). n indicates the number of donors.
Reporting summary
Further information on research design is available in the Nature Research Reporting Summary linked to this paper.
Data availability
All flow cytometry data are made available at www.FlowRepository.org (experiment ID: FR-FCM-Z2K3). The individual gating strategies for all donors are shown in Supplementary Information.
References
- Dong, E., Du, H. & Gardner, L. An interactive web-based dashboard to track COVID-19 in real time. Lancet Infect. Dis. 20, 533–534 (2020).
Article CAS Google Scholar - Wang, D. et al. Clinical characteristics of 138 hospitalized patients with 2019 novel coronavirus-infected pneumonia in Wuhan, China. J. Am. Med. Assoc. 323, 1061–1069 (2020).
Article CAS Google Scholar - Corman, V. M. et al. Detection of 2019 novel coronavirus (2019-nCoV) by real-time RT-PCR. Euro Surveill. 25, 2000045 (2020).
PubMed Central Google Scholar - Loeffelholz, M. J. & Tang, Y.-W. Laboratory diagnosis of emerging human coronavirus infections — the state of the art. Emerg. Microbes Infect. 9, 747–756 (2020).
Article CAS Google Scholar - Wölfel, R. et al. Virological assessment of hospitalized patients with COVID-2019. Nature 581, 465–469 (2020).
Article ADS Google Scholar - Wu, J. T., Leung, K. & Leung, G. M. Nowcasting and forecasting the potential domestic and international spread of the 2019-nCoV outbreak originating in Wuhan, China: a modelling study. Lancet 395, 689–697 (2020).
Article CAS Google Scholar - Amanat, F. et al. A serological assay to detect SARS-CoV-2 seroconversion in humans. Nat. Med. 26, 1033–1036 (2020).
Article CAS Google Scholar - Okba, N. M. A. et al. Severe acute respiratory syndrome coronavirus 2-specific antibody responses in coronavirus disease patients. Emerg. Infect. Dis. 26, 1478–1488 (2020).
Article CAS Google Scholar - Li, C. K. et al. T cell responses to whole SARS coronavirus in humans. J. Immunol. 181, 5490–5500 (2008).
Article CAS Google Scholar - Callow, K. A., Parry, H. F., Sergeant, M. & Tyrrell, D. A. J. The time course of the immune response to experimental coronavirus infection of man. Epidemiol. Infect. 105, 435–446 (1990).
Article CAS Google Scholar - Libraty, D. H., O’Neil, K. M., Baker, L. M., Acosta, L. P. & Olveda, R. M. Human CD4+ memory T-lymphocyte responses to SARS coronavirus infection. Virology 368, 317–321 (2007).
Article CAS Google Scholar - Yang, J. et al. Searching immunodominant epitopes prior to epidemic: HLA class II-restricted SARS-CoV spike protein epitopes in unexposed individuals. Int. Immunol. 21, 63–71 (2009).
Article CAS Google Scholar - Ng, O. W. et al. Memory T cell responses targeting the SARS coronavirus persist up to 11 years post-infection. Vaccine 34, 2008–2014 (2016).
Article CAS Google Scholar - Mitchison, N. A. T-cell–B-cell cooperation. Nat. Rev. Immunol. 4, 308–312 (2004).
Article CAS Google Scholar - Yang, Z. Y. et al. A DNA vaccine induces SARS coronavirus neutralization and protective immunity in mice. Nature 428, 561–564 (2004).
Article ADS CAS Google Scholar - Zhu, Z. et al. Potent cross-reactive neutralization of SARS coronavirus isolates by human monoclonal antibodies. Proc. Natl Acad. Sci. USA 104, 12123–12128 (2007).
Article ADS CAS Google Scholar - Ju, B. et al. Human neutralizing antibodies elicited by SARS-CoV-2 infection. Nature 584, 115–119 (2020).
Article ADS CAS Google Scholar - Meng, T. et al. The insert sequence in SARS-CoV-2 enhances spike protein cleavage by TMPRSS. Preprint at https://www.biorxiv.org/content/10.1101/2020.02.08.926006v3 (2020).
- Walls, A. C. et al. Structure, function, and antigenicity of the SARS-CoV-2 spike glycoprotein. Cell 181, 281–292 (2020).
Article CAS Google Scholar - Frentsch, M. et al. Direct access to CD4+ T cells specific for defined antigens according to CD154 expression. Nat. Med. 11, 1118–1124 (2005).
Article CAS Google Scholar - Sattler, A. et al. Cytokine-induced human IFN-γ-secreting effector-memory Th cells in chronic autoimmune inflammation. Blood 113, 1948–1956 (2009).
Article CAS Google Scholar - Schoenbrunn, A. et al. A converse 4-1BB and CD40 ligand expression pattern delineates activated regulatory T cells (Treg) and conventional T cells enabling direct isolation of alloantigen-reactive natural Foxp3+ Treg. J. Immunol. 189, 5985–5994 (2012).
Article CAS Google Scholar - Kohler, S. et al. The early cellular signatures of protective immunity induced by live viral vaccination. Eur. J. Immunol. 42, 2363–2373 (2012).
Article CAS Google Scholar - Appay, V. et al. Memory CD8+ T cells vary in differentiation phenotype in different persistent virus infections. Nat. Med. 8, 379–385 (2002).
Article CAS Google Scholar - Blom, K. et al. Temporal dynamics of the primary human T cell response to yellow fever virus 17D as it matures from an effector- to a memory-type response. J. Immunol. 190, 2150–2158 (2013).
Article CAS Google Scholar - Callan, M. F. C. et al. Direct visualization of antigen-specific CD8+ T cells during the primary immune response to Epstein–Barr virus in vivo. J. Exp. Med. 187, 1395–1402 (1998).
Article CAS Google Scholar - Miller, J. D. et al. Human effector and memory CD8+ T cell responses to smallpox and yellow fever vaccines. Immunity 28, 710–722 (2008).
Article CAS Google Scholar - Schulz, A. R. et al. Low thymic activity and dendritic cell numbers are associated with the immune response to primary viral infection in elderly humans. J. Immunol. 195, 4699–4711 (2015).
Article CAS Google Scholar - Diao, B. et al. Reduction and functional exhaustion of T cells in patients with coronavirus disease 2019 (COVID-19). Front. Immunol. 11, 827 (2020).
Article CAS Google Scholar - Tyrrell, D. A. J. Common Colds and Related Diseases (E. Arnold, 1965).
- Lidwell, O. M. & Williams, R. E. The epidemiology of the common cold. I. J. Hyg. 59, 309–319 (1961).
Article CAS Google Scholar - Gaunt, E. R., Hardie, A., Claas, E. C. J., Simmonds, P. & Templeton, K. E. Epidemiology and clinical presentations of the four human coronaviruses 229E, HKU1, NL63, and OC43 detected over 3 years using a novel multiplex real-time PCR method. J. Clin. Microbiol. 48, 2940–2947 (2010).
Article CAS Google Scholar - Channappanavar, R., Fett, C., Zhao, J., Meyerholz, D. K. & Perlman, S. Virus-specific memory CD8 T cells provide substantial protection from lethal severe acute respiratory syndrome coronavirus infection. J. Virol. 88, 11034–11044 (2014).
Article Google Scholar - Wang, B. et al. Identification of an HLA-A*0201-restricted CD8+ T-cell epitope SSp-1 of SARS-CoV spike protein. Blood 104, 200–206 (2004).
Article CAS Google Scholar - Kurth, F. et al. Studying the pathophysiology of coronavirus disease 2019: a protocol for the Berlin prospective COVID-19 patient cohort (Pa-COVID-19). Infection 48, 619–626 (2020).
Article CAS Google Scholar - Corman, V. M. et al. Assays for laboratory confirmation of novel human coronavirus (hCoV-EMC) infections. Euro Surveill. 17, 20334 (2012).
PubMed Google Scholar - Larkin, M. A. et al. Clustal W and Clustal X version 2.0. Bioinformatics 23, 2947–2948 (2007).
Article CAS Google Scholar - Needleman, S. B. & Wunsch, C. D. A general method applicable to the search for similarities in the amino acid sequence of two proteins. J. Mol. Biol. 48, 443–453 (1970).
Article CAS Google Scholar
Acknowledgements
We thank U. Klein and H.-P. Herzel for discussion; T. Kaiser and J. Kirsch from the Flow Cytometry Core Facility (FCCF) of the DRFZ for technical help; and B. Timmerman from the Sequencing Core Facility of the Max Planck Institute for Molecular Genetics for discussion. This work was supported by the German Research Foundation (KFO339 to J.B. and F.F., SFB-TR84 projects A4 and B6 to S.H., B8 to M.M., C6 to M.W., C8 and C10 to L.E.S., and C9 to M.W. and N.S.) and by the German Federal Ministry of Education and Research (BMBF-RAPID to S.H. and C.D., and CAPSyS to M.W. and N.S.). This work was additionally funded by the Federal Ministery of Health through a resolution of the German Bundestag to A.T., J.B., L.H. and M.D.
Author information
Author notes
- These authors contributed equally: Julian Braun, Lucie Loyal, Marco Frentsch
- These authors jointly supervised this work: Claudia Giesecke-Thiel, Leif Erik Sander, Andreas Thiel
Authors and Affiliations
- Si-M/‘Der Simulierte Mensch’, Technische Universität Berlin and Charité–Universitätsmedizin Berlin, Berlin, Germany
Julian Braun, Lucie Loyal, Manuela Dingeldey, Beate Kruse, Florent Fauchere, Emre Baysal, Maike Mangold, Larissa Henze, Roland Lauster & Andreas Thiel - Regenerative Immunology and Aging, BIH Center for Regenerative Therapies, Charité–Universitätsmedizin Berlin, Berlin, Germany
Julian Braun, Lucie Loyal, Manuela Dingeldey, Beate Kruse, Florent Fauchere, Emre Baysal, Maike Mangold, Larissa Henze & Andreas Thiel - Department of Hematology, Oncology and Tumor Immunology, Charité–Universitätsmedizin Berlin, Berlin, Germany
Marco Frentsch - Berlin Institute of Health (BIH), Berlin, Germany
Daniel Wendisch, Florian Kurth, Stefan Hippenstiel, Andreas Hocke, Martin Witzenrath, Norbert Suttorp & Leif Erik Sander - Department of Infectious Diseases and Respiratory Medicine, Charité-Universitätsmedizin Berlin, Berlin, Germany
Philipp Georg & Florian Kurth - Department of Tropical Medicine, Bernhard Nocht Institute for Tropical Medicine, University Medical Center Hamburg–Eppendorf, Hamburg, Germany
Florian Kurth - I. Department of Medicine, University Medical Center Hamburg-Eppendorf, Hamburg, Germany
Roland Lauster - Medical Biotechnology, Institute for Biotechnology, Technische Universität Berlin, Berlin, Germany
Marcus A. Mall, Kirsten Beyer & Jobst Röhmel - Department of Pediatric Pulmonology, Immunology and Critical Care Medicine, Charité-Universitätsmedizin Berlin, Berlin, Germany
Marcus A. Mall & Christian Drosten - Department of Infectious Diseases, Robert Koch Institut, Berlin, Germany
Sebastian Voigt - Miltenyi Biotec, Bergisch Gladbach, Germany
Jürgen Schmitz & Stefan Miltenyi - Interdisciplinary Metabolism Center, Biology of Aging (BoA) group, Charité–Universitätsmedizin Berlin, Berlin, Germany
Ilja Demuth - Institute of Virology, Charité–Universitätsmedizin Berlin, Berlin, Germany
Marcel A. Müller, Christian Drosten & Victor M. Corman - Department of Clinical and Experimental Medicine, Brighton and Sussex Medical School, Brighton, UK
Florian Kern - JPT Peptide Technologies, Berlin, Germany
Florian Kern, Ulf Reimer & Holger Wenschuh - Max Planck Institute for Molecular Genetics, Berlin, Germany
Claudia Giesecke-Thiel
Authors
- Julian Braun
- Lucie Loyal
- Marco Frentsch
- Daniel Wendisch
- Philipp Georg
- Florian Kurth
- Stefan Hippenstiel
- Manuela Dingeldey
- Beate Kruse
- Florent Fauchere
- Emre Baysal
- Maike Mangold
- Larissa Henze
- Roland Lauster
- Marcus A. Mall
- Kirsten Beyer
- Jobst Röhmel
- Sebastian Voigt
- Jürgen Schmitz
- Stefan Miltenyi
- Ilja Demuth
- Marcel A. Müller
- Andreas Hocke
- Martin Witzenrath
- Norbert Suttorp
- Florian Kern
- Ulf Reimer
- Holger Wenschuh
- Christian Drosten
- Victor M. Corman
- Claudia Giesecke-Thiel
- Leif Erik Sander
- Andreas Thiel
Contributions
J.B., L.L. and M.F. planned and performed experiments and analysed the data. D.W., P.G., J.R., M.D., B.K., F.F., E.B., M.M. and L.H. performed experiments. F. Kurth, A.H., S.H., K.B., I.D., M. A. Mall, S.V., M.W., N.S., C.D. and L.E.S. managed initial patient contacts, and designed and supervised clinical management and clinical data. M. A. Müller and V.M.C. planned and performed experiments and analysed the data. J.S. and S.M. established high-throughput analysis. R.L. designed experiments. F. Kern, U.R. and H.W. established new reagents. G.C.-T. and A.T. designed and supervised the study. C.G.-T., L.E.S. and A.T. wrote the manuscript.
Corresponding authors
Correspondence toClaudia Giesecke-Thiel, Leif Erik Sander or Andreas Thiel.
Ethics declarations
Competing interests
F. Kern, U.R. and H.W. are employed at JPT Peptide Technologies, who have provided peptide pools for this work. F. Kern also part-owns and is inventor on a patent describing the use of overlapping peptide pools for the stimulation of T cells. Until this patent expires, he will receive royalties on JPT PepMix sales. J.S. and S.M. are employed at Miltenyi Biotec, who provided reagents and devices for this study. All other authors declare no competing interests.
Additional information
Peer review information Nature thanks Akiko Iwasaki and the other, anonymous, reviewer(s) for their contribution to the peer review of this work. Peer reviewer reports are available.
Publisher’s note Springer Nature remains neutral with regard to jurisdictional claims in published maps and institutional affiliations.
Extended data figures and tables
Extended Data Fig. 1 Homology of reported MHC-II epitopes in the spike glycoprotein of SARS-CoV compared with SARS-CoV-2 and endemic hCoV strains.
For each epitope, the respective section from a global sequence alignment between SARS-CoV, SARS-CoV-2 and the hCoVs NL63, 229E, HKU1 and OC43 is shown. Identical residues are colour-coded from white (no identity) to red (100% identity). Reported MHC-II epitopes are described further in Extended Data Table 1.
Extended Data Fig. 2 Exemplary analyses gates and dot plots from patients with COVID-19, RHDs and HDs.
FACS analysis was performed to determine the frequencies of S-I-reactive and S-II-reactive CD4+ T cells and the ratios of CD38+, HLA-DR+ and Ki-67+ cells among the S-I-reactive and S-II-reactive CD4+ T cells.
Extended Data Fig. 3 Most S-I-non-reactive and S-II-non-reactive patients with COVID-19 had a critical disease stage.
Frequencies of S-I- and S-II-reactive CD4+ T cells in patients with COVID-19 are grouped according to disease severity for patients with mild (n = 7), severe (n = 5) or critical (n = 6) disease.
Extended Data Fig. 4 Repeated serology of HDs confirms unexposed status of HDs and RHDs.
SARS-CoV-2 S1 serology of HDs (n = 43) and RHDs (n = 22) more than 28 days after initial sampling. Anti-S1 IgG titres are expressed as a ratio normalized to the calibration well, which contained the provided control serum (as described in the manufacturing instructions).
Extended Data Fig. 5 Expression of cytokines and differentiation markers in S-I-reactive and S-II-reactive CD40L+4-1BB+CD4+ T cells from patients with COVID-19 and RHDs.
a, Gating schematic of one representative donor to select for CD3+CD4+ T cells and exclude dead cells and doublets.b, c, Determination of the differentiation marker and cytokine profiles of S-I- and S-II-reactive CD4+ T cells shown for one patient with COVID-19 and one RHD after S-I and S-II peptide pool stimulation, respectively. SARS-CoV-2 S-reactive CD4+ T cells were defined by CD40L and 4-1BB expression after stimulation and are displayed as red dots. Numbers are the frequencies of cytokine-expressing S-I/S-II-reactive CD4+ T cells and the distribution of the naive (CCR7+CD45RA+) and memory (CCR7+CD45RA− or CCR7−CD45RA−) phenotypes of S-I/S-II-reactive CD4+ T cells, respectively. d, Diagrams summarizing the cytokine and differentiation marker distribution frequencies of S-I- and S-II-reactive CD4+ T cells from patients with COVID-19 (n = 7) and RHDs (n = 5). e, Expression of TNF and IFNγ in S-II-reactive CD4+ T cells from patients and RHDs. Five representative plots of TNF versus IFNγ expression in CD40L+4-1BB+CD4+ T cells from RHDs and patients with COVID-19; gating strategy as shown in Fig. 2.
Extended Data Fig. 6 hCoV-specific IgG antibody titres in HDs and RHDs and specificity of SARS-CoV-2-reactive T cells in HDs.
a, IgG antibody titres against endemic coronavirus strains (hCoVs). VeroB4 cells expressing recombinant spike proteins of hCoV-HKU1, hCoV-OC43, hCoV-229E and hCoV-NL63 were used in a recombinant immunofluorescence assay (rIFA) as described previously36. Titres above 1:20 dilution were considered positive (indicated by the dashed line). HD, n = 9; RHD, n = 9. b–d, Frequencies of SARS-CoV-2 S-I-reactive CD4+ T cells in HDs do not correlate with frequencies of ShCoV-I-reactive or CMV-reactive CD4+ T cells. Frequencies of SARS-CoV-2 S-II-reactive CD4+ T cells in HDs do not correlate with frequencies of CMV-reactive CD4+ T cells. b, Scatter plot of ShCoV-I-reactive CD4+ T cell frequencies (229E, n = 12; OC43, n = 9) and SARS-CoV-2 S-I-reactive CD4+ T cell frequencies. c, Scatter plot of SARS-CoV-2 S-I-reactive CD4+ T cell and CMV-reactive CD4+ T cell frequencies (n = 21). d, Scatter plot of SARS-CoV-2 S-II-reactive CD4+ T cell and CMV-reactive CD4+ T cell frequencies (n = 21). b–d, Correlation coefficients (r) were calculated by Pearson correlation and the related P values are based on _t_-distributions.
Extended Data Table 1 Reported MHC-II epitopes in the spike glycoprotein of SARS-CoV
Extended Data Table 2 Baseline characteristics of hospitalized patients with COVID-19
Extended Data Table 3 Baseline characteristics of healthy donors
Extended Data Table 4 Baseline characteristics of seven additional patients with COVID-19
Supplementary information
Rights and permissions
About this article
Cite this article
Braun, J., Loyal, L., Frentsch, M. et al. SARS-CoV-2-reactive T cells in healthy donors and patients with COVID-19.Nature 587, 270–274 (2020). https://doi.org/10.1038/s41586-020-2598-9
- Received: 09 April 2020
- Accepted: 22 July 2020
- Published: 29 July 2020
- Issue Date: 12 November 2020
- DOI: https://doi.org/10.1038/s41586-020-2598-9