The impact of genotyping error on haplotype reconstruction and frequency estimation (original) (raw)
Introduction
Recently, plans to develop population-specific genome-wide haplotype maps have been announced,1,2 building on a number of intriguing observations such as precise, localised recombination boundaries,3,4 long segmented tracts of highly conserved haplotypes5 and differences in the scale and extent of linkage disequilibrium (LD) in different populations.6,7,8,9 These findings, while highlighting the extreme variability of LD in humans, also emphasise the potential for the whole-genome project to increase basic understanding of the ancestral patterns and fundamental processes involved in recombination, gene-conversion, mutation and selection.
Construction of a dense genome-wide haplotype map creates daunting genotyping challenges, involving as many as 105–106 markers on a number of individuals from multiple populations. Therefore it is important that an efficient study design is employed to maximise LD information while minimising genotyping throughput and cost. To date, several studies have made use of experimental haplotype derivation,10,11 but most investigations have focused on either family-based haplotype inference or haplotype estimation using the genotypes of unrelated individuals. Of the latter two approaches, unrelated samples offer greater genotyping efficiency than pedigree-based designs (as assessed by the number of genotypes required for each founder chromosome), as well as the benefit of simpler ascertainment. In contrast, families are more difficult to collect and have proportionally higher genotyping requirements for the presumed increase in accuracy. Ultimately, the relative merits of these two approaches may be a key determinant of the number and size of populations studied in the construction of chromosome-wide haplotypes.
In recognition of the genotyping efficiency and ease of sampling unrelated individuals, a number of statistical methods for estimating haplotypes from genotype data have been developed, including a sequential inference approach,12 several expectation-maximisation (EM) techniques13,14,15 and recently a Markov chain–Monte Carlo algorithm.16 The accuracy of haplotype frequency estimation using these methods has been considered with respect to haplotype frequency distributions, LD levels, allele frequencies, departures from Hardy–Weinberg equilibrium and sampling error.17,18 In many cases, much of the haplotype frequency information is available in genotypes of unrelated individuals, and thus pedigree designs, with their ascertainment burden and relative genotyping inefficiency, may be unnecessary for large-scale haplotype characterisation.
While the degree of information retained in genotypes of unrelated individuals is encouraging for high-throughput studies, the comparative analyses conducted to date have not considered genotyping error, which may be one of the most salient features in any haplotype study. Slight amounts of genotyping error have the potential to dominate linkage studies19,20 and can substantially influence estimates of pairwise LD.21 The importance of genotyping error may be even more pronounced in collaborative studies such as the genome-wide haplotype project, which will likely involve integrated genotype data from different laboratories with different genotyping platforms and protocols. From this perspective, family-designs may regain some advantages over samples of unrelateds, as they can elucidate at least some of the individual errors via Mendelian inconsistencies and unlikely recombination patterns.
In this study, we evaluate the impact of genotyping error on different study designs, considering both haplotype frequency estimates and direct reconstruction of individual haplotypes, which are useful for cladistic modelling and for evaluating specific recombination patterns with disease. We compare samples of unrelated individuals with two family designs: parent-child trios, the simplest and most efficient family design, and nuclear families of parents plus four offspring, which contain nearly all available information for error detection in nuclear families22 but are relatively inefficient and considerably more difficult to collect. For these comparisons, we employ haplotype estimation procedures which are widely used in current practical applications, in order to identify potential errors of inference and to highlight some of the methodological weaknesses requiring advancement.
Methods
For all comparisons, we conducted 5000 simulations of 25 families by defining founder haplotypes and segregating them to one or four offspring. For each simulation, the unrelated sample comprised the same 50 founders (100 chromosomes). Thus, in this scheme, the number of founder (unrelated) chromosomes are held constant, letting the trios and 4-sib families have 2/3 and 1/3 the efficiency of the unrelated samples (independent of phase information), respectively. To focus upon situations which are illustrative of those likely to be encountered in large haplotyping studies, we simulated local regions of five equispaced (θ=0.001) diallelic markers in each family under conditions where EM performs well (eg, few common haplotypes with many rare or absent haplotypes) or poorly (many equifrequent haplotypes).17 In terms of pairwise LD, three conditions were examined: low LD (0.0<d′>⩽0.50), moderate LD (0.25⩽D′⩽0.75) and high LD, or haplotype blocks (0.75⩽D′⩽0.95), where D′ is as defined previously,</d′>23 the highest D′ values in each situation correspond to adjacent markers and the lowest D′ is between the first and last marker in the haplotype according to a first-order Markov process. Each of the LD conditions was simulated using equifrequent markers (generating many distinct haplotypes when LD is low or moderate) or markers with minor allele frequency 0.10 (generating many rare and few common haplotypes with even slight levels of LD). Genotyping error was introduced randomly in each individual, with error rates varying from 0–10%. The distribution of error was assumed to be uniform; ie, the penetrance function, Pr (observed genotype|underlying genotype) is the same for all possible underlying genotypes.24 This error model has been examined previously in microsatellite studies,25,26 and was selected here because the relevance of directed error models for different SNP technologies is not yet known. The aim of these simulations was to identify general trends of differential impact of genotyping error on study design/method of haplotype estimation, rather than to exhaustively screen for specific differences in an encompassing set of models, frequencies and marker-set compositions.
Frequency differences were assessed via the previously described discrepancy measure:13,16
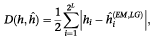
for the 2L true founder (h i) or estimated (h^ i) haplotype frequencies using either the Expectation-Maximisation method (EM)27 for unrelateds, or the related Lander-Green (LG),28 method for trios or 4-sib families method. Differences between individual haplotype inferences were quantified by comparing the proportion of times each haplotype was unambiguously and correctly defined, using the Lander-Green,28 E-M/MCMC,16 or the simple, rapid sequential inference approach.12 In cases where the haplotype being reconstructed was ambiguous, the most probable answer was used. In rare situations where more than one haplotype was equally likely, the haplotype was chosen randomly from the equi-probable set. For all analyses of family data, when any Mendelian error or excessive recombination errors could be detected (via delineation of all possible inheritance vectors)29 the founder genotypes were eliminated prior to haplotype evaluation. For analyses of unrelated individuals, no error detection screening was conducted so that all genotypes were analysed, including those with errors. Although other strategies may be more powerful than simple error omission, this basic strategy has been shown to retain much of the power to detect genetic effects in some linkage and association studies.19,20
Results
The results of haplotype frequency accuracy comparisons using unrelated vs family designs are shown in Figure 1. Several clear trends emerge from these comparisons. First, as expected due to the reliance on familial segregation, performance of the 4-sibling family design (shown as diamonds) does not depend heavily on the level of disequilibrium or the underlying allele frequency: the accuracy gradually decreases with increasing error at a similar rate under all conditions examined. If error detection were perfect, all of these lines would be horizontal. In contrast, owing to the use of marginal genotype frequencies and the complexity of the underlying haplotypes, EM estimates (shown as squares) vary substantially. This can be seen most easily in the baseline (no error) frequency discrepancies of Figure 1, which range from ∼0–15%. It is important to distinguish these inherent methodological/study design differences from those relating to the effects of genotyping error.
Figure 1
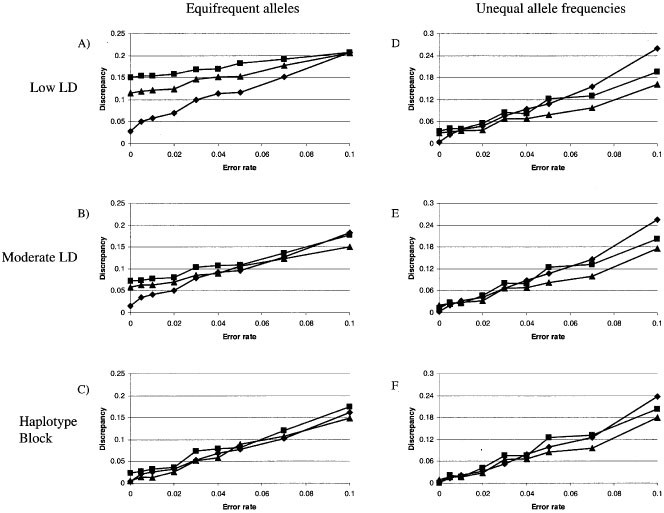
Haplotype frequency differences as a function of LD levels and marker allele frequencies. The ‘low LD’ panels (A,D) refer to adjacent marker LD of 0.0<d′>⩽0.50; the ‘moderate LD’ panels (</d′>B,E) show adjacent marker LD of 0.25⩽D′⩽0.75; and the high-LD panels, or ‘conserved haplotype blocks’ (C,F) refer to segments with 0.75<d′>⩽0.95. Results in the left panels are derived from markers all having equal allele frequencies, which yield many distinct haplotypes for low LD levels and few common haplotypes for high LD. Results in the right panels are derived from markers with 0.10 minor allele frequency, which yield few common haplotypes and many rare haplotypes in all cases. Nuclear families with four offspring and parents are shown as diamonds; trios are shown as triangles; founders (unrelateds) are shown as squares.</d′>
Second, for all study designs and estimation methods, there is a substantial loss of accuracy with increasing genotyping error rate. At 5% error, for example, the discrepancies of frequency estimates increase by as much as 10-fold relative to the levels obtained with perfect genotyping. These dramatic differences can occur in all designs and estimation procedures examined.
Third, the largest differences between the unrelated and family designs occur when there are many distinct haplotypes and moderate or little linkage disequilibrium (Figure 1A,B). As expected in this situation, EM performs substantially worse than family-based haplotype estimation.17 Interestingly, the accuracy differences diminish as genotyping error increases; ie, the discrepancies of family-based estimation gradually decrease with increasing error, but EM estimates do not decline so rapidly. In this case, EM estimates are already poor even with perfect genotyping, as can be seen by the relatively large h^ values (7–17% for error ⩽3%); thus, the estimates only become marginally worse, approaching random levels, with additional error. This is clearly a situation in which large family-designs are preferable to unrelated samples. Given the current density, marker conversion rate and preponderance of common allele SNPs in the public databases,30,31 this may be the typical situation for the impending first-generation LD maps.
Fourth, in the opposite extreme, when there are relatively few common haplotypes and many rare haplotypes (shown as moderate-high LD and/or low allele frequencies; Figure 1C-F), the differences between family and unrelated designs are slight (all D(h,h^) differences <5% for error ⩽5%). For perfect genotyping, this is unsurprising since EM methods have been shown to perform very well17 (as can also be seen in the present results D(h,h^) within 3% of the true values). Surprisingly, however, in the presence of error EM still performs well, despite the inability to detect any errors whatsoever. For moderate error rates (up to 3%), EM estimates differ only slightly from family-based outcomes, showing cumulative frequency differences of only 2% or less with either family design (Figure 1E,F). It is interesting that the relative accuracy changes at about 3%, as has been highlighted as an error rate threshold in pairwise LD assessments.21 In regions of high LD or in assessments of sets of rare alleles (Figure 1C,E,F), there seems little or no advantage of a family-design over the unrelated strategy, whatever the error rate. In our comparisons, unrelateds actually require fewer genotypes/founder chromosome, thus further emphasising their efficiency in this situation.
Finally, in nearly all cases examined, trios (triangles in all panels of Figure 1) do not perform appreciably better than unrelateds. The accuracy of haplotype frequencies derived by familial segregation in trios is more similar to that estimated in unrelateds than that in the larger family design. This is likely due to the fact that relatively few Mendelian errors are detectable in trios,32 so any differences between unrelateds and trios are due more to the use of familial segregation vs marginal genotype frequencies than to differential rates of error detection. The main exception to this trend again occurs in the presence of many different haplotypes of limited conservation (Figure 1A), in which the trios offer an intermediate level of accuracy between the larger family design and the unrelated approach. Given the poor estimation properties of unrelateds in this situation, even the limited information in segregation to a single offspring increases estimation accuracy.
Figure 2 shows the proportion of individual haplotypes completely and correctly inferred using the EM/MCMC, Lander-Green (trio and 4-sib) and sequential inference approaches, under the same conditions of low, moderate and high LD as depicted in Figure 1. In many cases, the results for individual haplotypes are similar to those for haplotype frequencies. In particular, family-based haplotype assessment performs very well (>95% accuracy) in all LD/allele frequency situations examined up to an error rate of 1%, after which the accuracy decreases at a fairly consistent rate. EM/MCMC estimation is just as accurate as family-based estimation when relatively few common haplotypes are available (Figure 2C,E,F), but suffers dramatically whenever LD is low (Figure 2A,D). These differences, also apparent in our frequency comparisons, are striking when considering individual haplotype estimation: for the case of low LD/equifrequent alleles (Figure 2A), the best performance of any method on unrelated individuals results in incorrect assignment of at least 1/3 of the haplotypes, while the use of large families results in correct assignment of at least 95% of the haplotypes in all cases up to 1% error. Interestingly, the heuristic sequential inference method outperforms EM/MCMC in the presence of low LD/unequal allele frequencies (Figure 2D) across the entire range of genotyping error. Thus, for all cases except low-moderate LD with common alleles (Figure 2A,B), sampling unrelated individuals may be preferred, since at least one analysis method can recover the haplotypes approximately as well as family-based segregation inference. As noted previously, however, the low-moderate LD/common allele case in which families are favoured may be more illustrative of the patterns expected from currently available marker sets, due to the marker density in any one population and the excess of common allele markers.
Figure 2
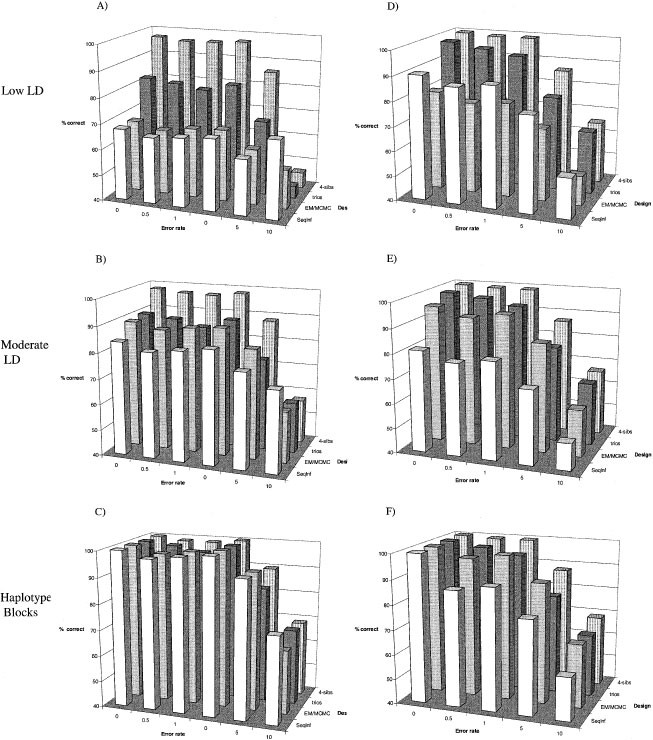
Proportion of haplotypes correctly and completely identified in individuals. Five markers were simulated according to the categories shown in Figure 1.
As observed in the haplotype frequency comparisons, the accuracy of haplotype inference in trios is generally closer to that in unrelateds than to larger families. The only exceptions to this pattern occurred with little LD, which is unsurprising since most haplotype information is only apparent via familial segregation when LD is very low or absent. Detection of genotyping error in trios did not confer substantially greater accuracy than unrelated individuals and EM estimation.
Overall, the results suggest that the LD patterns and complexity of haplotypes and the use of familial segregation or marginal genotype frequencies are more important determinants of the utility of family vs unrelated designs than is the capacity for detecting genotyping error. To illustrate this point, the accuracy of individual haplotype prediction, in terms of proportion of correct inferences, was calibrated for each design/analysis method on the basis of its performance with perfect genotyping. This allows direct comparison of the proportional decrease in accuracy due to error, conditional on the baseline differences in design/analysis method performances. The results of these comparisons reveal highly similar trends by all methods and study designs (Figure 3). That is, the accuracy of each study design/analysis method decreases at approximately the same rate in the presence of genotyping error, given their baseline accuracies. EM approaches perform well when there are relatively few haplotypes but poorly when there are many, and large family designs perform about the same for all LD patterns but carry additional genotyping burdens; these relative strengths/weaknesses are largely unaltered by the introduction of genotyping error. Consequently, the capacity to detect genotyping errors seems of lesser importance for choosing sampling designs than the density of markers, their frequency profiles and the analytical approaches employed.
Figure 3
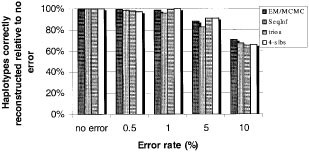
Proportional reduction in accuracy relative to no error. For each study design and analysis method, the percentage of correct haplotypes identified under no error was set as the baseline (100% at no error), and proportional reductions from the calibrated baseline level plotted. The data are shown for the situation of moderate LD in five markers, each having a minor allele frequency of 0.30. Other LD/allele frequency combinations also showed strong similarities between the designs/methods (data not shown).
Discussion
The results of these simulations offer several suggestions for the design of large-scale LD studies such as the haplotype map initiative: (i) In general, genotyping larger families appears appropriate and justifiable for marker maps in which average LD may be low and/or most markers have common alleles. In these cases, which may be illustrative of the currently available SNP collections, haplotype inference via familial segregation and the ability to detect and eliminate many genotyping errors yields substantially greater accuracy than frequency estimation using unrelated individuals. (ii) Conversely, studies of unrelated individuals appear preferable in investigations of rare alleles and particularly in densely spaced markers with higher expected LD levels, when the ability to detect genotyping errors in families does not seem to warrant the reduction in genotyping efficiency. (iii) The low rate of error detection in trios does not yield enough information to warrant the increased genotyping required relative to unrelated samples. It should be noted, however, that this general lack of utility of trios is due in large part to the exclusive use of familial segregation for haplotype inference. Methods which incorporate both familial transmission and genotype frequencies, thereby combining the benefits of error detection, segregation patterns and underlying haplotype frequencies, but which are as yet undeveloped, could favour trios and yield more efficient and accurate methods for cataloguing LD patterns. Moreover, methods for explicit detection and modelling of genotype error within the full distribution of possible haplotypes, similar to the approaches recently developed for markers in linkage equilibrium,24,33 could significantly increase the accuracy of family designs.
There are a number of additional error and analysis models that could be explored to address questions of genotyping error and haplotype inference, including longer haplotypes (more markers), different sample sizes and deeper pedigrees. While such investigations are essential for any specific application, the general trends shown here, favouring large pedigrees for moderate LD/common allele situations and unrelateds otherwise, would not be expected to change dramatically. We have conducted simulations of up to 25 markers with sample sizes up to 400 chromosomes (data not shown), and while the absolute accuracy levels vary, the general trends are unchanged.
References
- Adam D . Genetics group targets disease markers in the human sequence Nature 2001 412: 105
Article CAS Google Scholar - Robertson D . Racially defined haplotype project debated Nat Biotechnol 2001 19: 795–796
Article CAS Google Scholar - Jeffreys AJ, Kauppi L, Neumann R . Intensely punctate meiotic recombination in the class II region of the major histocompatibility complex Nat Genet 2001 29: 217–222
Article CAS Google Scholar - Jeffreys AJ, Ritchie A, Neumann R . High resolution analysis of haplotype diversity and meiotic crossover in the human TAP2 recombination hotspot Hum Mol Genet 2000 9: 725–733
Article CAS Google Scholar - Daly MJ, Rioux JD, Schaffner SF, Hudson TJ, Lander ES . High-resolution haplotype structure in the human genome Nat Genet 2001 29: 229–232
Article CAS Google Scholar - Taillon-Miller P, Bauer-Sardina I, Saccone NL et al. Juxtaposed regions of extensive and minimal linkage disequilibrium in human Xq25 and Xq28 Nat Genet 2000 25: 324–328
Article CAS Google Scholar - Eaves IA, Merriman TR, Barber RA et al. The genetically isolated populations of Finland and Sardinia may not be a panacea for linkage disequilibrium mapping of common disease genes Nat Genet 2000 25: 320–323
Article CAS Google Scholar - Abecasis GR, Noguchi E, Heinzmann A et al. Extent and distribution of linkage disequilibrium in three genomic regions Am J Hum Genet 2001 68: 191–197
Article CAS Google Scholar - Reich DE, Cargill M, Bolk S et al. Linkage disequilibrium in the human genome Nature 2001 411: 199–204
Article CAS Google Scholar - Douglas JA, Boehnke M, Gillanders E, Trent JM, Gruber SB . Experimentally-derived haplotypes substantially increase the efficiency of linkage disequilibrium studies Nat Genet 2001 28: 361–364
Article CAS Google Scholar - Michalatos-Beloin S, Tishkoff SA, Bentley KL, Kidd KK, Ruano G . Molecular haplotyping of genetic markers 10 kb apart by allele-specific long-range PCR Nucleic Acids Res 1996 24: 4841–4843
Article CAS Google Scholar - Clark AG . Inference of haplotypes from PCR-amplified samples of diploid populations Mol Biol Evol 1990 7: 111–122
CAS PubMed Google Scholar - Excoffier L, Slatkin M . Maximum-likelihood estimation of molecular haplotype frequencies in a diploid population Mol Biol Evol 1995 12: 921–927
CAS PubMed Google Scholar - Hawley ME, Kidd KK . HAPLO: a program using the EM algorithm to estimate the frequencies of multi-site haplotypes J Hered 1995 86: 409–411
Article CAS Google Scholar - Long JC, Williams RC, Urbanek M . An E-M algorithm and testing strategy for multiple-locus haplotypes Am J Hum Genet 1995 56: 799–810
CAS PubMed PubMed Central Google Scholar - Stephens M, Smith NJ, Donnelly P . A new statistical method for haplotype reconstruction from population data Am J Hum Genet 2001 68: 978–989
Article CAS Google Scholar - Fallin D, Schork NJ . Accuracy of haplotype frequency estimation for biallelic loci, via the expectation-maximization algorithm for unphased diploid genotype data Am J Hum Genet 2000 67: 947–959
Article CAS Google Scholar - Tishkoff SA, Pakstis AJ, Ruano G, Kidd KK . The accuracy of statistical methods for estimation of haplotype frequencies: an example from the CD4 locus Am J Hum Genet 2000 67: 518–522
Article CAS Google Scholar - Douglas JA, Boehnke M, Lange KA . multipoint method for detecting genotyping errors and mutations in sibling-pair linkage data Am J Hum Genet 2000 66: 1287–1297
Article CAS Google Scholar - Abecasis GR, Cherny SS, Cardon LR . The impact of genotype error on family-based analysis of quantitative traits Euro J Hum Genet 2001 9: 130–134
Article CAS Google Scholar - Akey JM, Zhang K, Xiong M, Doris P, Jin L . The effect that genotyping errors have on the robustness of common linkage-disequilibrium measures Am J Hum Genet 2001 68: 1447–1456
Article CAS Google Scholar - Gordon D, Leal SM, Heath SC, Ott J . An analytic solution to single nucleotide polymorphism error-detection rates in nuclear families: implications for study design Pac Symp Biocomput 2000 663–674
- Lewontin RC, Kojima K . The evolutionary dynamics of complex polymorphisms Evolution 1960 14: 450–472
Google Scholar - Sobel E, Papp JC, Lange K . Detection and integration of genotyping errors in statistical genetics Am J Hum Genet 2002 70: 496–508
Article Google Scholar - Lincoln SE, Lander ES . Systematic detection of errors in genetic linkage data Genomics 1992 14: 604–610
Article CAS Google Scholar - Ott J . Detecting marker inconsistencies in human gene mapping Human Heredity 1993 43: 25–30
Article CAS Google Scholar - Weir BS, Cockerham CC . Estimation of linkage disequilibrium in randomly mating populations Heredity 1979 42: 105–111
Article Google Scholar - Lander ES, Green P . Construction of multilocus genetic linkage maps in humans Proc Natl Acad Sci USA 1987 84: 2363–2367
Article CAS Google Scholar - Abecasis GR, Cherny SS, Cookson WO, Cardon LR . Merlin-rapid analysis of dense genetic maps using sparse gene flow trees Nat Genet 2002 30: 97–101
Article CAS Google Scholar - Sachidanandam R, Weissman D, Schmidt SC et al. A map of human genome sequence variation containing 1.42 million single nucleotide polymorphisms Nature 2001 409: 928–933
Article CAS Google Scholar - Marth G, Yeh R, Minton M et al. Single-nucleotide polymorphisms in the public domain: how useful are they? Nat Genet 2001 27: 371–372
Article CAS Google Scholar - Gordon D, Heath SC, Ott J . True pedigree errors more frequent than apparent errors for single nucleotide polymorphisms Hum Hered 1999 49: 65–70
Article CAS Google Scholar - Douglas JA, Skol AD, Boehnke M . Probability of detection of genotyping errors and mutations as inheritance inconsistencies in nuclear-family data Am J Hum Genet 2002 70: 487–495
Article CAS Google Scholar - Abecasis GR, Cookson WO . GOLD graphical overview of linkage disequilibrium Bioinformatics 2000 16: 182–183
Article CAS Google Scholar
Acknowledgements
This research project was supported by a Wellcome Trust Travel Award to KM Kirk. LR Cardon was supported by a Wellcome Trust Principal Research Fellowship and by NIH grant EY-12562. Lander-Green haplotype estimation was conducted using MERLIN29 (http://bioinformatics.well.ox.ac.uk/Merlin/). EM-based estimates were conducted using ldmax in the GOLD package (www.well.ox.ac.uk/asthma/GOLD/)34 and the SNPHAP program kindly provided by Dr David Clayton, Cambridge University (www-gene.cimr.cam.ac.uk/clayton/software/). Haplotype reconstruction using the EM/MCMC method of Stephens et al16 was performed using PHASE (www.stats.ox.ac.uk/mathgen/software.html).
Author information
Authors and Affiliations
- Department of Psychiatry, The University of Queensland and Genetic Epidemiology Laboratory, Queensland Institute of Medical Research, Brisbane, Australia
Katherine M Kirk - Wellcome Trust Centre for Human Genetics, University of Oxford, UK
Lon R Cardon
Authors
- Katherine M Kirk
You can also search for this author inPubMed Google Scholar - Lon R Cardon
You can also search for this author inPubMed Google Scholar
Corresponding author
Correspondence toLon R Cardon.
Rights and permissions
About this article
Cite this article
Kirk, K., Cardon, L. The impact of genotyping error on haplotype reconstruction and frequency estimation.Eur J Hum Genet 10, 616–622 (2002). https://doi.org/10.1038/sj.ejhg.5200855
- Received: 17 December 2001
- Revised: 19 March 2002
- Accepted: 11 June 2002
- Published: 02 October 2002
- Issue Date: 01 October 2002
- DOI: https://doi.org/10.1038/sj.ejhg.5200855