Imbalance in amino acid and purine metabolisms at the hypothalamus in inflammation-associated depression by GC-MS† (original) (raw)
Journal Article
Yu Wu ,
a
The Institute of Clinical Research and Translational Medicine, Gansu Provincial Hospital
,
204 Donggang West Road Chengguan District, Lanzhou, Gansu, 730000, China
+86-931-8281222
+86-931-8281222
Search for other works by this author on:
a
The Institute of Clinical Research and Translational Medicine, Gansu Provincial Hospital
,
204 Donggang West Road Chengguan District, Lanzhou, Gansu, 730000, China
+86-931-8281222
+86-931-8281222
Search for other works by this author on:
a
The Institute of Clinical Research and Translational Medicine, Gansu Provincial Hospital
,
204 Donggang West Road Chengguan District, Lanzhou, Gansu, 730000, China
+86-931-8281222
+86-931-8281222
Search for other works by this author on:
a
The Institute of Clinical Research and Translational Medicine, Gansu Provincial Hospital
,
204 Donggang West Road Chengguan District, Lanzhou, Gansu, 730000, China
+86-931-8281222
+86-931-8281222
Search for other works by this author on:
Hui Xu ,
a
The Institute of Clinical Research and Translational Medicine, Gansu Provincial Hospital
,
204 Donggang West Road Chengguan District, Lanzhou, Gansu, 730000, China
+86-931-8281222
+86-931-8281222
Search for other works by this author on:
Rui Guo ,
a
The Institute of Clinical Research and Translational Medicine, Gansu Provincial Hospital
,
204 Donggang West Road Chengguan District, Lanzhou, Gansu, 730000, China
+86-931-8281222
+86-931-8281222
Search for other works by this author on:
a
The Institute of Clinical Research and Translational Medicine, Gansu Provincial Hospital
,
204 Donggang West Road Chengguan District, Lanzhou, Gansu, 730000, China
+86-931-8281222
+86-931-8281222
Search for other works by this author on:
Jing Jia ,
a
The Institute of Clinical Research and Translational Medicine, Gansu Provincial Hospital
,
204 Donggang West Road Chengguan District, Lanzhou, Gansu, 730000, China
+86-931-8281222
+86-931-8281222
Search for other works by this author on:
a
The Institute of Clinical Research and Translational Medicine, Gansu Provincial Hospital
,
204 Donggang West Road Chengguan District, Lanzhou, Gansu, 730000, China
+86-931-8281222
+86-931-8281222
Search for other works by this author on:
a
The Institute of Clinical Research and Translational Medicine, Gansu Provincial Hospital
,
204 Donggang West Road Chengguan District, Lanzhou, Gansu, 730000, China
+86-931-8281222
+86-931-8281222
Search for other works by this author on:
Accepted:
25 October 2017
Published:
25 October 2017
 PDF
PDF Cite
Yu Wu, Yonghong Li, Yanjuan Jia, Chaojun Wei, Hui Xu, Rui Guo, Yuanting Li, Jing Jia, Xiaoming Qi, Xiaoling Gao, Imbalance in amino acid and purine metabolisms at the hypothalamus in inflammation-associated depression by GC-MS, Molecular BioSystems(MBS), Volume 13, Issue 12, 1 December 2017, Pages 2715–2728, https://doi.org/10.1039/C7MB00494J
Close
Navbar Search Filter Mobile Enter search term Search
Abstract
Hypothalamic dysfunction is a key factor in depression; increasing evidence highlights neuroinflammation abnormalities as well as imbalances in neurotransmitters and the purinergic system in the pathophysiology of depression. However, little is known about the metabolomic changes in the hypothalamus of depressed patients with neuroinflammation. Herein, taking advantage of the well-established lipopolysaccharide (LPS)-induced depression mouse model, we measured metabolic changes in the hypothalamus using gas chromatography-mass spectrometry (GC-MS). Sucrose preference test (SPT), open field test (OFT), forced swimming test (FST), and tail suspension test (TST) were conducted to assess our depressive model. To better understand the metabolic disturbances occurring in the hypothalamus of depressed mice, multivariate statistics were applied to analyse the clinical significance of differentially expressed metabolites in the hypothalamus of mice with LPS-induced depression. Bioinformatic analysis was conducted to detect potential relationships among the changed metabolites. The data confirmed that mice with LPS-induced depression were good mimics of depression patients in some characteristic symptoms such as decreased sucrose intake and increased immobility. In our study, 27 differentially expressed metabolites were identified in the hypothalamus of mice with LPS-induced depression. Herein, seventeen of these metabolites decreased, whereas 10 metabolites increased. These molecular changes were closely related to perturbations in the amino acid and purine metabolisms. Our data indicate that dysfunction of amino acid and purine metabolisms is one of main characteristics of inflammation-mediated depression. These results provide new insights into the mechanisms underlying depression, which may shed some light on the role of the hypothalamus in the pathogenesis of inflammation-mediated depression.
1. Introduction
Depression, the most common form of psychiatric disorders, affects approximately 20% of people during their lifetime. Depression is estimated to become the leading cause of disability in the next 10 years.1 Although depression has substantial impacts on individuals, families, and society as an increasing global public health issue, its pathophysiology remains unraveled.2 Various etiopathological hypotheses have been postulated; among them, the neuroinflammatory cytokine hypothesis,3 monoamine deficiency,4 neurogenesis, imbalance of neurotransmitter systems,5 and the microbiota and the gut–brain axis2,6 are the most well-established. However, depression is a heterogeneous disorder with varied clinical symptoms and highly variable progression. None of these hypotheses can independently account for the complex pathophysiological mechanisms of depression.
It is generally accepted that inflammatory disturbances and increased cytokine levels are closely associated with depression.3,7 Several evoking inflammatory events, such as systemic infections, cancer, and autoimmune diseases, can activate the immune system. When activation of the immune system is not under control properly and timely, the ensuing immune molecules invade the brain, which can provoke neuroinflammatory perturbation of the central nervous system (CNS) and then cause the development of symptoms of depression in vulnerable individuals.3,8 Compelling evidence indicates that multiple inflammatory products, including tumor necrosis factor-alpha (TNF-α), interleukin-1 beta (IL-1β), and IL-6, are increased in both the CNS and peripheral blood of patients with depression.9,10 The hypothalamic-pituitary-adrenal (HPA) axis,11 the glutamatergic system,12 and synaptic plasticity13 are critical in the pathogenesis of inflammation-mediated depression. Individuals with inflammation-induced depression show altered activity of the HPA axis, hypothalamic neuroendocrine dysfunction,14 abnormal communication with other brain areas,15 and aberrant neuroimaging.16 The HPA axis activity is increased upon exposure to depression-associated stress factors.14,17 The HPA axis is composed of the hypothalamic hypophysiotropic area, the pituitary gland, and the adrenal cortex. These are able to synthesize and release corticotrophin-releasing hormone (CRH), adrenocorticotropic hormone (ACTH), and glucocorticoids (principally cortisol).17 Hyperactivity of the HPA axis is conducive to neuroendocrine dysfunction. Elevated secretion of CRH, ACTH, and cortisol has been reported in the cerebrospinal fluid (CSF) of patients with major depressive disorder (MDD).18 Furthermore, as a key neuroendocrine region in the HPA axis, the hypothalamus has strong communication with the prefrontal cortex and hippocampus. Dysfunction in these areas is widely recognized in the pathogenesis of depression.19 The HPA axis activity is regulated by the prefrontal cortex and hippocampus via attenuation of the hypothalamic glucocorticoid negative feedback system in depression.15,17 Moreover, neuroimaging studies have shown structural abnormalities of the hypothalamus in depressive patients.20 The aforementioned evidence indicates that alterations of hypothalamus functionality are critical in the pathophysiology of depression.
Recently, metabolomics, the quantitative measurement of the dynamic metabolic response to pathophysiological stimuli or genetic modification, has been regarded as the latest-omics strategy.21,22 Metabolomics has developed rapidly with multiple advanced approaches such as gas chromatography-mass spectrometry (GC-MS), liquid chromatography-mass spectrometry (LC-MS), and nuclear magnetic resonance spectroscopy (NMR) techniques. Compared with the aforementioned LC-MS and NMR, GC-MS is more widely used because of its high sensitivity, peak resolution, and excellent reproducibility.23 Through adopting metabolomics in the study of depression, mounting evidence of metabolic irregularities in peripheral blood24,25 and brain tissue21,26 in the depression models and in the urine27 and plasma28 of patients with MDD has been obtained. Several irregularities in neurotransmitters, energy, lipid metabolism, etc. have been disclosed.21,24,26 However, there is no direct evidence that demonstrates metabolic dysfunction of the hypothalamus.
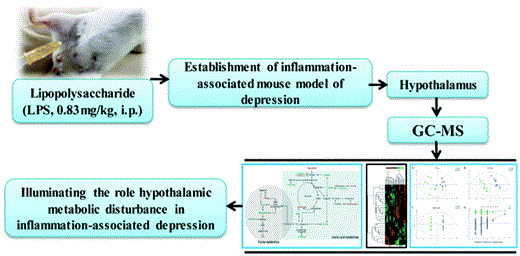
In this study, we established a well-validated lipopolysaccharide (LPS)-induced mouse model of depression,3,21 which has been adopted to clarify the relationship between inflammation and depression.8,14,21 GC-MS was employed to distinguish the hypothalamus-based metabolic patterns. This study may furnish valuable insights into hypothalamus-based metabolic changes. It may aid in finding authentic metabolic differences in the hypothalamus in inflammation-mediated depression. Better recognition of the underlying mechanisms of depression may pave the way to antidepressant discovery and specific biomarker exploration.
2. Materials and methods
2.1. Animals and ethics statement
Adult 12-week-old male CD-1 (ICR) mice (specific-pathogen-free grade) weighing 35–40 g at the beginning of the experiment were obtained from Beijing Vital River Laboratory Animal Technology Co., Ltd (Beijing, China). This study was approved by the Ethics Committee of Gansu Provincial Hospital. The handling, experimental procedures, and care of the animals were carried out in accordance with the National Institutes of Health Guide for the Care and Use of Laboratory Animals.29 All efforts were made to minimize the number of animal used and their suffering.
2.2. Experimental reagents
LPS (L-3129, Escherichia coli serotype 0127:B8, Sigma-Aldrich, St. Louis, MO, USA) was dissolved in sterile isotonic saline and administered by intraperitoneal (i.p.) injection at a dose of 0.83 mg kg−1. This dose was selected because it elicits a pro-inflammatory cytokine response in the brain, resulting in depressive-like behaviors in CD-1 male mice.3,8 A control group was injected (i.p.) with saline.
2.3. Experimental design and behavioral tests
The time was scheduled for the establishment of the LPS-induced depressive-like model, and behavioral tests were performed as previously described.21 Depressive-like behaviors were assessed at 24 h post-LPS i.p. administration and observed during the first 4 h of the dark phase in the light cycle (8:00–12:00 a.m.) under conditions of dim light and low noise. Behaviors were monitored by two well-trained observers who were blind to the treatment.
Sucrose preference test (SPT) and body weight (BW)
The SPT test was performed as previously described.14 This test was designed to evaluate the effects of LPS treatment on the preference for a sucrose solution using a two-bottle paradigm. Briefly, mice were presented simultaneously with two identical bottles containing either water or a sucrose solution (2% w/v). The positions of the two bottles were altered regularly to reduce potential bias from place preference. Prior to the testing conditions, all mice were acclimatized to the two-bottle test choice. Then, twenty-four hours before LPS treatment, the mice were deprived of water and food. Total fluid consumption was determined by weighing the two bottles before and after the test. Sucrose preference was calculated as the percentage of sucrose solution ingested relative to the total amount of liquid consumed. That is, sucrose preference = (sucrose intake/[sucrose consumption + water consumption]) × 100%.17 In addition, the BW of all mice was measured before and 24 h after LPS treatment, and the changes in BW were analyzed.
Open field test (OFT)
Prior to experimentation, all mice were placed in the testing room for 30 min to allow adaptation. The mice were then individually placed in an open-field apparatus consisting of a black square base (45 × 45 cm) with black walls (45 cm in height). After 1 min adaptation, a 5 min period of horizontal locomotor activity (distance travelled in cm) was filmed using a video tracking system (SMART 2.5; PanLab; Barcelona, Spain) as previously described.30
Forced swimming test (FST)
The FST was conducted based on a previously described method.8 Briefly, each mouse was placed individually in a Plexiglas cylinder (30 cm height, 15 cm diameter) containing 20 cm of water (24 ± 1 °C). The test sessions lasted for 6 min, with the last 5 min scored for immobility by a well-trained observer. Immobility was defined as the absence of all motion with the exception of movements required to keep the mouse's head above the water. Struggling was defined as vigorous movements with the forepaws breaking the water. The FST experiment was filmed by a video tracking system and analyzed using the SMART 2.5 software (Panlab Barcelona, Barcelona, Spain) based on the surface change rate between sequential images of animal shapes.
Tail suspension test (TST)
The TST was performed as described previously.21,31 Briefly, each mouse was hung from its tail with adhesive tape placed 2 cm from the tip of the tail in an acoustically and visually isolated suspension box (22 × 21 × 33 cm) for a period of 6 min. The duration of the movement of each individual mouse was determined during the last 5 min of testing. Animals were considered to be immobile when they exhibited no body movement and hung passively.
2.4. Behavioral data statistical analysis
All behavioral results are presented as mean ± standard error of the mean (SEM) and analyzed using SPSS Statistics Version 21.0 (SPSS; IBM, Armonk, NY, USA). The two-tailed Student's _t_-test was used to analyze the significant differences between two groups. A _p_-value less than 0.05 was considered to be statistically significant.
2.5. Sample collection and preparation
As soon as the behavioral tests were finished, the mice were sacrificed, and the whole brain was removed. The hypothalamus was separated from the brain, weighed, rapidly frozen with liquid nitrogen, and stored at −80 °C until analysis. For GC-MS analysis, a 30 mg brain tissue sample was homogenized in a 1 mL precooled 500 μL methanol–water–chloroform (5 : 2 : 2, v/v/v) mixed solution with l-2-chlorophenylalanine (0.3 mg mL−1, 20 μL) as an internal standard. The resulting mixture was sonicated for 6 min, incubated at 4 °C for 20 min, and subsequently centrifuged at 12 000 rpm for 10 min at 4 °C. A 500 μL aliquot of the supernatant was transferred into a glass sampling vial for vacuum-drying at room temperature. The residue was derivatized using a two-step procedure. At first, 80 μL methoxamine hydrochloride (15 mg mL−1 in pyridine) was added to the vial, which was then vortexed for 2 min and maintained at 37 °C for 90 min. Subsequently, 80 μL N,_O_-bis(trimethylsilyl)trifluoroacetamide (BSTFA) with 1% trimethylsilyl chloride (TMCS) and 20 μL _n_-hexane was added to the mixture and incubated at 70 °C for 1 h to form derivatives. After derivatization and cooling at room temperature for 30 min, the derivative was injected into the GC-MS for analysis.
2.6. GC-MS analysis
Each 1 μL aliquot of derivatized solution was injected into the Agilent 7890A/5975C GC/MSD system (Agilent Technologies, Santa Clara, CA, USA) with a splitless model. Separation was carried out using a DB-5MS fused silica capillary column (30 m × 0.25 mm × 0.25 μm, Agilent Technologies) with high-purity helium as the carrier gas at a constant flow rate of 1.0 mL min−1. The GC temperature programming was set to begin at 90 °C for 1 min. It was then increased from 90 °C to 180 °C at 10 °C min−1, from 180 °C to 240 °C at 5 °C min−1, and finally from 240 °C to 290 °C at 25 °C min−1; it was then maintained for 11 min at 290 °C. The column effluent was introduced into the ion source of an Agilent 5975C mass selective detector (Agilent Technologies). The temperature of the injection and ion source was set to 260 °C and 230 °C, respectively. Electron impact ionization (−70 eV) was used, with an acquisition rate of 20 spectrum per s in the MS setting. MS detection was conducted in the electron impact ionization mode in the full scan mode from 50 to 450 m/z. To avoid the influence of instrument signal fluctuations, a random order of continuous sample analysis was adopted. Notably, quality control samples were prepared by mixing equal aliquots of brain tissue samples from each mouse and pretreated in the same manner as the real sample. One quality control sample was inserted regularly after every ten real samples.
2.7. Metabolomic data analysis and identification of metabolic signatures
The GC-MS metabolite profiles were processed by conversion into NetCdf file format using TagFinder.32 This process enabled deconvolution, alignment, and data reduction to produce a list of m/z and retention time pairs, with the corresponding intensities for all detected peaks from each data file in the data set. The resulting three-dimensional data set, including peak indices (RT-m/z pairs), sample names (observations), and normalized peak area percentages, was imported into SIMCA-P 14.0 (Umetrics, Umeå, Sweden). Principal component analysis (PCA) was used to observe the distributions of all samples and assess the stability of analysis. Partial least squares-discriminant analysis (PLS-DA) was also performed to improve classification and provide pair-wise comparison between groups. Then, to maximize class discrimination, the data were further analyzed using orthogonal partial least-squares discriminant analysis (OPLS-DA).33 This was carried out to reduce the effects of non-relevant metabolite variability and identify hypothalamus metabolites contributing to the differences between groups. OPLS-DA produced two key parameters: R_2_Y (the cumulative model variation in Y) and _Q_2 (the cumulative predicted variation). As these parameters approached 1.0, a robust model with predictive reliability was indicated. By analyzing the OPLS-DA loadings, metabolites with variable importance in the projection (VIP) value >1.0 and in the two-tailed Student's _t_-test (p < 0.05) on the normalized raw data were identified as differential metabolites responsible for sample differentiation.34 A 200-iteration permutation test was performed to validate the differences between groups. The fold change was calculated as the logarithm of the average mass response (area) ratio between groups. A heat map was constructed based on the differential metabolites and implemented using OmicShare tools, a free online platform for data analysis (www.omicshare.com/tools) with hierarchical clustering.
2.8. Bioinformatic analysis
To verify the molecular pathways and explore the biological functions of molecules of interest among the identified metabolites, the details, including biochemical features, cellular location, and biological functions, were investigated by referencing annotations from the Kyoto Encyclopedia of Genes and Genomes (KEGG; http://www.genome.jp/kegg/), the PubChem Database (PCDB, https://www.ncbi.nlm.nih.gov/pccompound), and the Human Metabolome Database (HMDB; http://www.hmdb.ca). The terms from the database-based functional annotation charts were visualized by the Enrichment Map plugin of Cytoscape software.35 Moreover, the identified metabolites (with KEGG IDs or HMDB IDs) were uploaded to MetaboAnalyst 3.0 (http://www.metaboanalyst.ca/).36 This web server is designed to permit comprehensive metabolomic data analysis, visualization, and interpretation. Fisher's exact test and out-degree centrality were performed for pathway enrichment analysis and pathway topology analysis of the differential metabolites, respectively. The most significantly altered metabolic pathways and their possible biological roles were evaluated using the MetaboAnalyst tool.
3. Results
3.1. Assessment of the LPS-induced depressive-like model
CD-1 mice (n = 10 mice per group) were challenged with LPS (0.83 mg kg−1, i.p.; referred to hereinafter as LPS mice) or physiological saline. The mice were then weighed at 24 h post-injection and submitted to tests of depressive-like behaviors before being euthanized for brain sample collection.
To ensure that LPS had the intended effects, physiological sickness responses were detected by changes in body weight (BW) and food intake. Patients with depression usually lose appetite and decrease their food intake. Following LPS exposure, food intake of the LPS-exposed mice was significantly lower as compared to that of the control group (t = 7.438, p < 0.001, Fig. 1C). The BW change is a sensitive measurement of sickness in animals. The data showed that BW changes of the LPS group were significantly lower than those of the control group (BW change (g), t = 9.676, p < 0.001, Fig. 1A; BW change (%), t = 11.822, p < 0.001, Fig. 1B). The changes in food intake and BW reflected that the LPS mice were stressed and suffered from inflammatory disorders.
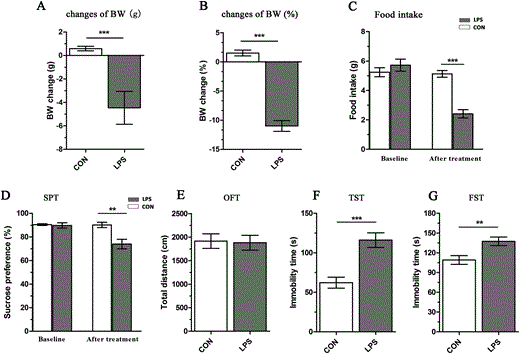
Fig. 1
Assessment of the LPS-induced depressive-like model. (A and B) Changes in body weight (BW) during the 24 h following lipopolysaccharide (LPS) exposure. (C) Changes in food intake during the 24 h following LPS exposure. (D) Sucrose preference in the sucrose preference test (SPT) 24 h after LPS treatment. (E) Locomotor activities in the open-field test (OFT) after 24 h LPS exposure. (F and G) Immobility times in the tail suspension test (TST) and forced swimming test (FST), respectively. Values are shown as mean ± SEM (n = 10 mice per group). CON, control group; LPS, LPS-induced depressed group. **p < 0.01, ***p < 0.001, LPS vs. CON. Bars indicate statistical differences between groups.
As a key component of depression, anhedonia in rodents simulates the blunted interest for reward in depressed patients. The SPT has been interpreted as an estimate paradigm of anhedonia-like behavior. No significant difference was found in the sucrose preference of naïve mice. The LPS mice displayed a dramatic reduction in sucrose intake as compared to the control group (t = 3.507, p < 0.01, Fig. 1D). This decreased sucrose preference reflected depression-related anhedonia-like behavior following LPS administration.
The TST and FST are standardized tests of depressive-like behavior in which depression is related to increased duration of immobility. LPS-induced despair and helplessness in inescapable situations were assessed by measuring the duration of immobility in the TST and FST at 24 h post-injection in the absence of apparent deficits in locomotor activity. The LPS mice showed a significant increase in immobility time as compared to the control group in both the TST (t = −4.655, p < 0.001, Fig. 1F) and FST (t = −3.052, p < 0.01, Fig. 1G). The data strongly suggested the successful establishment of an LPS-induced depression mouse model.
To distinguish anxiety-like disorders from depressive-like disease, anxiety-like behavior was evaluated by the OFT. The LPS mice did not show significant changes in total distance traveled in the OFT (t = 0.153, p = 0.880, Fig. 1E); this reflected that LPS administration had no significant effects on spontaneous horizontal locomotor activity at 24 h post-injection. This suggested that there was no co-occurrence of anxiety-like behavior in our studies.
3.2 Identification of differential metabolites
Based on the established LPS-induced depression mouse model, we attempted to detect hypothalamic metabolic changes in LPS-induced depressive mice as compared to those in a control group. GC-MS-based metabolomics detection was performed to identify differential metabolites by multi-dimensional statistical analysis. Under the optimal GC-MS conditions, visual inspection of total ion current chromatograms (TIC) was applied to all samples. All TIC from individual samples displayed strong signals with a large peak capacity and good reproducibility in retention time (Fig. 2). A total of 177 metabolites of known identity were detected and subjected to subsequent multivariate analysis. A principal component analysis (PCA) scores plot was generated to show the differences between metabolites in the LPS-treated mice and the control group. Our data showed obvious discrimination of the LPS mice from the controls (R_2_X = 0.466, _Q_2 = 0.159; Fig. 3A). Pair-wise partial least squares-discriminant analysis (PLS-DA) score plots also revealed that the LPS mice were statistically distinguishable from the control mice (R_2_X = 0.197, R_2_Y = 0.979, and _Q_2 = 0.587; Fig. 3B). To maximize the discrimination between the two groups, orthogonal partial least squares-discriminant analysis (OPLS-DA) was carried out. OPLS-DA loading plots revealed that this model was efficient and showed a clear separation of the LPS group from the control group (R_2_X = 0.439, R_2_Y = 1, and _Q_2 = 0.734; Fig. 3C). All positive parameters (R_2_X, R_2_Y, and Q_2_Y) to quantify the OPLS-DA model demonstrated that the OPLS-DA model was reliable (R_2_X and R_2_Y are the cumulative model variations in X and Y, respectively. Values of these parameters approaching 1.0 indicate a stable model with predictive reliability). Additionally, permutation tests with 200 random permutations were performed to further confirm that the constructed OPLS-DA model was valid and not over-fitted. The permutation test was used to estimate the validity of the OPLS model. This test consists of comparing the _Q_2 values obtained for the original dataset with the distribution of _Q_2 values calculated when the original Y values are randomly assigned to the individuals. The permutation test showed that the original _R_2 and _Q_2 values (top right) were significantly higher than the corresponding permuted values (bottom left) (Fig. 3D). This demonstrated that the OPLS-DA model was not over-fitted. To further illustrate the validity of OPLS-DA, the _p_-values of _R_2 and _Q_2 from the permutation test were provided (_pR_2 = 0.015, _pQ_2 = 0.005). This demonstrated the robustness and validation of the OPLS-DA model. These analyses suggested a pronounced overall metabolic difference in the hypothalamus in LPS mice.
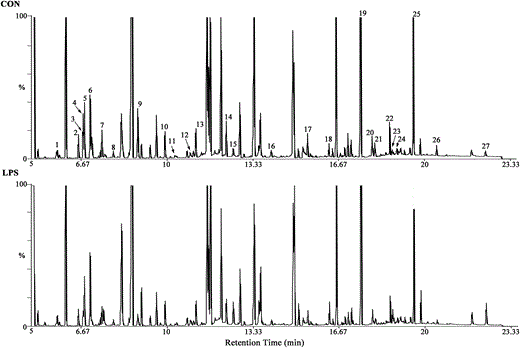
Fig. 2
Representative GC-MS total ion chromatograms (TIC) of the CON group and LPS group. Corresponding peaks indicating differentially expressed metabolites based on retention time are marked with Arabic numbers. (1) 3-Aminoisobutanoic acid; (2) epsilon-caprolactam (ε-caprolactam); (3) l-histidine; (4) l-alanine; (5) hydroxylamine; (6) _N_-methylhydantoin; (7) gamma-aminobutyric acid (GABA); (8) urea; (9) l-proline; (10) l-threonine; (11) l-aspartic acid; (12) l-glutamine; (13) niacinamide; (14) l-cysteine; (15) succinic acid; (16) l-dopa; (17) hypoxanthine; (18) phytosphingosine; (19) myo-inositol; (20) synephrine; (21) pipecolic acid; (22) l-tryptophan; (23) vanillylmandelic acid; (24) gentisic acid; (25) inosine; (26) guanosine; and (27) adenosine 5′-monophosphate (AMP). CON, control group; LPS, LPS-induced depressed group.
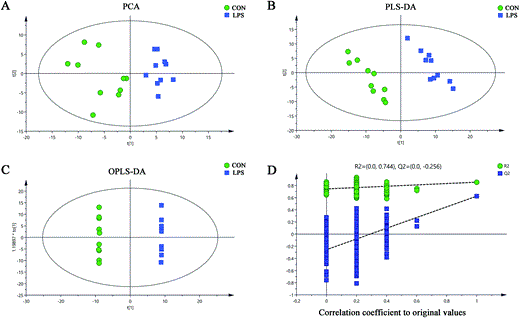
Fig. 3
Multivariate statistical analysis based on GC-MS spectral data of hypothalamus samples obtained from LPS mice and controls. The GC-MS spectral data were introduced into SIMCA-P 14.0 (Umetrics, Umeå, Sweden) for principal component analysis (PCA), partial least squares-discriminant analysis (PLS-DA), and orthogonal partial least squares-discriminant analysis (OPLS-DA). (A) PCA was carried out to investigate whether the LPS-induced depressive group (LPS, blue diamonds) can be separated from the control group (CON, green dots) and to discern their metabolic distinctions by visual inspection of score plots. (B and C) PLS-DA and OPLS-DA, two multivariable statistical methods, were performed to sharpen the already established separation between the groups plotted in PCA, respectively. (D) Statistical validation of the OPLS-DA model by permutation tests with 200 random permutations. CON, control group; LPS, LPS-induced depressed group.
According to the OPLS-DA analysis, the significant differential metabolites between the LPS group and control group are summarized in Table 1. A total of 27 metabolites showed significant differential expression in the hypothalamus of LPS mice. Among these, seventeen metabolites decreased, whereas ten metabolites increased in mice with LPS-induced depression relative to those in controls. Heat map visualization of the differential metabolomics data showed distinct segregation between the control and mice with LPS-induced depression (Fig. 4).
Table 1
Key differential metabolites detected by gas chromatography-mass spectrometry (GC-MS) for LPS/CON
| No. | Metabolite | KEGG ID | Mass | RT (min) | VIPa | FCb | _p_-Valuea | Metabolic pathways |
|---|---|---|---|---|---|---|---|---|
| 1 | l-Histidine | C00135 | 154 | 6.46 | 2.32 | −1.36 | 2.77 × 10⁻⁵ | Amino acid metabolism |
| 2 | l-Cysteine | C00097 | 221 | 12.02 | 1.11 | −1.05 | 1.15 × 10⁻⁶ | Amino acid metabolism |
| 3 | l-Tryptophan | C00078 | 202 | 18.10 | 2.13 | −0.87 | 9.59 × 10⁻² | Amino acid metabolism |
| 4 | 3-Aminoisobutanoic acid | C05145 | 102 | 5.70 | 4.19 | −0.72 | 3.86 × 10⁻⁴ | Amino acid metabolism |
| 5 | l-Aspartic acid | C00049 | 172 | 10.30 | 1.42 | −0.66 | 3.60 × 10⁻⁴ | Amino acid metabolism |
| 6 | GABA | C00334 | 142 | 7.08 | 2.75 | −0.62 | 1.15 × 10⁻² | Amino acid metabolism |
| 7 | l-Alanine | C00041 | 116 | 6.55 | 3.23 | −0.40 | 2.00 × 10⁻⁶ | Amino acid metabolism |
| 8 | l-Proline | C00148 | 142 | 8.89 | 1.15 | −0.19 | 1.66 × 10⁻³ | Amino acid metabolism |
| 9 | Succinic acid | C00042 | 129 | 12.22 | 2.16 | 1.90 | 2.99 × 10⁻³ | Amino acid metabolism |
| 10 | _N_-Methylhydantoin | C02565 | 116 | 6.79 | 2.03 | 0.46 | 3.50 × 10⁻⁴ | Amino acid metabolism |
| 11 | l-Threonine | C00188 | 73 | 9.91 | 1.86 | 0.18 | 1.44 × 10⁻⁴ | Amino acid metabolism |
| 12 | l-Glutamine | C00064 | 155 | 10.96 | 3.13 | 0.54 | 1.15 × 10⁻² | Amino acid metabolism, purine metabolism |
| 13 | Inosine | C00294 | 281 | 19.56 | 1.10 | −1.11 | 2.42 × 10⁻⁵ | Purine metabolism |
| 14 | Guanosine | C00387 | 281 | 20.46 | 1.09 | −0.88 | 7.72 × 10⁻¹⁰ | Purine metabolism |
| 15 | Hypoxanthine | C00262 | 84 | 15.27 | 1.17 | −0.59 | 3.71 × 10⁻⁹ | Purine metabolism |
| 16 | AMP | C00020 | 211 | 22.36 | 1.06 | 1.27 | 4.69 × 10⁻⁵ | Purine metabolism |
| 17 | Urea | C00086 | 189 | 8.09 | 3.79 | 0.49 | 2.41 × 10⁻² | Purine metabolism |
| 18 | Gentisic acid | C00628 | 145 | 18.80 | 2.07 | −3.37 | 7.06 × 10⁻³ | Tyrosine metabolism |
| 19 | l-Dopa | C00355 | 218 | 14.01 | 2.55 | −2.00 | 1.44 × 10⁻⁶ | Tyrosine metabolism |
| 20 | Vanillylmandelic acid | C05584 | 299 | 18.56 | 1.01 | 1.17 | 9.50 × 10⁻⁶ | Tyrosine metabolism |
| 21 | Myo-inositol | C00137 | 192 | 17.51 | 2.69 | 0.19 | 9.00 × 10⁻³ | Lipid metabolism |
| 22 | Phytosphingosine | C12144 | 191 | 16.17 | 1.02 | 0.95 | 2.40 × 10⁻⁷ | Lipid metabolism |
| 23 | Niacinamide | C00153 | 179 | 11.02 | 1.11 | −0.27 | 2.31 × 10⁻⁴ | Nicotinate and nicotinamide metabolism |
| 24 | Pipecolic acid | C00408 | 157 | 17.83 | 1.67 | −1.25 | 8.30 × 10⁻⁵ | Others |
| 25 | ε-Caprolactam | C06593 | 68 | 6.33 | 1.87 | −1.94 | 3.76 × 10⁻⁴ | Others |
| 26 | Synephrine | C04548 | 150 | 17.63 | 1.56 | −1.36 | 1.59 × 10⁻⁴ | Others |
| 27 | Hydroxylamine | C00192 | 133 | 6.76 | 2.24 | 1.43 | 5.25 × 10⁻³ | Others |
a Only metabolites with variable importance in their projection (VIP) values greater than 1.0 and _p_-values less than 0.05 were deemed statistically significant. _p_-Value from two-tailed Student's _t_-test.
b Fold change (FC) was calculated as the logarithm of the average mass response (area) ratio between the two classes (i.e., FC = log 2[LPS/CON]). Thus, positive fold change values indicate significantly higher levels in LPS relative to CON mice, and negative fold change values indicate significantly lower levels in LPS relative to CON mice. KEGG, kyoto encyclopedia of genes and genomes; RT, retention time; AMP, adenosine 5′-monophosphate; GABA, gamma-aminobutyric acid; ε-caprolactam, epsilon-caprolactam. CON, control group; LPS, LPS-induced depressed group.
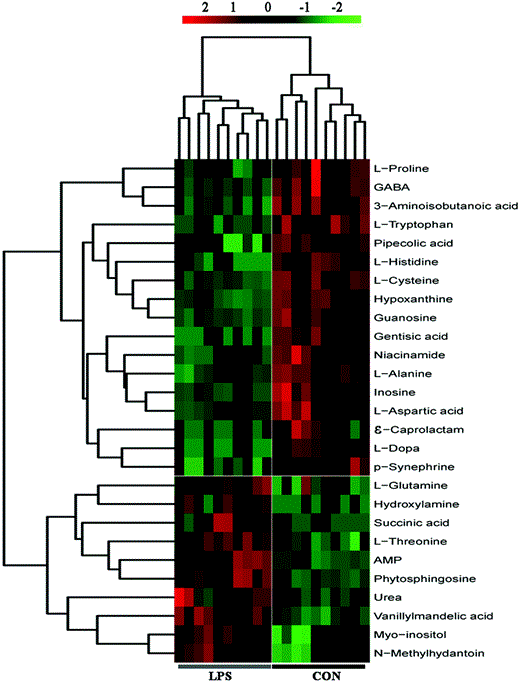
Fig. 4
Heatmap visualization of metabolomics data for the hypothalamus. The heatmap was plotted based on the levels of the differential metabolites. The heatmap data were normalized by rescaling between −2 and 2. Distinct separation was observed between control and LPS depressed mice. Rows: Metabolites; columns: samples. The color key indicates the metabolite expression value: red, highest; green, lowest. GABA, gama-aminobutyric acid; AMP, adenosine 5′-monophosphate; ε-caprolactam, epsilon-caprolactam; CON, control group; LPS, LPS-induced depressed group.
3.3 Classification of metabolites
To obtain better insight into the biological functions of the molecules of interest among the 27 identified metabolites, the Human Metabolome Database (HMDB), the Kyoto Encyclopedia of Genes and Genomes (KEGG), and the PubChem Database (PCDB) were used for annotations of differential metabolites. A detailed classification based on biochemical features, cellular locations, and biological functions was performed. The metabolites were clustered and visualized by the Enrichment Map in Cytoscape (Fig. 5). Using the HMDB, KEGG, and PCDB to classify the functional categories, the analysis data showed that the differently expressed metabolites in LPS mice were located in extracellular, cytoplasm, mitochondria, and lysosome cellular locations. Most of the metabolites were sub-grouped as amino acids, peptides, and analogs, nucleosides, nucleotides, and analogs, and organic carbonic acids and derivatives. In terms of biofunctional distribution, these metabolites mainly participated in amino acid, purine, and nitrogen metabolisms, among others.
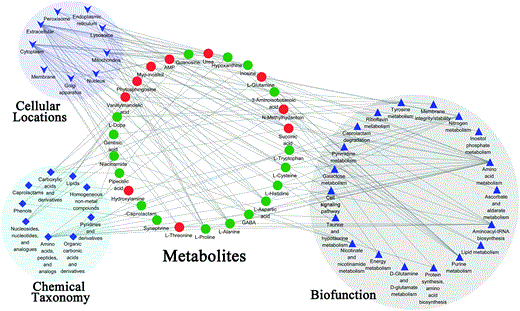
Fig. 5
Enrichment map depicting the classification of potential metabolites in LPS mice as compared to that in controls. Schematic of metabolites in terms of cellular locations, chemical taxonomy, and biofunctions based on the annotations of HMDB, KEGG, and PCDB. Metabolites in red were noted to increase in the hypothalamus of LPS mice, and metabolites in green were noted to decrease. Nodes from the same functional category are shown with the same shape and background color.
3.4 Perturbed metabolic pathways in response to LPS
The GC-MS-based metabolomic studies indicated that the metabolic profile of the LPS-treated mice deviated from that of the control group, suggesting that hypothalamic biochemical changes occurred in the mice with LPS-induced depression. To verify the biological processes and molecular pathways among the identified potential biomarkers, a comprehensive metabolic network of LPS-induced depression was mapped using the MetaboAnalyst tool. At First, metabolite set enrichment analysis was implemented to discern whether differential metabolite sets were associated with particular biological functions under LPS treatment (Fig. 6A). Protein biosynthesis, the urea cycle, purine metabolism, ammonia recycling, and glutamate metabolism were the most representative biological processes. Second, pathway analysis was performed as an extension of the metabolite set enrichment analysis to obtain better understanding of the pathways involved. The impact value of the pathways calculated from pathway topology analysis was applied to evaluate the impact of relevant pathways in LPS-induced depression (Table 2). We have identified several pathways that may be aberrant in mice with LPS-induced depression. The data showed that amino acid metabolism, purine metabolism, and tyrosine metabolism were primarily involved in metabolite perturbation in the hypothalamus. The pathway analysis results are shown in Table 2 with a pathway summary (Fig. 6B). The four most significantly different KEGG metabolic pathways are (1) aminoacyl-tRNA biosynthesis; (2) alanine, aspartate, and glutamate metabolism; (3) arginine and proline metabolism, and (4) purine metabolism. The top three metabolic pathways with differentially expressed metabolites are amino acid metabolism, peptide metabolism, and analog metabolism. Aspartic acid, gama-aminobutyric acid (GABA), tryptophan, proline, histidine, alanine, and cysteine decreased significantly in the LPS-treated mice, whereas glutamine, threonine, _N_-methylhydantoin, urea, and succinic acid increased significantly (Table 1). GABA/glutamate and glycine/aspartic acid are important inhibitory/excitatory neurotransmitter pairs. Our present study showed that the levels of aspartic acid and GABA significantly decreased in the hypothalamus of LPS mice, whereas the levels of glutamate and glycine showed no difference. This indicates that an imbalance of excitatory/inhibitory neurotransmitters may result in neurobehavioral abnormalities and account for impaired hypothalamus function under LPS treatment. Differential metabolites (glutamine, adenosine 5′-monophosphate (AMP), inosine, hypoxanthine, guanosine, and urea) are involved in purine metabolism. Moreover, three metabolites, l-dopa, vanillylmandelic acid, and gentisic acid, are involved in the tyrosine metabolism of catecholaminergic pathways. According to the data analysis of metabolic profiling, metabolic disturbances occurred in the hypothalamus of mice with LPS-induced depression, particularly in amino acid metabolism, purine metabolism, and tyrosine metabolism.
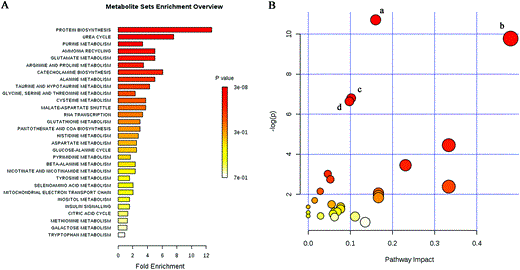
Fig. 6
Implication of metabolites in biological processes and metabolism pathways by MetaboAnalyst 3.0. (A) The metabolite set enrichment analysis was implemented to discern differential metabolite sets associated with biological processes under LPS treatment. Protein biosynthesis was the most representative biological process. (B) Summary of metabolism pathway analysis. (a) Aminoacyl-tRNA biosynthesis. (b) Alanine, aspartate, and glutamate metabolism. (c) Arginine and proline metabolism. (d) Purine metabolism.
Table 2
Significantly altered pathways in LPS mice from MetaboAnalyst 3.0
| KEGG pathway | Total | Expected | Hits | −log (p) | FDR | Impact | Metabolites |
|---|---|---|---|---|---|---|---|
| mmu00970 | 69 | 1.31 | 8 | 1.07 × 101 | 1.83 × 10⁻³ | 1.60 × 10⁻¹ | l-Histidine, l-cysteine, l-aspartic acid, l-alanine, l-tryptophan, l-proline, l-glutamine, l-threonine |
| mmu00250 | 24 | 0.46 | 5 | 9.78 × 10 | 2.32 × 10⁻³ | 4.80 × 10⁻¹ | l-Aspartic acid, l-alanine, GABA, l-glutamine, succinic acid |
| mmu00330 | 44 | 0.84 | 5 | 6.80 × 10 | 2.67 × 10⁻² | 1.02 × 10⁻¹ | l-Aspartic acid, l-proline, GABA, urea, l-glutamine |
| mmu00230 | 68 | 1.30 | 6 | 6.64 × 10 | 2.67 × 10⁻² | 9.78 × 10⁻² | Inosine, hypoxanthine, guanosine, l-glutamine, AMP, urea |
| mmu00910 | 9 | 0.17 | 2 | 4.46 × 10 | 1.90 × 10⁻¹ | 3.33 × 10⁻¹ | l-Histidine, l-glutamine |
| mmu00340 | 15 | 0.29 | 2 | 3.46 × 10 | 4.31 × 10⁻¹ | 2.31 × 10⁻¹ | l-Histidine, l-aspartic acid |
| mmu00350 | 44 | 0.84 | 3 | 3.02 × 10 | 5.69 × 10⁻¹ | 4.65 × 10⁻² | Gentisic acid, l-dopa, vanillylmandelic acid |
Based on the correlation between the metabolic pathways, we integrated the most significant pathways (amino acid and purine metabolisms) into a brief plot that included most of the altered metabolites. As shown in Fig. 7, almost half of the 27 identified metabolites were revealed to be involved in disorders of the amino acid metabolisms involved in the tricarboxylic acid (TCA) cycle. Moreover, six metabolites participate in purine metabolism, which is closely associated with amino acid metabolism. Glutamine is a key connection in the integrated brief plot of the metabolic pathways; it is simultaneously involved in both amino acid and purine metabolism. Moreover, glutamine plays a vital role in glutamatergic neurotransmission by acting as a shuttle between neurons and astrocytes in the glutamine–glutamate cycle. A significant augmentation in the level of glutamine was observed in the hypothalamus of LPS mice. This implies that purinergic system dysfunction and imbalance of the glutamatergic system may experience communication through glutamine in depression. The abovementioned data demonstrate that hypothalamus of LPS-induced depressive-like mice has metabolic disturbances, notably involving disturbances in amino acid metabolism and purine metabolism.
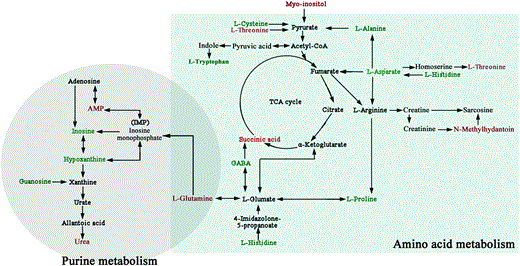
Fig. 7
An overview of the hypothalamic metabolic pathways, including amino acid metabolism and purine metabolism, related to LPS-induced depression. Red-labeled metabolites show increased levels in the hypothalamus of LPS-induced depressive-like mice, and blue-labeled metabolites show decreased levels. TCA, tricarboxylic acid; GABA, gama-aminobutyric acid; and AMP, adenosine 5′-monophosphate.
4. Discussion
Depressive disorders are closely associated with neuroinflammatory mechanisms.3,8 In the present study, a metabolomics approach was used to analyze the changes in the hypothalamus of LPS-challenged mice. To the best of our knowledge, this is the first study wherein the differentially expressed metabolites of the hypothalamus in a proinflammation-mediated depression model were comprehensively analyzed by applying a GC-MS based metabolomics approach. We identified 27 unique metabolites that were expressed differentially in the depressive mice and may be related to the pathophysiology of MDD. More specifically, data from bioinformatics analysis demonstrate that the differentially expressed metabolites are involved in amino acid metabolism, purine metabolism, tyrosine metabolism, and lipid metabolism, which are key factors in depression.
4.1. LPS-induced behavioral changes
Depression models that reproduce core pathological features of depression are necessary for the elucidation of molecular mechanisms.37 Accordingly, there are several well-established and recognized animal models of depression such as the chronic unpredictable mild stress (CUMS) model,17 chronic restraint stress (CRS) model,38 chronic social defeat stress (CSDS) model,39 and LPS model.3,8 Compared to the first three models, which are mainly based on social defeat chronic models, the LPS-induced depressive-like model mimics the inflammation-associated depression that is the most common phenotype found in depressive patients. Inflammation-mediated depression, which is often displayed in clinical practice, highlights the role of infections in the pathophysiology of depression.3 Moreover, the effects of neuroinflammatory mechanisms in depression disorders deserve more meticulous exploration. LPS is the major component of the outer membrane of Gram negative bacteria. There is sufficient evidence that confirms that LPS elicits neuroinflammation and depressive-like behaviors.8,14
In this study, we observed depressive-like behaviors in mice by exposing them to LPS stress. Decreased sucrose preference in the SPT and increased immobility detected by FST and TST in the LPS-treated mice indicated aggravated depression-related anhedonia- and despair-like behaviors, respectively. In addition, no significant difference between two experimental groups was observed in the OFT; this suggested that no anxiety co-occurred in our model. The SPT has been interpreted as an appraisal paradigm of anhedonia-like behavior. Blunted sucrose intake in the SPT is proposed to mirror impaired sensitivity to reward and to model anhedonia, namely a blunted interest in rewarding activities that is seen in patients with depression,40 a core symptom of depression. The FST and TST are commonly used to examine depressive-like behaviors and screen potential antidepressant drugs.41 LPS can also evoke weight loss and enhanced immobility, which is thought to reflect helplessness in inescapable situations. Recent studies have assessed LPS-induced depressive like behaviors in mice, which are consistent with our results.8,31 Overall, the LPS-induced depression model has been well established as a reliable animal model of depression and can be used to better investigate the pathophysiological mechanisms underlying depression.8,14,21,42
4.2. Biochemical interpretation for significant pathways and specific metabolites
Among these identified metabolites, almost half of 27 metabolites were revealed to be involved in amino acid metabolism, which contribute to the most significant alterations. The altered amino acid profile is noteworthy in light of previous studies that have suggested that the synthesis of brain neurotransmitters related to MDD pathogenesis can be affected by the circulating amino acid levels.28 In the present study, some amino acids, including GABA, aspartic acid, histidine, cysteine, alanine, tryptophan, and proline, were markedly reduced in the hypothalamus of LPS mice. Additionally, six metabolites participate in purine metabolism, which is closely associated with the amino acid metabolism. Glutamine is a key connector. The results of additional pathway analysis for these differentially expressed metabolites associated with amino acid metabolism and purine metabolism were integrated into a brief plot to provide a systematic overview (Fig. 7). The plot revealed that LPS induced pathogenic effects via the downstream pathways associated with amino acid metabolism that are mainly characterized by disturbed alanine, aspartate, and glutamate metabolism, arginine and proline metabolism, tryptophan metabolism, and histidine metabolism. Moreover, perturbations of the tyrosine metabolism and lipid metabolism appear to be involved.
4.2.1. Amino acid metabolism
Several lines of evidence have indicated that the pathophysiology of depression is associated with dysfunctional glutamatergic and GABAergic neurotransmitter systems in the brain of patients with MDD and in animal models of depression.21,43,44 GABA and glutamate, the important neurotransmitters involved in the glutamate/GABA–glutamine cycle in CNS,45 are considered to be potential biomarkers of depression.10 GABA and glutamate are inhibitory and excitatory neurotransmitters, respectively. They are paired to achieve a subtle equilibration of excitatory and inhibitory neurotransmitters. An imbalance of GABA and glutamate may cause mood disorders.46 Herein, our studies showed that the levels of the inhibitory neurotransmitter GABA were decreased in the hypothalamus of LPS mice; however, we observed no difference in glutamate production. This may be indicative of LPS-induced dysfunction in glutamate/GABA–glutamine neurotransmitter cycling. Similarly, a hypothalamic proteomic study of CUMS depressive mice also exhibited dramatic protein changes in glutamate metabolism.17 Our previous study delineated increased GABA and decreased glutamate in the prefrontal cortex of LPS mice.21 Veeraiah et al.43 and Banasr et al.47 suggested that GABA and glutamate were decreased in the prefrontal cortex of a depression model based on social defeat stress. Moreover, abnormal levels of glutamate or GABA have been noted in the serum, plasma, peripheral blood mononuclear cells, CSF, and brain tissue of depressed patients.10 However, interpretation of glutamate and GABA levels in different biosamples is challenging due to confounds such as drug treatment, postmortem metabolic effects, and the inability to distinguish the source of glutamate or GABA (CNS vs. peripheral system). A further systematic study is needed to integrate the variations of glutamatergic and GABAergic neurotransmitter systems of depression. Furthermore, glycine and aspartic acid are the other important inhibitory/excitatory molecules.26 Our present study showed that aspartic acid, a major excitatory amino acid neurotransmitter, was significantly decreased in the hypothalamus of LPS mice. The intensity of glycine was comparable between the LPS mice and control mice. These findings suggest that an imbalance of excitatory/inhibitory neurotransmitters may result in neurobehavioral abnormalities and may account for impaired hypothalamus function.
Glutamine acts as a shuttle to maintain the equilibrium of the glutamine–glutamate cycle between neurons and astrocytes.45 Glutamine might be a potential biomarker for the diagnosis of depression.10 Herein, a significant augmentation in the level of glutamine was observed in the hypothalamus of LPS mice. Glutamine was also increased in the prefrontal cortex of LPS mice.21 However, glutamine was significantly decreased in the plasma of depressed patients.28 The discrepant distribution of glutamine might suggest the presence of different signal regulating pathways in the CNS and peripheral blood stream.
Alteration of tryptophan catabolism elicited by proinflammatory cytokines is attracting attention as a new standpoint to explain the pathophysiological mechanisms of major depression.3,8 Tryptophan is a major precursor of 5-hydroxytryptamine (5-HT, serotonin), a monoamine neurotransmitter. Serotonin synthesis has been found to be positively correlated with the circulating tryptophan levels, which are regulated by glucocorticoids produced along the HPA axis.48 A decrease in peripheral tryptophan concentration was reported in patients with depression and in animal models of depression.8,25,49 A significant reduction of tryptophan was reported in the hippocampus and striatum of the CUMS model,50 whereas no difference was found in the prefrontal cortex of the LPS depression model.21 Herein, decreased level of tryptophan was observed in the hypothalamus of LPS mice; this might indicate a disturbance in the release of hypothalamus serotonin that was highly related to the LPS challenge. This inconsistency of tryptophan in different brain areas, as well as in the CNS versus peripheral blood, may be due to a disparate sensitivity to different stressors. Moreover, it is possible that the interaction between tryptophan catabolism and HPA axis activity in the hypothalamus is different from that in other brain regions. Subsequent studies are required to elucidate this effect. The levels of alanine, proline, cysteine, and histidine were decreased in the hypothalamus in our study. Alanine could be an indicator for evaluating the severity of MDD.51 Alanine can be converted into pyruvate, a source of acetyl-CoA, which is the main importer in the TCA cycle. The decrease of alanine may be the result of reduced levels of gluconeogenesis under LPS stress and suggests the existence of an energy metabolism disorder. Proline, synthesized from glutamate, has a vital role in attenuating the stress response in the CNS52 and can remodel astrocytes and protect neurons against oxidative stress.53 Proline was decreased in the prefrontal cortex of the CRS depressive rats,38 consistent with our present study. Similarly, cysteine is a crucial limiting amino acid for intracellular synthesis of the antioxidant glutathione; it is also involved in antioxidative processes. Histidine suppresses expression of proinflammatory cytokines via the nuclear factor kappa-B pathway.54 Herein, the reduction of hypothalamic proline, cysteine, and histidine may be due to resistance to LPS-induced disorders of inflammation or oxidative stress.
The abovementioned table shows detailed results from the pathway analysis. Because we tested many pathways at the same time, the statistical _p_-values from enrichment analysis are further adjusted for multiple tests. In particular, total is the total number of compounds in the pathway; Hits is the actual matched number from the user-uploaded data; FDR is the p value adjusted using the false discovery rate; and impact is the pathway impact value calculated from pathway topology analysis. mmu00970, aminoacyl-tRNA biosynthesis; mmu00250, alanine, aspartate and glutamate metabolism; mmu00330, arginine and proline metabolism; mmu00230, purine metabolism; mmu00910, nitrogen metabolism; mmu00340, histidine metabolism; mmu00350, tyrosine metabolism; GABA, gama-aminobutyric acid; AMP, adenosine 5′-monophosphate.
As abovementioned, amino acid metabolism disorders were the most noticeable perturbations in the hypothalamus of LPS-induced depressive-like mice and might be closely linked to behavioral abnormities in depression.
4.2.2. Purine metabolism
Studies have manifested that purinergic system dysfunction is involved in the pathology of mood disorders such as MDD, schizophrenia, anxiety, and bipolar disorder. Evidence also supports that the effects of some purinergic molecules are implicated in pathologic features of depression.55 In our study, we found that a panel of metabolites, i.e. glutamine, inosine, guanosine, hypoxanthine, AMP, and urea, of the purine metabolism was significantly disturbed in the LPS mice. Inosine, guanosine, and hypoxanthine were significantly decreased in the hypothalamus of the LPS group. Similarly, Liu et al. have suggested that the inosine level is reduced in the prefrontal cortex of CRS-treated depressed rats.38 Inosine is a purine nucleoside that is formed by the breakdown of adenosine; it has anti-inflammation and neuroprotective properties.56 Increasing evidence has demonstrated that inosine elicits an antidepressant-like effect in mice through activation of adenosine A1 and A2A receptors.57 Although we found no distinct difference in adenosine in our study, Kaster et al. demonstrated that adenosine also had antidepressant potency.58 Simultaneously, guanosine is a purine nucleoside with neuroprotective effects, which has been shown to be protective in several experimental models of CNS diseases including MDD. Guanosine is excreted in the brain under pathological events, attenuating neuroinflammation, oxidative stress, and excitotoxicity; it also performs trophic functions in neuronal and glial cells.59 In addition, inosine and hypoxanthine stimulation induces anxious behaviors in rats by acting on the benzodiazepine receptor.55 Based on these reports and our results, we speculate that changes in purinergic systems may mitigate depressive symptoms; however, further research is required to clarify the mechanisms and specific targets involved in these effects. Moreover, in this study, the levels of AMP and urea were markedly increased in the hypothalamus of LPS mice relative to those in the control mice. Overall, these findings corroborate previous reports stating that purinergic system dysfunction is involved in the pathophysiology of depression.
Interestingly, glutamine is an important connector in the integrated brief plot of amino acid metabolism and purine metabolism (Fig. 7). This implies that purinergic system dysfunction and imbalance of glutamate/GABA–glutamine neurotransmitters communicate through glutamine in depression. However, further research is required to further corroborate this finding.
4.2.3. Other metabolism
The significant decreases in l-dopa and gentisic acid and the increase in vanillylmandelic acid in the hypothalamus of the LPS group as compared to that in the controls were also responsible for the perturbation of metabolic profiles. These three metabolites are involved in the tyrosine metabolism of catecholaminergic pathways.60 Recently, an investigation of Parkinson's disease suggested that l-dopa could interact with the serotonergic system in mood-regulated brain circuits while giving rise to depression-related symptoms.4,39 The decrease of l-dopa in LPS mice can lead to depressive-like performance. Vanillylmandelic acid, a major metabolite of norepinephrine, was reported to be found in the urine of patients with psychiatric disorders.39,61 Moreover, an increasing amount of evidence indicates that gentisic acid, a byproduct of tyrosine metabolism, has anti-inflammatory and antioxidant properties.62 At present, its functions in depression are unclear.
Augmented myo-inositol, a byproduct of membrane-bound phospholipid metabolism and an important player in the phosphoinositide secondary messenger pathway, was observed in the hypothalamus of the LPS mice as compared to that of the controls. Consistent with our findings, a post-mortem study on patients with bipolar disorder showed elevated brain myo-inositol levels.63 This feature may be a result of higher myo-inositol uptake or retention, changed production in the cellular or extracellular matrix, or disturbance of the coupling mechanism in the receptor-secondary messenger system complex.64
There are several limitations that should be pointed out herein. First, in the present study, the primary limitation is that the sample sizes are relatively small; this may restrict the explanation of the results. Second, only hypothalamic metabolite signatures have been identified and discussed in LPS-induced depressive mice. Therefore, subsequent studies using other brain regions (e.g., the hippocampus, prefrontal cortex, and striatum) that have been linked to depression are needed to further analyze CNS-based metabolite changes. Third, irrespective of the unique advantages of any particular methodology, no single metabolomic platform can provide adequate coverage of the entire metabolome in any given biological sample. Although GC-MS achieves good performance,22 it cannot detect some low-polar metabolites; a combination of GC-MS with other metabolomics approaches (e.g., LC-MS, NMR) will be carried out in the subsequent research. Finally, the hypothalamic protein changes in LPS mice are temporarily unknown. The integration of multi-omics (e.g., proteomics, metabolomics, and transcriptomics) data can yield more information, which is beneficial to a profound and comprehensive understanding of the pathophysiology of depression.
5. Conclusions
In conclusion, employing a GC-MS metabolomic method, we have found that hypothalamus metabolic profiling has great potential in differentiating LPS-induced depression. Our study has revealed that the amino acid metabolism and purine metabolism are the most significant metabolite perturbations involved in inflammation-mediated depression. Hereinto, biomarkers of excitatory/inhibitory neurotransmitters and the purinergic system may contribute to the clinical diagnosis of depression and may become potential targets for antidepressants. These metabolic disturbances in the hypothalamus in LPS-induced depression may provide insights into the mechanisms underlying inflammation-related depression.
Author contributions
Xiaoling Gao and Yu Wu conceived and designed the experiments; Yu Wu, Yonghong Li, Yanjuan Jia, Chaojun Wei and Xu Hui performed the experiments; Yuanting Li and Xiaoming Qi analyzed the data; Jing Jia and Rui Guo contributed reagents/materials/analysis tools; and Xiaoling Gao and Yu Wu wrote the paper and supervised the project. All authors accepted the final version of the manuscript.
Conflicts of interest
There are no conflicts of interest to declare.
Acknowledgements
This work was supported by the Health Industry Research Project of Gansu Province (grant no. GSWSKY2017-16) and the National Natural Science Foundation (grant no. 81360264 and 31360508). We thank Prof. Guang Zheng (Lanzhou University) for partial bioinformatics analysis, and Shisheng Wang and his ‘Wu Kong’ platform for partial analysis of the OPLS-DA methods.
References
1
R. C.
Kessler
,
P.
Berglund
,
O.
Demler
,
R.
Jin
,
D.
Koretz
,
K. R.
Merikangas
,
A. J.
Rush
,
E. E.
Walters
,
P. S.
Wang
,
JAMA
,
2003
,
289
,
3095
-
3105
.
2
C.
Otte
,
S. M.
Gold
,
B. W.
Penninx
,
C. M.
Pariante
,
A.
Etkin
,
M.
Fava
,
D. C.
Mohr
,
A. F.
Schatzberg
,
Nat. Rev. Dis. Primers
,
2016
,
2
,
16065
.
3
R.
Dantzer
,
J. C.
O'Connor
,
G. G.
Freund
,
R. W.
Johnson
,
K. W.
Kelley
,
Nat. Rev. Neurosci.
,
2008
,
9
,
46
-
56
.
4
N.
Gordon
,
G.
Goelman
,
Behav. Brain Res.
,
2016
,
296
,
141
-
148
.
5
H.
Yin
,
S. P.
Pantazatos
,
H.
Galfalvy
,
Y. Y.
Huang
,
G. B.
Rosoklija
,
A. J.
Dwork
,
A.
Burke
,
V.
Arango
,
M. A.
Oquendo
,
J. J.
Mann
,
Am. J. Med. Genet., Part B
,
2016
,
171B
,
414
-
426
.
6
M. L.
Wong
,
A.
Inserra
,
M. D.
Lewis
,
C. A.
Mastronardi
,
L.
Leong
,
J.
Choo
,
S.
Kentish
,
P.
Xie
,
M.
Morrison
,
S. L.
Wesselingh
,
G. B.
Rogers
,
J.
Licinio
,
Mol. Psychiatry
,
2016
,
21
,
797
-
805
.
7
H. K.
Kim
,
P. V.
Nunes
,
K. C.
Oliveira
,
L. T.
Young
,
B.
Lafer
,
Prog. Neuro-Psychopharmacol. Biol. Psychiatry
,
2016
,
67
,
51
-
57
.
8
J. C.
O'Connor
,
M. A.
Lawson
,
C.
Andre
,
M.
Moreau
,
J.
Lestage
,
N.
Castanon
,
K. W.
Kelley
,
R.
Dantzer
,
Mol. Psychiatry
,
2009
,
14
,
511
-
522
.
9
D. R.
Goldsmith
,
M. H.
Rapaport
,
B. J.
Miller
,
Mol. Psychiatry
,
2016
,
21
,
1696
-
1709
.
10
A.
Gururajan
,
G.
Clarke
,
T. G.
Dinan
,
J. F.
Cryan
,
Neurosci. Biobehav. Rev.
,
2016
,
64
,
101
-
133
.
11
C. L.
Raison
,
A. S.
Borisov
,
B. J.
Woolwine
,
B.
Massung
,
G.
Vogt
,
A. H.
Miller
,
Mol. Psychiatry
,
2010
,
15
,
535
-
547
.
12
W. K.
Jo
,
Y.
Zhang
,
H. M.
Emrich
,
D. E.
Dietrich
,
Front. Cell. Neurosci.
,
2015
,
9
,
268
.
13
R. A.
Khairova
,
R.
Machado-Vieira
,
J.
Du
,
H. K.
Manji
,
Int. J. Neuropsychopharmacol.
,
2009
,
12
,
561
-
578
.
14
M.
Adzic
,
J.
Djordjevic
,
M.
Mitic
,
Z.
Brkic
,
I.
Lukic
,
M.
Radojcic
,
Behav. Brain Res.
,
2015
,
291
,
130
-
139
.
15
K.
Mizoguchi
,
A.
Ishige
,
M.
Aburada
,
T.
Tabira
,
Neuroscience
,
2003
,
119
,
887
-
897
.
16
T.
Frodl
,
F.
Amico
,
Prog. Neuro-Psychopharmacol. Biol. Psychiatry
,
2014
,
48
,
295
-
303
.
17
C.
Rao
,
H.
Shi
,
C.
Zhou
,
D.
Zhu
,
M.
Zhao
,
Z.
Wang
,
Y.
Yang
,
J.
Chen
,
L.
Liao
,
J.
Tang
,
Y.
Wu
,
J.
Zhou
,
K.
Cheng
,
P.
Xie
,
Neurochem. Res.
,
2016
,
41
,
2443
-
2456
.
18
P. H.
Black
,
Brain, Behav., Immun.
,
2002
,
16
,
622
-
653
.
19
J.
Savitz
,
M. B.
Frank
,
T.
Victor
,
M.
Bebak
,
J. H.
Marino
,
P. S.
Bellgowan
,
B. A.
McKinney
,
J.
Bodurka
,
T.
Kent Teague
,
W. C.
Drevets
,
Brain, Behav., Immun.
,
2013
,
31
,
161
-
171
.
20
K.
Noonan
,
L. M.
Carey
,
S. G.
Crewther
,
J. Stroke Cerebrovasc. Dis.
,
2013
,
22
,
e124
-
e135
.
21
Y.
Wu
,
Y.
Fu
,
C.
Rao
,
W.
Li
,
Z.
Liang
,
C.
Zhou
,
P.
Shen
,
P.
Cheng
,
L.
Zeng
,
D.
Zhu
,
L.
Zhao
,
P.
Xie
,
Behav. Brain Res.
,
2016
,
308
,
115
-
127
.
22
Y.
Simon-Manso
,
M. S.
Lowenthal
,
L. E.
Kilpatrick
,
M. L.
Sampson
,
K. H.
Telu
,
P. A.
Rudnick
,
W. G.
Mallard
,
D. W.
Bearden
,
T. B.
Schock
,
D. V.
Tchekhovskoi
,
N.
Blonder
,
X.
Yan
,
Y.
Liang
,
Y.
Zheng
,
W. E.
Wallace
,
P.
Neta
,
K. W.
Phinney
,
A. T.
Remaley
,
S. E.
Stein
,
Anal. Chem.
,
2013
,
85
,
11725
-
11731
.
23
A. H.
Emwas
,
Z. A.
Al-Talla
,
Y.
Yang
,
N. M.
Kharbatia
,
Methods Mol. Biol.
,
2015
,
1277
,
91
-
112
.
24
J.
Li
,
G.
Tang
,
K.
Cheng
,
D.
Yang
,
G.
Chen
,
Z.
Liu
,
R.
Zhang
,
J.
Zhou
,
L.
Fang
,
Z.
Fang
,
X.
Du
,
P.
Xie
,
Mol. BioSyst.
,
2014
,
10
,
2994
-
3001
.
25
Z. Y.
Li
,
X. Y.
Zheng
,
X. X.
Gao
,
Y. Z.
Zhou
,
H. F.
Sun
,
L. Z.
Zhang
,
X. Q.
Guo
,
G. H.
Du
,
X. M.
Qin
,
Rapid Commun. Mass Spectrom.
,
2010
,
24
,
3539
-
3546
.
26
Y.
Ni
,
M.
Su
,
J.
Lin
,
X.
Wang
,
Y.
Qiu
,
A.
Zhao
,
T.
Chen
,
W.
Jia
,
FEBS Lett.
,
2008
,
582
,
2627
-
2636
.
27
P.
Zheng
,
Y.
Wang
,
L.
Chen
,
D.
Yang
,
H.
Meng
,
D.
Zhou
,
J.
Zhong
,
Y.
Lei
,
N. D.
Melgiri
,
P.
Xie
,
Mol. Cell. Proteomics
,
2013
,
12
,
207
-
214
.
28
P.
Zheng
,
H. C.
Gao
,
Q.
Li
,
W. H.
Shao
,
M. L.
Zhang
,
K.
Cheng
,
D. Y.
Yang
,
S. H.
Fan
,
L.
Chen
,
L.
Fang
,
P.
Xie
,
J. Proteome Res.
,
2012
,
11
,
1741
-
1748
.
29
Guide for the Care and Use of Laboratory Animals, National Academy of Sciences, Washington DC, 2011.
30
A.
Franceschelli
,
J.
Sens
,
S.
Herchick
,
C.
Thelen
,
P. M.
Pitychoutis
,
Neuroscience
,
2015
,
290
,
49
-
60
.
31
X.
Zhao
,
F.
Cao
,
Q.
Liu
,
X.
Li
,
G.
Xu
,
G.
Liu
,
Y.
Zhang
,
X.
Yang
,
S.
Yi
,
F.
Xu
,
K.
Fan
,
J.
Ma
,
Behav. Brain Res.
,
2017
32
A.
Luedemann
,
L.
von Malotky
,
A.
Erban
,
J.
Kopka
,
Methods Mol. Biol.
,
2012
,
860
,
255
-
286
.
33
M. N.
Triba
,
L.
Le Moyec
,
R.
Amathieu
,
C.
Goossens
,
N.
Bouchemal
,
P.
Nahon
,
D. N.
Rutledge
,
P.
Savarin
,
Mol. BioSyst.
,
2015
,
11
,
13
-
19
.
34
H.
Song
,
L.
Wang
,
H. L.
Liu
,
X. B.
Wu
,
H. S.
Wang
,
Z. H.
Liu
,
Y.
Li
,
D. C.
Diao
,
H. L.
Chen
,
J. S.
Peng
,
Oncol. Rep.
,
2011
,
26
,
431
-
438
.
35
A.
Baryshnikova
,
Cold Spring Harb. Protoc.
,
2016
,
2016
,
pdbprot077644
.
36
J.
Xia
,
D. S.
Wishart
,
Curr. Protoc. Bioinformatics
,
2016
,
55
,
14.10.11
-
14.10.91
.
37
H. C.
Yan
,
X.
Cao
,
M.
Das
,
X. H.
Zhu
,
T. M.
Gao
,
Neurosci. Bull.
,
2010
,
26
,
327
-
337
.
38
L.
Liu
,
X.
Zhou
,
Y.
Zhang
,
Y.
Liu
,
L.
Yang
,
J.
Pu
,
D.
Zhu
,
C.
Zhou
,
P.
Xie
,
Behav. Brain Res.
,
2016
,
305
,
148
-
156
.
39
W.
Wang
,
H.
Guo
,
S. X.
Zhang
,
J.
Li
,
K.
Cheng
,
S. J.
Bai
,
D. Y.
Yang
,
H. Y.
Wang
,
Z. H.
Liang
,
L.
Liao
,
L.
Sun
,
P.
Xie
,
J. Proteome Res.
,
2016
,
15
,
3784
-
3792
.
40
H.
Anisman
,
K.
Matheson
,
Neurosci. Biobehav. Rev.
,
2005
,
29
,
525
-
546
.
41
C. A.
Bruning
,
F.
Martini
,
S. M.
Soares
,
L.
Savegnago
,
T. B.
Sampaio
,
C. W.
Nogueira
,
J. Psychiatr. Res.
,
2015
,
66-67
,
75
-
83
.
42
J.
Majidi
,
M.
Kosari-Nasab
,
A. A.
Salari
,
Brain Res. Bull.
,
2016
,
120
,
1
-
13
.
43
P.
Veeraiah
,
J. M.
Noronha
,
S.
Maitra
,
P.
Bagga
,
N.
Khandelwal
,
S.
Chakravarty
,
A.
Kumar
,
A. B.
Patel
,
Biol. Psychiatry
,
2014
,
76
,
231
-
238
.
44
J. H.
Krystal
,
G.
Sanacora
,
H.
Blumberg
,
A.
Anand
,
D. S.
Charney
,
G.
Marek
,
C. N.
Epperson
,
A.
Goddard
,
G. F.
Mason
,
Mol. Psychiatry
,
2002
,
7
,
Suppl 1
,
S71
-
80
.
45
L. K.
Bak
,
A.
Schousboe
,
H. S.
Waagepetersen
,
J. Neurochem.
,
2006
,
98
,
641
-
653
.
46
S.
Daniele
,
E.
Da Pozzo
,
M.
Abelli
,
A.
Panighini
,
S.
Pini
,
C.
Gesi
,
L.
Lari
,
A.
Cardini
,
G. B.
Cassano
,
C.
Martini
,
Bipolar Disord.
,
2012
,
14
,
301
-
308
.
47
M.
Banasr
,
G. M.
Chowdhury
,
R.
Terwilliger
,
S. S.
Newton
,
R. S.
Duman
,
K. L.
Behar
,
G.
Sanacora
,
Mol. Psychiatry
,
2010
,
15
,
501
-
511
.
48
F. J. H.
Sorgdrager
,
B.
Doornbos
,
B.
Penninx
,
P.
de Jonge
,
I. P.
Kema
,
J. Affective Disord.
,
2017
,
222
,
32
-
39
.
49
L.
Capuron
,
A.
Ravaud
,
P. J.
Neveu
,
A. H.
Miller
,
M.
Maes
,
R.
Dantzer
,
Mol. Psychiatry
,
2002
,
7
,
468
-
473
.
50
A.
Laugeray
,
J. M.
Launay
,
J.
Callebert
,
A.
Surget
,
C.
Belzung
,
P. R.
Barone
,
Behav. Brain Res.
,
2010
,
210
,
84
-
91
.
51
H.
Mitani
,
Y.
Shirayama
,
T.
Yamada
,
K.
Maeda
,
C. R.
Ashby, Jr.
,
R.
Kawahara
,
Prog. Neuro-Psychopharmacol. Biol. Psychiatry
,
2006
,
30
,
1155
-
1158
.
52
K.
Hamasu
,
K.
Shigemi
,
Y.
Tsuneyoshi
,
H.
Yamane
,
H.
Sato
,
D. M.
Denbow
,
M.
Furuse
,
Amino Acids
,
2010
,
38
,
57
-
64
.
53
S. O.
Loureiro
,
L.
Heimfarth
,
E. B.
Scherer
,
M. J.
da Cunha
,
B. O.
de Lima
,
H.
Biasibetti
,
R.
Pessoa-Pureur
,
A. T.
Wyse
,
Exp. Cell Res.
,
2013
,
319
,
89
-
104
.
54
R. N.
Feng
,
Y. C.
Niu
,
X. W.
Sun
,
Q.
Li
,
C.
Zhao
,
C.
Wang
,
F. C.
Guo
,
C. H.
Sun
,
Y.
Li
,
Diabetologia
,
2013
,
56
,
985
-
994
.
55
R.
Ortiz
,
H.
Ulrich
,
C. A.
Zarate, Jr.
,
R.
Machado-Vieira
,
Prog. Neuro-Psychopharmacol. Biol. Psychiatry
,
2015
,
57
,
117
-
131
.
56
J.
Muto
,
H.
Lee
,
H.
Lee
,
A.
Uwaya
,
J.
Park
,
S.
Nakajima
,
K.
Nagata
,
M.
Ohno
,
I.
Ohsawa
,
T.
Mikami
,
Sci. Rep.
,
2014
,
4
,
4199
.
57
F. M.
Goncalves
,
V. B.
Neis
,
D. K.
Rieger
,
M. W.
Lopes
,
I. A.
Heinrich
,
A. P.
Costa
,
A. L. S.
Rodrigues
,
M. P.
Kaster
,
R. B.
Leal
,
Purinergic Signalling
,
2017
,
13
,
203
-
214
.
58
M. P.
Kaster
,
J.
Budni
,
A. R.
Santos
,
A. L.
Rodrigues
,
Eur. J. Pharmacol.
,
2007
,
576
,
91
-
98
.
59
L. E.
Bettio
,
J.
Gil-Mohapel
,
A. L.
Rodrigues
,
Purinergic Signalling
,
2016
,
12
,
411
-
426
.
60
P.
Homan
,
A.
Neumeister
,
A. C.
Nugent
,
D. S.
Charney
,
W. C.
Drevets
,
G.
Hasler
,
Transl. Psychiatry
,
2015
,
5
,
e532
.
61
J. J.
Schildkraut
,
J. Neuropsychiatry Clin. Neurosci.
,
1995
,
7
,
524
-
533
; discussion 523–524
.
62
R. S.
Borges
,
S. L.
Castle
,
Bioorg. Med. Chem. Lett.
,
2015
,
25
,
4808
-
4811
.
63
M. J.
Lan
,
G. A.
McLoughlin
,
J. L.
Griffin
,
T. M.
Tsang
,
J. T. J.
Huang
,
P.
Yuan
,
H.
Manji
,
E.
Holmes
,
S.
Bahn
,
Mol. Psychiatry
,
2008
,
14
,
269
-
279
.
64
S. Y.
Kim
,
C. B.
Choi
,
H. S.
Lee
,
S. H.
Lee
,
D. C.
Woo
,
H. Y.
Kim
,
K. S.
Hong
,
C. H.
Lee
,
B. Y.
Choe
,
Magn. Reson. Imaging
,
2010
,
28
,
1461
-
1467
.
Author notes
Electronic supplementary information (ESI) available. See DOI: 10.1039/c7mb00494j
This journal is © The Royal Society of Chemistry