A Prospective Sociocentric Study of 2 Entire Traditional Korean Villages: The Korean Social Life, Health, and Aging Project (KSHAP) (original) (raw)
Journal Article
Received:
06 January 2023
Accepted:
26 September 2023
Published:
28 September 2023
Corrected and typeset:
15 January 2024
 PDF
PDF Cite
Jiwon Baek, Ekaterina Baldina, Kiho Sung, Sung-Ha Lee, Nicholas A Christakis, Peter Bearman, Hyeon Chang Kim, Sang Hui Chu, Eun Lee, Yeong-Ran Park, Jeanyung Chey, Youn-Hee Choi, Dohoon Lee, Yoosik Youm, A Prospective Sociocentric Study of 2 Entire Traditional Korean Villages: The Korean Social Life, Health, and Aging Project (KSHAP), American Journal of Epidemiology, Volume 193, Issue 2, February 2024, Pages 241–255, https://doi.org/10.1093/aje/kwad190
Close
Navbar Search Filter Mobile Enter search term Search
Abstract
The Korean Social Life, Health, and Aging Project (KSHAP) was a multidisciplinary prospective study conducted in South Korea that measured various health biomarkers from blood, hair, and brain magnetic resonance imaging, and we examined their associations with sociocentric (global) social network data of older adults in 2 entire villages (or cohorts). Cohort K included participants aged 60 years or older, and cohort L included participants aged 65 years or older. We performed a baseline survey involving 814 of the 860 individuals (94.7% response rate) in cohort K in 2012 and 947 of the 1,043 individuals (90.8% response rate) in cohort L in 2017. We gathered longitudinal data for 5 waves in cohort K from 2011 to 2019 and 2 waves in cohort L from 2017 to 2022. Here, we describe for the first time the follow-up design of the KSHAP, the changes in social networks, and various biomarkers over a number of years. The data for cohort K are publicly available via the Korean Social Science Data Archive as well as the project website, and the data for cohort L will be shared soon.
Abbreviations
- FLAIR
fluid-attenuated inversion recovery - f-MRI
functional magnetic resonance images - KSHAP
Korean Social Life, Health, and Aging Project - MPRAGE
magnetization-prepared rapid acquisition with gradient echo - MRI
magnetic resonance imaging - NSHAP
National Social Life and Aging Project - SNP
single-nucleotide polymorphisms
Social networks have been examined as one of the crucial social factors associated with diverse health statuses in social epidemiology (1–5). One of the main obstacles for developing social network epidemiology to the fullest extent is the lack of elaborated measures of social networks especially for well-defined community settings (6). To thoroughly tap into various social network measures, we need sociocentric (or complete) social network data that include the social ties of everybody in a given target population. However, with a few exceptions, such as the Framingham Heart Study (7) or the (school-based) National Longitudinal Study of Adolescent to Adult Health (Add Health) (8), most studies have been based on an egocentric social network, based on the responses only from the sample of the population of interest (9–13). Although egocentric network data could be as good as sociocentric network data for many analytical questions and thus sufficient for many studies (14, 15), sociocentrically mapped networks still provide numerous measures that are not available from egocentric network data.
Sociocentric networks significantly contribute to understanding the structural properties of social networks since they involve an enumeration of all ties among all given members (6, 16, 17). A few studies have assessed social positions in sociocentric networks and have assessed the relationship between social networks and health (3, 18–20). The Framingham Offspring study, as a part of the Framingham Heart Study, ascertained longitudinal sociocentric networks of 12,067 individuals from 1971 to 2003. Using the offspring cohort, the possible spread of outcomes such as obesity (21), smoking (22), alcohol consumption (23), and happiness (24) across social ties was assessed in a way that would not be possible using ordinary egocentric network data. Using Add Health data, Bearman et al. (25) showed that, unlike adults, adolescents might not have pervasive sexual core groups, which are small in size but very sexually active. This study was based on a sociocentric network of 832 students from a high school and provided a unique policy implication for the prevention of sexually transmitted diseases among adolescents.
The Korean Social Life, Health, and Aging Project (KSHAP) adopted an approach similar to that used in an American counterpart, the National Social Life, Health, and Aging Project (NSHAP) (26). The NSHAP is an ongoing investigation that is contributing to the understanding of the association between health and the structure of older adults’ social ties based on a representative national sample of the United States (27–29). The KSHAP modified the study design of the NSHAP by targeting the entire populations in 2 villages while sacrificing the representativeness of the sample for the nation. Instead, the KSHAP has decided to collect sociocentric networks of older adults and follow them over years; the follow-up rates ranged from 84% to 95%. The primary objective of the KSHAP is to provide scientific data that can identify the specific mechanisms underlying the associations between social networks and health statuses for older adults with the inclusion of abundant markers of biological aging in recent waves.
The KSHAP generates sociocentric network data, which in principle encompasses all social relationships between all individuals in a population. This provides a unique opportunity to examine the role of various sociocentric network variables, which are not available in egocentric network data. One sociocentric network variable that can be easily compared with egocentric ones is in-degree centrality. In-degree centrality refers to the number of people who identify the respondent as among their social ties. In contrast to this, social network size in egocentric networks, which is often called out-degree centrality, is defined as the number of people with whom respondents themselves report or perceive as their social ties. In-degree centrality can only be obtained through the entire population of interest. One KSHAP study showed that not out-degree centrality but only in-degree centrality was associated with the volume of the social brain, the regions throughout the brain that together are believed to enable complex social interactions (30). Another popular sociocentric network variable is K-core, which is a maximal group of individuals, all of whom are connected to at least K other members of the group. A high K-core score indicates that the group occupies a core position in the whole social network, maintains cohesive ties within, and plays a crucial role in the diffusion process, consensus emergence, and opinion formation (31, 32). One KSHAP study revealed that older adults with a high K-core score seemed to maintain long-distance connectivity in the brain and, therefore, may be protected from declining cognitive function (33). This kind of study is not possible based on traditional egocentric network data.
The cross-sectional design of the very early KSHAP cohort K has been described previously (34, 35). Also, each of many previous studies based on KSHAP has described a part of the KSHAP to suit its own purposes, but this study is the first to explain the characteristics of the entire data set across each wave over 10 years systematically. Here, we outline the follow-up procedure and provide details on the panel design and the association between social network change and physical examination factors, with an update through December 2022. For the first time, we introduce the characteristics of the cohort K and L participants compared with a representative sample of Korean older adults. Furthermore, we provide information on 3 subcohorts that were derived from the original 814 members of cohort K and 947 members of cohort L, namely the psychiatry, brain imaging, and oral health cohorts. Due to space limitations, we only deliver a detailed description of the brain imaging subcohort among the 3 subcohorts.
METHODS
Site selection
The KSHAP sites were located in the rural part of Ganghwa Island, which spans approximately 102,000 acres and is approximately 65 kilometers away from Seoul, connected to the mainland by 2 large bridges. Ganghwa Island was chosen due to its high proportion of older adult residents and low mobility rate. For instance, according to the 2011 Korean Statistical Information Service, the proportion of older adults aged ≥60 years was 45.3%, and their move-out rate was only 4.9% (36). Moreover, participants of cohort K and L had a lengthy average period of residence in the same village, of 48 and 50 years, respectively. These unique site characteristics were particularly relevant for the KSHAP, which aims to collect prospective data of stable structure of social networks with high response rates.
Study design of the KSHAP
The KSHAP encompasses 2 main cohorts and 3 subcohorts: cohorts K and L and 3 specialized subsample cohorts.
We administered the first survey of cohort K between December 2011 and January 2012 and 4 further surveys across 8 years: wave 2 (December 2012 to March 2013), wave 3 (February 2014 to April 2014), wave 4 (December 2015 to February 2016), and wave 5 (December 2018 to February 2019). Cohort L was an additional cohort of residents of another village on the same island. We collected the baseline data of cohort L between December 2016 and March 2017 and the follow-up data from July 2021 to February 2022.
The 3 subcohorts had additional measurements in terms of psychiatry, brain imaging, and oral health. The psychiatry subcohort consisted of 235 participants from cohort K from 2015 to 2018, with 3 waves. It collected data on psychiatric disorders, perceived stress, anger, sleep quality, and hair cortisol. In cohort K, the brain imaging subcohort was established from 2015 to 2016 and followed up in 2019, when another set of images was collected. The brain imaging subcohort of cohort L was obtained in 2018. The brain imaging subcohort provided structural magnetic resonance imaging (MRI), including T1 magnetization-prepared rapid acquisition with gradient echo (MPRAGE), T2 fluid-attenuated inversion recovery (FLAIR), and diffusion tensor imaging (DTI). Also, resting-state and task-based functional MRI (f-MRI) were collected. More details about the brain image data are provided below (Data-collection process, Measurements). The oral subcohort consisted of 190 participants in cohort K and 188 participants in cohort L whose saliva was collected, and a survey about their oral health status was completed. The summary of the core variables collected in the KSHAP subcohorts is shown in Web Table 1 (available at https://doi.org/10.1093/aje/kwad190). Figure 1 illustrates a major timeline of the KSHAP for the different cohorts.
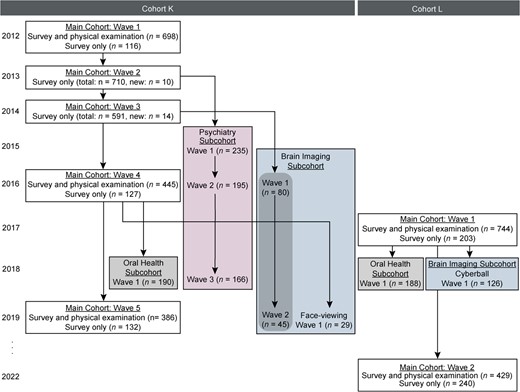
Figure 1
Flowchart of study activities over 10 years, Korean Social Life, Health, and Aging Project. The survey year indicates when the survey was completed.
Participants and follow-up
To construct a sociocentric network, we targeted the entire population of individuals who were aged ≥60 years and their spouses in township K when we started the first wave. Because the first survey for township L started 5 years later, individuals aged ≥65 years and their spouses were our population of interest in township L. Table 1 presents the response rates of the eligible population for each wave of interviews and physical examinations.
Table 1
Response Rates in the Main Cohorts, Cohorts K and L, Korean Social and Health Assessment Project, 2011–2022
| Cohort and Wave | Yeara | Total No. Eligible | No. Interviewed | Response Rate, % | No. of Physical Examinations | Response Rate, % |
|---|---|---|---|---|---|---|
| Cohort K | ||||||
| Baseline | 2012 | 860 | 814 | 94.7 | 698 | 85.7 |
| Wave 2 | 2013 | 755 | 710 | 94.0 | N/A | N/A |
| Wave 3 | 2014 | 707 | 591 | 83.6 | N/A | N/A |
| Wave 4 | 2016 | 593 | 572 | 96.5 | 445 | 77.8 |
| Wave 5 | 2019 | 578 | 518 | 89.6 | 386 | 74.5 |
| Cohort L | ||||||
| Baseline | 2017 | 1,043 | 947 | 90.8 | 744 | 78.6 |
| Wave 2 | 2022 | 724 | 669 | 92.4 | 429 | 64.1 |
Abbreviations: KSHAP The Korean Social Life, Health, and Aging Project; N/A, not applicable.
a The survey year indicates when the survey was completed.
The population size of older adults in cohort K was 870 based on the resident registration data of 2010. With the aid of the public officers of township K and a pilot study, we identified 860 individuals in total as the KSHAP population. We administered a baseline survey to 814 of the 860 participants (response rate: 94.7%) and conducted a physical examination involving 698 individuals (85.7% of the survey participants). The baseline cohort was followed for 8 years in 4 subsequent waves. The response rates were quite high, ranging from approximately 90% to 95%, except for wave 3. The response rates were calculated considering individuals who were unable to participate in the follow-up survey because of admission to a hospital or nursing home, communication impairment because of cognitive or hearing dysfunction, temporary or permanent moving to another area, or death. Physical examinations were followed by a survey: 445 of 572 individuals (response rate: 77.8%) in wave 4 and 386 of 518 individuals (response rate: 74.5%) in wave 5.
Township L had a population of 1,483 older adults based on the resident registration data published in 2015. The local public health center and the Senior Citizen Association helped us to identify 1,043 eligible individuals. We completed a baseline survey of 947 individuals (response rate: 90.8%) and conducted physical examinations of 744 individuals (78.6% of the survey participants) in 2017. In 2022, 669 of 947 individuals (response rate: 92.4%) participated in the follow-up survey, and 429 of 669 individuals (64.1% of the survey participants) underwent physical examinations.
In cohort K, 80 individuals were scanned using structural MRI including T1 MPRAGE and T2 FLAIR and f-MRI, including a resting-state and cognitive control task in 2015–2016. Of the 80 individuals, 45 were also scanned for the same structural MRI and f-MRI including a resting-state, theory of mind task, and multisource interference task in 2019. Another brain imaging subcohort in cohort K performed T1 MPRAGE, resting-state f-MRI, face-viewing task, and senior center–viewing task with 29 participants in 2019 (37). In cohort L, brain imaging data were collected for 126 participants in 2018 with structural MRI, including T1 MPRAGE, T2 FLAIR, and DTI, and f-MRI, including a resting-state, Cyberball task, and multisource interference task (38, 39).
Data-collection process
The data collection consisted of 2 major steps: the survey and the physical examination.
We held the interviews in the respondents’ homes or senior community centers via face-to-face conversations for an average of approximately 48 minutes. The participants were surveyed by trained personnel using standardized questionnaires according to the predetermined protocol. Written informed consent was obtained beforehand.
After the survey, all KSHAP participants were informed, and if the participants were willing to participate in the physical examination, we secured a separate consent form and scheduled an appointment. The physical examinations were performed at local public health centers, a local hospital, or the homes of the participants. A comprehensive set of physical examinations was administered by trained staff with appropriate medical qualifications. The collected blood samples were analyzed at Seoul Clinical Laboratories (https://www.scllab.co.kr/). All remaining blood samples were stored in freezers (−70°C) at Avison Biomedical Research Center at Yonsei University.
Measurements
A summary of survey-based variables collected from cohorts K and L is presented in Table 2. The survey questionnaire included a range of topics, including social networks, sociodemographic factors, self-rated health, physical activity, medical history, medication use, functioning level, depressive symptoms, cognitive function, and psychosocial factors.
Table 2
Summary of Survey-Based Variables Collected in the Main Cohorts, Cohorts K and L, Korean Social and Health Assessment Project, 2011–2022
| Questionnaire Aspect | Measures |
|---|---|
| General | Demographic factors |
| Occupation status and history | |
| Social position in the community | |
| Social activity | |
| Welfare service utilization | |
| Self-rated health | |
| Physical activity | |
| Medical history (past disease history, disease treatment status, medication history) | |
| Functional level (ADL, IADL)a,b | |
| CES-Dc | |
| GDSSF-K; cohort K wave 2 onlyd | |
| Cognitive function (MMSE-DS)e | |
| Psychosocial factors (self-rated emotional stress, life satisfaction, suicidal thoughts and/or attempts) | |
| Sleeping disorder | |
| Health-related behaviors (cigarette smoking, alcohol consumption) | |
| Lonelinessf | |
| Gender equality perceptiong | |
| Sexual lifef | |
| Socioeconomic status | |
| Social network | Egocentric networks (network size, density, closed triad, open triad, bridging potential, frequency of meeting and communication, emotional closeness, the proportion of kin, etc.) |
| Sociocentric networks (degree centrality, closeness centrality, betweenness centrality, component, K-core, etc.) | |
| Social support (emotional, instrumental, financial, informational) from spouse, children, and friends or neighbors. |
Abbreviations: ADL, activities of daily living; CES-D, Center for Epidemiologic Studies Depression Scale; GDSSF-K, Geriatric Depression Scale Short Form–Korean Version; IADL, instrumental activities of daily living; MMSE-DS, Mini Mental State Examination–Dementia Screening.
a Except for the baseline in cohort K.
b Adapted from Won et al. (57).
c Adapted from Noh et al. (58).
d Adapted from Kee et al. (59).
e Adapted from Kim et al. (60).
f Except for the baseline and waves 2 and 3 in cohort K.
g Except for the baseline and wave 2 in cohort K.
Social networks were assessed using the Korean version of the Social Network Survey name generator, which is identical to the NSHAP from the United States (26) as follows: “From time to time, most individuals discuss things that are important to them with others. For example, these may include good or bad things that happen to you, problems you are having, or important concerns you may have. Looking back at the last 12 months, who are the individuals with whom you most often discussed things that were important to you?” The social network in KSHAP consist of the individual’s discussion network up to 5, plus their spouse if they have one. Therefore, social network size ranges from zero to 6 if the spouse is included, or from zero to 5 if the spouse is not counted. We also collected detailed information on the participants’ discussion network members, including their real names, sexes, ages, addresses at the smallest South Korean administrative unit (the rhee), type and duration of relationship, cohabitation status, education level, frequency of meeting and communication, and emotional closeness.
The KSHAP participants were also asked “How frequently do (network member 1) and (network member 2) talk to each other?” on an 8-point Likert scale, ranging from “every day” to “less than once per year.” By measuring the relationships within social network members, we can obtain egocentric network variables including density (the proportion of connections between network members out of all possible connections), the number of open triads (groups of 3 network members where only 2 have a connection), closed triads (groups of 3 network members where all 3 have connections), and bridging potential. Bridging potential refers to the likelihood that the participants perform a role of bridging social interactions between their social network members. In this study, we defined a participant as having a brokerage role if they have at least 1 social network member who is not connected to any other members within their social network (40).
Using the 4 types of information on the network members, including their real names, sexes, ages, and addresses, we constructed a sociocentric network of each village. Two individuals in a social network were assumed to be identical if all 4 criteria were met: 1) at least 2 of 3 Korean characters in their names match, 2) their sex was the same, 3) their age difference was less than 5 years, and 4) their address was in the same rhee, the smallest administrative unit in South Korea (35). Unfortunately, many Korean older adults share similar names. The cross-validation was conducted either by contacting or visiting the respondents again to confirm the accuracy of the data when we were not sure.
As mentioned above, the KSHAP provides sociocentric network measures including in-degree centrality, K-core, and component. A component is a maximal connected subgraph that is disconnected from other components. We can identify a segregated group as a group of individuals who only belong to a small component and cannot extend the connections outside their small group (41). Individuals in a small component may have many friends, but they cannot reach the village-wide community and thus, would be group-level segregated. The sociocentric network of KSHAP consisted of 1 large component and multiple smaller components, which is quite consistent across all waves of cohort K and L. To measure group-level segregation, respondents were classified as either nonsegregated if they belonged to the largest component or segregated if they belonged to one of the smaller components. Participants who reported no social ties were excluded in the measurement since they were only individual-level segregated. An illustration of the sociocentric networks of townships K and L from wave 1 is presented in Figures 2 and 3, respectively.
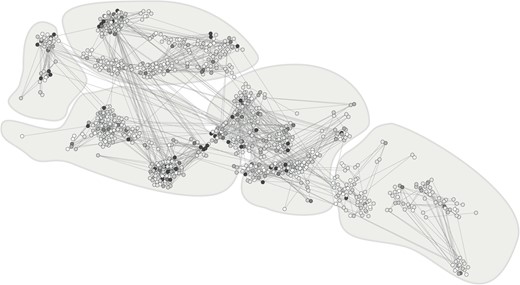
Figure 2
Sociocentric network of cohort K (n = 814) at baseline mapped to altered geographic data, Korean Social Life, Health, and Aging Project, 2011–2019. Original maps have been slightly jittered to protect confidentiality; color of the nodes represents the in-degree centrality (popularity); darker nodes are more popular. The lines between nodes denote social ties between the residents. Separate areas in each panel represent rhee (the smallest administrative unit in South Korea).
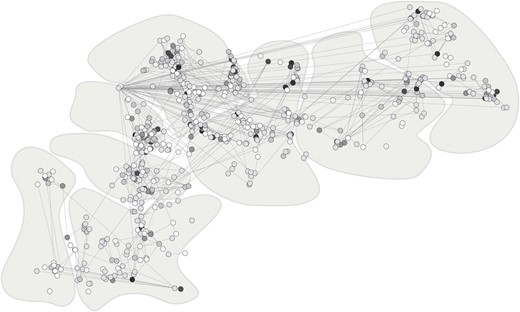
Figure 3
Sociocentric network of cohort L (n = 947) at baseline mapped to altered geographic data, Korean Social Life, Health, and Aging Project, 2017–2022. Original maps have been slightly jittered to protect confidentiality; color of the nodes represents the in-degree centrality (popularity); darker nodes are more popular. The lines between nodes denote social ties between the residents. Separate areas in each panel represent rhee (the smallest administrative unit in South Korea).
A summary of the physical examinations and blood assays is presented in Table 3. Fasting blood assays were performed by medical personnel and drawn from the antecubital vein. We genotyped the extracted genomic DNA using Korean Biobank arrays (Korean Chips, Genome Science at the Korean National Institute of Health). See Moon et al. (42) for details.
Table 3
Summary of Physical Examination Variables Collected in Main Cohorts, Cohorts K and L, Korean Social and Health Assessment Project, 2011–2022
| Category | Measures |
|---|---|
| Physical examination | Anthropometrics (height, weight; waist, hip, and thigh circumferences) |
| Blood pressure (systolic blood pressure, diastolic blood pressure, pulse pressure, mean arterial pressure)a | |
| Radical pulse wave analysis (central blood pressure, augmentation index) | |
| Bone densitometryb | |
| Chair rise testcTimed up-and-go testd | |
| Grip strengthc,d | |
| Blood biomarker | Lipid (total cholesterol, HDL cholesterol, TG, LDL cholesterol) |
| Liver function (protein, albumin, total bilirubin, AST, ALT) | |
| Kidney function (BUN, Cr, GFR) | |
| Glucose metabolism (glucose, insulin, HbA1c) | |
| Anemia (hemoglobin, hematocrit) | |
| 25(OH)Vitamin D | |
| Inflammation (hsCRP) | |
| Human Cardiovascular Disease Magnetic Bead Panel I (TNF-α, IL-1b, IL-6, Leptin, BNP, NT proBNP, troponin I)c,d | |
| DNA (single-nucleotide polymorphisms)e |
Abbreviations: ALT, alanine aminotransferase; AST, aspartate aminotransferase; BNP, brain natriuretic peptide; BUN, blood urea nitrogen; Cr, creatinine; GFR, glomerular filtration rate; HbA1c, hemoglobin A1c; HDL, high-density lipoprotein; hsCRP, high-sensitivity C-reactive protein; IL-1b, interleukin 1 beta; IL-6, interleukin 6; LDL, low-density lipoprotein; NT proBNP, _N_-terminal prohormone of brain natriuretic peptide; TG, triglycerides; TNF-α, tumor necrosis factor-alpha.
a In cohort K, resting blood pressure was measured at least twice on the right upper arm at wave 1. If the first and second measurements differed by ≥10 mm Hg, either for systolic or diastolic pressure, additional measurements were performed. At waves 4 and 5 of cohort K and wave 2 of cohort L, blood pressure was measured 3 times on the right and left upper arms, respectively, in the seated position after 5 minutes of rest. At wave 2 of cohort L, blood pressure was measured 2 times on the right upper arm at wave 2.
b Ultrasound calcaneus bone densitometry, except for wave 2 of cohort L, and dual-energy X-ray absorptiometry at wave 2 of cohort L.
c Except for wave 2 of cohort L.
d Except for the baseline of cohort K.
e Only for wave 4 of cohort K and wave 2 of cohort L
A summary of the brain imaging data and measurements is presented in Web Table 1.
Ethical approval
The Institutional Review Board of Yonsei University approved this study (YUIRB-2011-012-01 in 2011; 1040917-201505-SB-152-05 in 2014; 7001988-201806-HRBR-244-04 in 2016; 7001988-201612-SB-307-04 in 2017; 7001988-201812-HR-505-02 in 2018; and 7001988-202111-BR-1037-05 in 2021) and the Yonsei University Health System, Severance Hospital (4-2012-0172 in 2012). The participants signed separate informed consent forms for the interviews and physical measurements (including blood assays, authorized sample storage, and further blood analysis). All data were expressed as anonymous and encrypted.
RESULTS
Characteristics of the KSHAP participants
The mean ages of the participants at baseline were 71 years (range, 42–96 years) in cohort K and 77 years (range, 59–103 years) in cohort L. Most participants in cohorts K and L had no formal education (70% in cohort K and 61% in cohort L) and were engaged in farming (61% in cohort K and 62% in cohort L). Moreover, they had a long average period of residence in the same village: 48 years in cohort K and 50 years in cohort L. We compared the baseline characteristics of the KSHAP participants with the national rural data from the Korea National Health and Nutrition Examination Survey (KNHANES), a representative sample of Koreans collected by the Korean Disease Control and Prevention Agency (43) (Web Tables 2 and 3). Both cohort K and L participants had significantly higher proportions of agriculture/fishery employment status and spousal cohabitation than the KNHANES participants in 2012 and 2017, respectively.
Descriptive statistics of key factors across waves
To investigate changes in social networks, physical examination, and blood assays across waves, we conducted analysis of variance, χ2 tests, and Fisher’s exact tests, followed by post-hoc analyses. All statistical tests were based on bivariate analyses. Based on egocentric social network changes in Table 4, we observed that as residents in village K aged, they managed to increase their network size somewhat by relying on kin. We believe this increase was mainly due to the dropout of the deceased who were likely to maintain a small network size. The mortality rate during the follow-up was 16.6% in village K. Sociocentric network variables revealed that entire social networks of the village became fragmented and divided, with an increase in group-level segregation and a drop in K-core, indicating that residents were segregated into smaller social networks as they are getting older. There were no significant differences in body mass index and timed up-and-go test levels across waves. In the results of blood assays, we observed significant changes in high-density lipoprotein, triglycerides, and blood urea nitrogen–creatinine ratio. The proportion of participants with normal high-density lipoprotein and blood urea nitrogen–creatinine ratio decreased from wave 1 to wave 5, while the proportion of those with normal triglycerides increased.
Table 4
Descriptive Statisticsa of Social Networks, Physical Examinations, and Blood Assays in Cohort K by Wave, Korean Social and Health Assessment Project, 2012–2019
| Variable | Wave 1: 2012 (n = 814) | Wave 2: 2013 (n = 710) | Wave 3: 2014 (n = 591) | Wave 4: 2016 (n = 572) | Wave 5: 2019 (n = 518) | P Value | ||||||||
|---|---|---|---|---|---|---|---|---|---|---|---|---|---|---|
| Mean (SD) | No. | % | Mean (SD) | No. | % | Mean (SD) | No. | % | Mean (SD) | No. | % | Mean (SD) | No. | % |
| Egocentric network | ||||||||||||||
| Discussion network size | 2.31 (1.14) | 2.14 (1.25) | 2.35 (1.7) | 2.80 (1.40) | 2.64 (1.44) | <0.001 | ||||||||
| Proportion of kinb | 0.55 (0.36) | 0.65 (0.36) | 0.63 (0.37) | 0.63 (0.34) | 0.69 (0.34) | <0.001 | ||||||||
| Proportion of network members living in the same rheeb | 0.74 (0.34) | 0.70 (0.35) | 0.73 (0.35) | 0.63 (0.35) | 0.57 (0.36) | <0.001 | ||||||||
| Network densityc | 0.66 (0.43) | 0.73 (0.38) | 0.68 (0.39) | 0.62 (0.39) | 0.66 (0.38) | <0.001 | ||||||||
| Bridging potentialc | 0.36 (0.48) | 0.28 (0.45) | 0.34 (0.47) | 0.36 (0.48) | 0.34 (0.47) | 0.009 | ||||||||
| Sociocentric network | ||||||||||||||
| In-degree centrality | 1.93 (1.62) | 1.62 (1.31) | 1.64 (1.43) | 1.74 (1.36) | 1.52 (1.33) | <0.001 | ||||||||
| Group-level segregationb | ||||||||||||||
| No | 619 | 77.8 | 471 | 69.1 | 433 | 78.4 | 449 | 81.9 | 316 | 66.5 | <0.001 | |||
| Yes | 177 | 22.2 | 211 | 30.9 | 119 | 21.6 | 99 | 18.1 | 159 | 33.5 | ||||
| K-core score | 2.65 (1.00) | 2.31 (0.93) | 2.30 (1.06) | 2.38 (0.83) | 2.18 (0.88) | <0.001 | ||||||||
| Physical examination | ||||||||||||||
| BMId | ||||||||||||||
| <25 | 421 | 61.8 | 231 | 55.3 | 199 | 56.5 | 0.066 | |||||||
| ≥25 | 260 | 38.2 | 187 | 44.7 | 153 | 43.5 | ||||||||
| Timed up-and-go test, secondse | ||||||||||||||
| <14 | 342 | 64.7 | 298 | 71.5 | 267 | 69.7 | 0.063 | |||||||
| ≥14 | 187 | 35.3 | 119 | 28.5 | 116 | 30.3 | ||||||||
| Blood assaysf | ||||||||||||||
| Total cholesterol | ||||||||||||||
| <240 mg/dL | 651 | 94.8 | 420 | 94.4 | 362 | 95.0 | 0.920 | |||||||
| ≥240 mg/dL | 36 | 5.2 | 25 | 5.6 | 19 | 5.0 | ||||||||
| HDL cholesterol | ||||||||||||||
| ≥ 40 mg/dL | 565 | 82.2 | 341 | 76.6 | 281 | 73.8 | 0.003 | |||||||
| <40 mg/dL | 122 | 17.8 | 104 | 23.4 | 100 | 26.2 | ||||||||
| LDL cholesterol, | ||||||||||||||
| <160 mg/dL | 664 | 96.7 | 430 | 96.6 | 367 | 96.3 | 0.960 | |||||||
| ≥160 mg/dL | 23 | 3.3 | 15 | 3.4 | 14 | 3.7 | ||||||||
| TG | ||||||||||||||
| <200 mg/dL | 543 | 79.0 | 371 | 83.4 | 341 | 89.5 | <0.001 | |||||||
| ≥200 mg/dL | 144 | 21.0 | 74 | 16.6 | 40 | 10.5 | ||||||||
| AST | ||||||||||||||
| <34 U/L | 583 | 84.9 | 377 | 84.7 | 323 | 84.8 | 1.000 | |||||||
| ≥34 U/L | 104 | 15.1 | 68 | 15.3 | 58 | 15.2 | ||||||||
| ALT | ||||||||||||||
| ≤49 U/L | 670 | 97.5 | 431 | 96.9 | 367 | 96.3 | 0.526 | |||||||
| >49 U/L | 17 | 2.5 | 14 | 3.1 | 14 | 3.7 | ||||||||
| BUN-Cr ratio | ||||||||||||||
| 10–20 mg/dL | 524 | 76.3 | 313 | 70.3 | 129 | 33.9 | <0.001 | |||||||
| <10 or >20 mg/dL | 163 | 23.7 | 132 | 29.7 | 252 | 66.1 | ||||||||
| hsCRP | ||||||||||||||
| <3 mg/L | 582 | 84.7 | 380 | 85.4 | 310 | 81.4 | 0.240 | |||||||
| ≥3 mg/L | 105 | 15.3 | 65 | 14.6 | 71 | 18.6 |
Abbreviations: ALT, alanine aminotransferase; AST, aspartate aminotransferase; BMI, body mass index; BUN, blood urea nitrogen; Cr, creatinine; HDL, high-density lipoprotein; hsCRP, high-sensitivity C-reactive protein; LDL, low-density lipoprotein; TG, triglycerides.
a Analysis of variance, χ2 tests, and Fisher’s exact tests were used to bivariate statistical analysis.
b Respondents with a social network of 0 were excluded. The rhee is the smallest administration unit in South Korea.
c Respondents with a social network of 0 or 1 were excluded.
d Weight (kg)/height (m)2; sample size for BMI was 681 in Wave 1, 418 in wave 4, and 352 in wave 5.
e Sample size for timed up-and-go test was 529 in wave 1, 417 in wave 4, and 383 in wave 5.
f Sample size for blood assays was 687 in wave 1, 445 in wave 4, and 381 in wave 5.
Table 5 shows that, unlike in cohort K, the decay of social networks was quite striking in cohort L. We believe this was due to COVID-19 quarantine during the second wave. The size of social networks decreased, and the proportion of group-level segregated people skyrocketed from 34.7% to 71.4%. Considering that the response rate for wave 2 was 92.4%, we consider this a credible conclusion. As shown in the results of blood assays, the proportion of participants with normal levels of triglycerides, alanine aminotransferase, and high-sensitivity C-reactive protein significantly increased in wave 2 compared with wave 1.
Table 5
Descriptive Statisticsa of Social Networks, Physical Examinations, and Blood Assays in Cohort L by Wave, Korean Social and Health Assessment Project, 2017 and 2022
| Variable | Wave 1: 2017 (n = 947) | Wave 2: 2022 (n = 669) | P Value | ||
|---|---|---|---|---|---|
| Mean (SD) | No. | % | Mean (SD) | No. | % |
| Egocentric network | |||||
| Discussion network size | 3.68 (1.41) | 2.48 (1.62) | <0.001 | ||
| Proportion of kinb | 0.69 (0.33) | 0.75 (0.33) | <0.001 | ||
| Proportion of network members living in the same rheeb | 0.50 (0.33) | 0.56 (0.37) | <0.001 | ||
| Network densityc | 0.56 (0.35) | 0.71 (0.37) | <0.001 | ||
| Bridging potentialc | 0.42 (0.49) | 0.27 (0.44) | <0.001 | ||
| Sociocentric network | |||||
| In-degree centrality | 1.42 (1.29) | 1.08 (0.98) | <0.001 | ||
| Group-level segregationb | |||||
| No | 617 | 65.3 | 173 | 28.6 | <0.001 |
| Yes | 328 | 34.7 | 432 | 71.4 | |
| K-core score | 2.09 (0.89) | 1.73 (0.83) | <0.001 | ||
| Physical examination | |||||
| BMId | |||||
| <25 | 436 | 59.3 | 255 | 59.4 | 0.968 |
| ≥25 | 299 | 40.7 | 174 | 40.6 | |
| Time up-and-go test, secondse | |||||
| <14 | 407 | 55.4 | |||
| ≥14 | 328 | 44.6 | |||
| Blood assaysf | |||||
| Total cholesterol | |||||
| <240 mg/dL | 698 | 94.1 | 391 | 93.5 | 0.718 |
| ≥240 mg/dL | 44 | 5.9 | 27 | 6.5 | |
| HDL cholesterol | |||||
| ≥40 mg/dL | 619 | 83.4 | 330 | 78.9 | 0.058 |
| <40 mg/dL | 123 | 16.6 | 88 | 21.1 | |
| LDL cholesterol, | |||||
| <160 mg/dL | 709 | 95.6 | 400 | 95.7 | 0.910 |
| ≥160 mg/dL | 33 | 4.5 | 18 | 4.3 | |
| TG | |||||
| <200 mg/dL | 613 | 82.6 | 370 | 88.5 | 0.007 |
| ≥200 mg/dL | 129 | 17.4 | 48 | 11.5 | |
| AST | |||||
| <34 U/L | 645 | 86.9 | 373 | 89.2 | 0.250 |
| ≥34 U/L | 97 | 13.1 | 45 | 10.8 | |
| ALT | |||||
| ≤49 U/L | 703 | 94.7 | 407 | 97.4 | 0.035 |
| > 49 U/L | 39 | 5.3 | 11 | 2.6 | |
| BUN-Cr ratio | |||||
| 10–20 mg/dL | 290 | 39.8 | 146 | 34.9 | 0.161 |
| <10 or >20 mg/dL | 452 | 60.2 | 272 | 65.1 | |
| hsCRP | |||||
| <3 mg/L | 624 | 84.1 | 378 | 90.4 | 0.003 |
| ≥3 mg/L | 118 | 15.9 | 40 | 9.6 |
Abbreviations: ALT, alanine aminotransferase; AST, aspartate aminotransferase; BMI, body mass index; BUN, blood urea nitrogen; Cr, creatinine; HDL, high-density lipoprotein; hsCRP, high-sensitivity C-reactive protein; LDL, low-density lipoprotein; TG, triglycerides.
a Analysis of variance, χ2 tests, and Fisher’s exact tests were used to bivariate statistical analysis.
b Respondents with a social network of 0 were excluded. The rhee is the smallest administration unit in South Korea.
c Respondents with a social network of 0 or 1 were excluded.
d Weight (kg)/height (m)2; Sample size for BMI was 735 in wave 1 and 429 in wave 2.
e Timed up-and-go test was measured only in wave 1 for 735 participants.
f Sample size for blood assays was 742 in wave 1 and 418 in wave 2.
Web Tables 4 and 5 present key factors associated with the cohort follow-up. Web Table 6 describes the basic information on the selected single nucleotide polymorphisms (SNPs) based on prior research relevant to social network characteristics. To date, SNP microarray using Korean Chips has been completed in wave 4 of cohort K and wave 2 of cohort L participants.
DISCUSSION
The KSHAP focuses on comprehensive analyses of 4 types of major health biomarkers (i.e., genotypes, brain imaging, physical examinations, and blood tests) and 2 levels of social networks (i.e., egocentric and sociocentric) to understand the relationship between social networks and various health statuses (Figure 4). More than 50 papers based on KSHAP data have examined the role of social networks in the process of health and illness. For example, researchers have found that particular patterns of social networks are associated with various health statuses, including well-being (44–46), self-rated health (47), suicidal thoughts (48), depression (49), cognitive dysfunction (50, 51), hypertension management (52), C-reactive protein level (53), and others (54, 55). Recently, the analysis of the relationships between social networks and 8-year all-cause mortality using prospective KSHAP data showed that group-level segregated individuals had a higher risk of mortality than their nonsegregated counterparts (41). Our findings indicate that social networks play an important role in understanding the physical and mental health status among older adults.
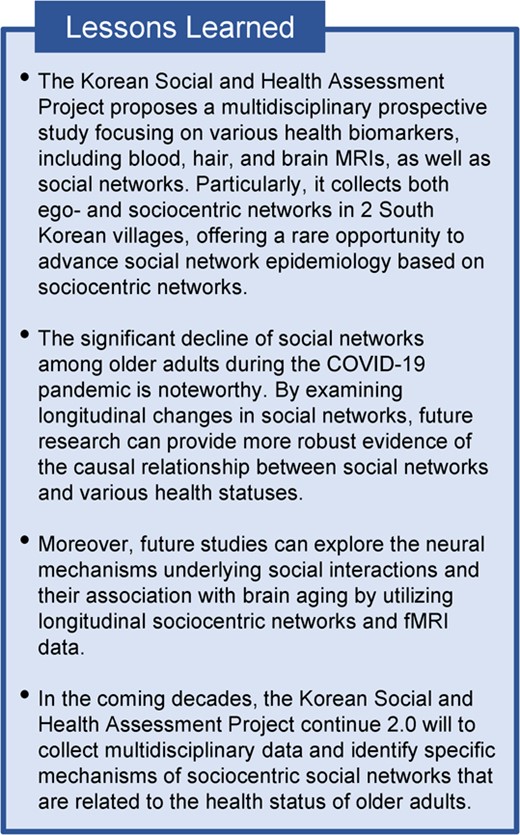
Figure 4
Lessons learned from the Korean Social and Health Assessment Project.
The KSHAP also contains sociocentric networks and f-MRI data that allow us to examine the neural underpinnings of social interactions and their associations with brain aging. Using sociocentric network characteristics of cross-sectional KSHAP data, several studies have revealed an association between sociocentric network positions and brain health. We examined relationships of both in-degree and out-degree centrality with the volume of brain regions believed to be responsible for social interactions. In-degree centrality was strongly associated with increased social brain volume, whereas out-degree centrality was not (30). We also showed that similarity in individuals’ resting-state functional connectomes could successfully predict individuals’ proximity in their real-world social network (56). The KSHAP recently constructed longitudinal data of both sociocentric networks and MRI data.
Using genotyping data collected, we have been investigating the influence of genetic variations on social network characteristics such as formation and maintenance of social network. The Korea Biobank Array (also called KoreanChip) will include more than 800,000 markers, such as expression quantitative trait loci that affect gene expression and SNPs related to complex diseases present in the Korean population. Because most genomic studies have been performed involving populations of European ancestry, genotyping information in the KSHAP will provide valuable information on genetic factors for social relationships in non-White populations.
The KSHAP 2.0 will continue to collect cohorts from townships K and L, ideally for the next 10 years. All data collection will be implemented at 3-year intervals and will include both survey and physical examination. Furthermore, genotype data will be collected once in the entire study period for all participants who have not participated in gene data collection yet. Wave 6 of cohort K will be conducted in January 2023 with a newly added sample of residents who will be 60 years or older, and their spouses, at the time of the interview. Approximately 1,000 participants in total are expected. Brain imaging cohorts will be followed up at least once during the KSHAP 2.0, and both structural MRI (T1 MPRAGE and T2 FLAIR) and resting-state functional MRI will be included as common measurements. The main goal of the KSHAP is to provide scientific data to identify the specific mechanisms of social network associations with health status for older adults.
Future studies based on KSHAP can focus on the changes in social networks and their association with the changes of various health statues and biomarkers. Compared with the cross-sectional social network epidemiologic studies, this line of research could be closer to robust causal founding. For example, Table 5 confirmed the sharp shrinkage of social networks of older adults during COVID-19. Does this change lead to worse health statuses? How about the health of those people whose social networks remained intact? How long did it take for older adults to return to the original social network? All of these are good candidates for the theme of future studies.
The biggest weaknesses of our study include the limited generalization of the study data because our sites were restricted to traditional rural villages on an island. Therefore, our respondents were not a representative sample of older adults in South Korea in any sense. Additionally, the KSHAP potentially has survivorship bias. This occurs when the study includes only those who have survived or remained healthy up to a certain age or period, while excluding those who have not. Last, the brain imaging subcohort data may suffer from selection bias, as it was obtained only from participants who were willing to travel to an MRI scan center in Seoul. We believe, however, that this bias is not serious. To minimize the selection bias, we arranged transportation for participants to travel to and from Seoul using a reserved taxi. Additionally, we recruited the brain imaging cohort participants by selecting and contacting them based on their social network properties obtained from the main KSHAP cohort data, rather than recruiting them through advertisement.
ACKNOWLEDGMENTS
Author affiliations: Department of Sociology, Yonsei University, Seoul, Republic of Korea (Jiwon Baek, Kiho Sung, Yoosik Youm); Mo-Im Kim Nursing Research Institute, College of Nursing, Yonsei University, Seoul, Republic of Korea (Jiwon Baek, Sang Hui Chu); Department of Sociology, Indiana University, Bloomington, Indiana, United States (Ekaterina Baldina); Center for Happiness Studies, Seoul National University, Seoul, Republic of Korea (Sung-Ha Lee); Yale Institute for Network Science, Yale University, New Haven, Connecticut, United States (Nicholas A. Christakis); Interdisciplinary Center for Innovative Theory and Empirics, Columbia University, New York, New York, United States (Peter Bearman); Department of Preventive Medicine, Yonsei University College of Medicine, Seoul, Republic of Korea (Hyeon Chang Kim); Department of Nursing, Yonsei University College of Nursing, Seoul, Republic of Korea (Sang Hui Chu); Department of Psychiatry, Yonsei University College of Medicine, Seoul, Republic of Korea (Eun Lee); Department of Silver Industry, Kangnam University, Yongin, Gyeonggi, Republic of Korea (Yeong-Ran Park); Department of Psychology, Seoul National University, Seoul, Republic of Korea (Jeanyung Chey); Department of Preventive Dentistry, Kyungpook National University School of Dentistry, Daegu, Republic of Korea (Youn-Hee Choi); and Department of Sociology, Seoul National University, Seoul, Republic of Korea (Dohoon Lee).
This work was supported by the National Research Foundation of Korea (NRF-2017S1A3A2067165). This research was also supported by the Yonsei Signature Research Cluster Program of 2021 (No. 2022-22-0009).
The Korean Social Life, Health, and Aging Project shares egocentric social network, physical examination, and blood assay data through the Korean Social Science Data Archive (KOSSDA; https://kossda.snu.ac.kr/; Study Accession A1-2011-0147; A1-2012-0351; A1-2013-0220). Sociocentric network data will be available to approved researchers who submit a research protocol through the website https://snnlab.yonsei.ac.kr/projectsdata. A codebook for major in-person questionnaire items is available both in Korean and English on the KOSSDA (https://doi.org/10.22687/KOSSDA-A1-2011-0147-V1.3). Additionally, more information, including data access guidelines, study descriptions, and publications, can be accessed at https://snnlab.yonsei.ac.kr/.
We thank the KSHAP participants and team members for their contributions.
The authors of this article are solely responsible for the content, and the publication of this article shall not constitute any representation by the Editors, the Johns Hopkins Bloomberg School of Public Health, the Society for Epidemiologic Research, or Oxford University Press.
Conflict of interest: none declared.
REFERENCES
Berkman
LF
,
Glass
T
,
Brissette
I
, et al.
From social integration to health: Durkheim in the new millennium
.
Soc Sci Med
.
2000
;
51
(
6
):
843
–
857
.
Cobb
S
.
Social support as a moderator of life stress
.
Psychosom Med
.
1976
;
38
(
5
):
300
–
314
.
Smith
KP
,
Christakis
NA
.
Social networks and health
.
Annu Rev Sociol
.
2008
;
34
(
1
):
405
–
429
.
Berkman
LF
,
Syme
SL
.
Social networks, host resistance, and mortality: a nine-year follow-up study of Alameda County residents
.
Am J Epidemiol
.
1979
;
109
(
2
):
186
–
204
.
Steptoe
A
,
Shankar
A
,
Demakakos
P
, et al.
Social isolation, loneliness, and all-cause mortality in older men and women
.
Proc Natl Acad Sci
.
2013
;
110
(
15
):
5797
–
5801
.
Perkins
JM
,
Subramanian
S
,
Christakis
NA
.
Social networks and health: a systematic review of sociocentric network studies in low- and middle-income countries
.
Soc Sci Med
.
2015
;
125
:
60
–
78
.
Feinleib
M
,
Kannel
WB
,
Garrison
RJ
, et al.
The Framingham Offspring Study. Design and preliminary data
.
Prev Med
.
1975
;
4
(
4
):
518
–
525
.
Dong
X
,
Chang
ES
.
Social networks among the older Chinese population in the USA: findings from the PINE study
.
Gerontology
.
2017
;
63
(
3
):
238
–
252
.
Suzman
R
.
The National Social Life, Health, and Aging Project: an introduction
.
J Gerontol Ser B Psychol Sci Soc Sci.
2009
;
64
(
suppl 1
):
i5
–
i11
.
Gómez-Olivé
FX
,
Montana
L
,
Wagner
RG
, et al.
Cohort profile: Health and Ageing in Africa: a Longitudinal Study of an INDEPTH community in South Africa (HAALSI)
.
Int J Epidemiol
.
2018
;
47
(
3
):
689
–
90j
.
Hong
N
,
Kim
KJ
,
Lee
SJ
, et al.
Cohort profile: Korean Urban Rural Elderly (KURE) study, a prospective cohort on ageing and health in Korea
.
BMJ Open
.
2019
;
9
(
10
):e031018.
Shim
JS
,
Song
BM
,
Lee
JH
, et al.
Cardiovascular and Metabolic Diseases Etiology Research Center (CMERC) cohort: study protocol and results of the first 3 years of enrollment
.
Epidemiol Health
.
2017
;
39
:e2017016.
Siciliano
MD
,
Yenigun
D
,
Ertan
G
.
Estimating network structure via random sampling: cognitive social structures and the adaptive threshold method
.
Soc Netw.
2012
;
34
(
4
):
585
–
600
.
Costenbader
E
,
Valente
TW
.
The stability of centrality measures when networks are sampled
.
Soc Netw
.
2003
;
25
(
4
):
283
–
307
.
Marsden
PV
.
Egocentric and sociocentric measures of network centrality
.
Soc Netw.
2002
;
24
(
4
):
407
–
422
.
Simpson
CR
.
On the structural equivalence of coresidents and the measurement of village social structure
.
Soc Netw.
2020
.
Kim
DA
,
Benjamin
EJ
,
Fowler
JH
, et al.
Social connectedness is associated with fibrinogen level in a human social network
.
Proc Biol Sci
.
2016
;
1837
(
283
):20160958.
Shakya
HB
,
Christakis
NA
,
Fowler
JH
.
Association between social network communities and health behavior: an observational sociocentric network study of latrine ownership in rural India
.
Am J Public Health
.
2014
;
104
(
5
):
930
–
937
.
Li
X
,
Kawachi
I
,
Buxton
OM
, et al.
Social network analysis of group position, popularity, and sleep behaviors among US adolescents
.
Soc Sci Med
.
2019
;
232
:
417
–
426
.
Christakis
NA
,
Fowler
JH
.
The spread of obesity in a large social network over 32 years
.
N Engl J Med
.
2007
;
357
(
4
):
370
–
379
.
Christakis
NA
,
Fowler
JH
.
The collective dynamics of smoking in a large social network
.
N Engl J Med
.
2008
;
358
(
21
):
2249
–
2258
.
Rosenquist
JN
,
Murabito
J
,
Fowler
JH
, et al.
The spread of alcohol consumption behavior in a large social network
.
Ann Intern Med
.
2010
;
152
(
7
):
426
–
433
.
Fowler
JH
,
Christakis
NA
.
Dynamic spread of happiness in a large social network: longitudinal analysis over 20 years in the Framingham Heart Study
.
BMJ
.
2008
;
337
:a2338.
Bearman
PS
,
Moody
J
,
Stovel
K
.
Chains of affection: the structure of adolescent romantic and sexual networks
.
Am J Sociol
.
2004
;
110
(
1
):
44
–
91
.
Cornwell
B
,
Schumm
LP
,
Laumann
EO
, et al.
Social networks in the NSHAP study: rationale, measurement, and preliminary findings
.
J Gerontol Ser B Psychol Sci Soc Sci
.
2009
;
64
(
suppl 1
):
47
–
55
.
Cornwell
B
.
Good health and the bridging of structural holes
.
Soc Netw.
2009
;
31
(
1
):
92
–
103
.
Cornwell
EY
,
Waite
LJ
.
Social disconnectedness, perceived isolation, and health among older adults
.
J Health Soc Behav
.
2009
;
50
(
1
):
31
–
48
.
Schafer
MH
,
Upenieks
L
.
Functional disability and the role of children in US older adults’ core discussion networks
.
Netw Sci
.
2021
;
9
(
2
):
194
–
212
.
Kwak
S
,
Joo
WT
,
Youm
Y
, et al.
Social brain volume is associated with in-degree social network size among older adults
.
Proc Biol Sci.
1871
;
2018
(
285
):20172708.
Kong
YX
,
Shi
GY
,
Wu
RJ
, et al.
K-core: theories and applications
.
Phys Rep
.
2019
;
832
:
1
–
32
.
Seidman
SB
.
Network structure and minimum degree
.
Soc Netw.
1983
;
5
(
3
):
269
–
287
.
Joo
WT
,
Kwak
S
,
Youm
Y
, et al.
Brain functional connectivity difference in the complete network of an entire village: the role of social network size and embeddedness
.
Sci Rep
.
2017
;
7
(
1
):
1
–
12
.
Lee
JM
,
Lee
WJ
,
Kim
HC
, et al.
The Korean Social Life, Health and Aging Project—health examination cohort
.
Epidemiol Health.
2014
;
36
:e2014003.
Youm
Y
,
Laumann
EO
,
Ferraro
KF
, et al.
Social network properties and self-rated health in later life: comparisons from the Korean Social Life, Health, and Aging Project and the National Social Life, Health and aging project
.
BMC Geriatr
.
2014
;
14
(
1
):
102
–
116
.
Zerubavel
N
,
Bearman
PS
,
Weber
J
, et al.
Neural mechanisms tracking popularity in real-world social networks
.
Proc Natl Acad Sci
.
2015
;
112
(
49
):
15072
–
15077
.
Williams
KD
,
Jarvis
B
.
Cyberball: a program for use in research on interpersonal ostracism and acceptance
.
Behav Res Methods
.
2006
;
38
(
1
):
174
–
180
.
Cacioppo
S
,
Frum
C
,
Asp
E
, et al.
A quantitative meta-analysis of functional imaging studies of social rejection
.
Sci Rep
.
2013
;
3
(
1
):
1
–
3
.
Cornwell
B
.
Network bridging potential in later life: life-course experiences and social network position
.
J Aging Health
.
2009
;
21
(
1
):
129
–
154
.
Youm
Y
,
Baldina
E
,
Baek
J
.
All-cause mortality and three aspects of social relationships: an eight-year follow-up of older adults from one entire Korean village
.
Sci Rep
.
2021
;
11
(
1
):
1
–
11
.
Moon
S
,
Kim
YJ
,
Han
S
, et al.
The Korea Biobank Array: design and identification of coding variants associated with blood biochemical traits
.
Sci Rep.
2019
;
9
(
1
):
1
–
11
.
Kweon
S
,
Kim
Y
,
Jang
MJ
, et al.
Data Resource Profile: The Korea National Health and Nutrition Examination Survey (KNHANES)
.
Int J Epidemiol.
2014
;
43
(
1
):
69
–
77
.
Park
KS
,
Park
YR
,
Youm
Y
.
The effects of social participation on health related quality of life among rural elderly
.
Mental Health Soc Welfare J.
2015
;
43
(
2
):
200
–
227
.
Park
KS
,
Park
YR
,
Youm
Y
.
Social network type and well-being in Korean rural elderly
.
Elder Welfare Res J.
2017
;
72
(
1
):
151
–
177
.
Youm
Y
,
Sung
K
.
Self-rated health and global network position: results from the older adult population of a Korean rural village
.
Ann Geriatr Med Res.
2016
;
20
(
3
):
149
–
159
.
Sohn
SY
,
Joo
WT
,
Kim
WJ
, et al.
Social network types among older Korean adults: associations with subjective health
.
Soc Sci Med.
2017
;
173
:
88
–
95
.
Yim
J
,
Kim
H
,
Youm
Y
.
The effect of social support and conflict in different types of relationships on depression and suicidal ideation among the young-old and the old-old
.
Korean J Clin Psychol.
2016
;
35
(
3
):
645
–
657
.
Baek
J
,
Youm
Y
,
Kim
HC
.
Gender differences in the longitudinal association between husbands’ and wives’ depressive symptoms among Korean older adults: the moderating effects of the spousal relationship
.
Qual Life Res.
2021
;
30
:
3535
–
3546
.
Kang
S
,
Kim
H
,
Youm
Y
.
Influence of social activity on cognitive function in older adults: moderating effects of education
.
Korean Psychol Assoc.
2016
;
35
(
4
):
563
–
587
.
Lee
S
,
Lee
S
,
Lee
E
, et al.
Gender differences in social network of cognitive function among community-dwelling older adults
.
Geriatr Gerontol Int.
2020
;
20
(
5
):
467
–
473
.
Baek
J
,
Hur
NW
,
Kim
HC
, et al.
Sex-specific effects of social networks on the prevalence, awareness, and control of hypertension among older Korean adults
.
J Geriatr Cardiol.
2016
;
13
(
7
):
580
–
586
.
Hur
NW
,
Kim
HC
,
Waite
L
, et al.
Is the relationship between depression and C reactive protein level moderated by social support in elderly? Korean Social Life, Health, and Aging Project (KSHAP)
.
Psychiatry Investig.
2018
;
15
(
1
):
24
–
33
.
Cho
HY
,
Jung
YS
,
Heo
HJ
, et al.
Relationship of loneliness and subjective chewing discomfort in the elderly
.
J Korean Acad Oral Health.
2020
;
44
(
2
):
85
–
90
.
Lee
WJ
,
Youm
Y
,
Rhee
Y
, et al.
Social network characteristics and body mass index in an elderly Korean population
.
J Prev Med Public Health.
2013
;
46
(
6
):
336
–
345
.
Hyon
R
,
Youm
Y
,
Kim
J
, et al.
Similarity in functional brain connectivity at rest predicts interpersonal closeness in the social network of an entire village
.
Proc Natl Acad Sci.
2020
;
117
(
52
):
33149
–
33160
.
Won
CE
,
Yang
KY
,
Rho
YG
, et al.
The development of Korean activities of daily living (K-ADL) and Korean instrumental activities of daily living (K-IADL) scale
.
J Korean Geriatr Soc.
2002
;
6
(
2
):
107
–
120
.
Noh
S
,
Kaspar
V
,
Chen
X
.
Measuring depression in Korean immigrants: assessing validity of the translated Korean version of CES-D scale
.
Cross-Cult Res.
1998
;
32
(
4
):
358
–
377
.
Kee
BS
.
A preliminary study for the standardization of geriatric depression scale short form-Korea version
.
J Korean Neuropsychiatr Assoc.
1996
;
35
(
2
):
298
–
307
.
Kim
TH
,
Jhoo
JH
,
Park
JH
, et al.
Korean version of Mini Mental Status Examination for dementia screening and its short form
.
Psychiatry Investig.
2010
;
7
(
2
):
102
–
108
.
© The Author(s) 2023. Published by Oxford University Press on behalf of the Johns Hopkins Bloomberg School of Public Health. All rights reserved. For permissions, please e-mail: [email protected].
Topic:
- aging
- biological markers
- follow-up
- genotype
- hair
- korea
- social sciences
- brain imaging
- older adult
- social networks
- wave - physical agent
- south korea
- social epidemiology