Possible determinants and spatial patterns of anaemia among young children in Nigeria: a Bayesian semi-parametric modelling (original) (raw)
Journal Article
a
Centre for Regional Development and Planning (CEDEPLAR), Universidade Federal de Minas Gerais, Belo Horizonte, Brazil
Search for other works by this author on:
b
PLAN-Health Project, Management Sciences for Health, Abuja, Nigeria
Search for other works by this author on:
c
Planning, Research and Statistics Directorate, National Agency for Food and Drug Administration and Control, Abuja, Nigeria
Search for other works by this author on:
Present address: Department of Mathematical Sciences, Redeemer's University, Redemption City, Nigeria
Revision received:
12 November 2013
Accepted:
20 November 2013
Published:
31 January 2014
 PDF
PDF Cite
Ezra Gayawan, Ekundayo D. Arogundade, Samson B. Adebayo, Possible determinants and spatial patterns of anaemia among young children in Nigeria: a Bayesian semi-parametric modelling, International Health, Volume 6, Issue 1, March 2014, Pages 35–45, https://doi.org/10.1093/inthealth/iht034
Close
Navbar Search Filter Mobile Enter search term Search
Abstract
Background
Anaemia is a global public health problem affecting both developing and developed countries with major consequences for human health and socioeconomic development. This paper examines the possible relationship between Hb concentration and severity of anaemia with individual and household characteristics of children aged 6–59 months in Nigeria; and explores possible geographical variations of these outcome variables.
Methods
Data on Hb concentration and severity of anaemia in children aged 6–59 months that participated in the 2010 Nigeria Malaria Indicator Survey were analysed. A semi-parametric model using a hierarchical Bayesian approach was adopted to examine the putative relationship of covariates of different types and possible spatial variation. Gaussian, binary and ordinal outcome variables were considered in modelling.
Results
Spatial analyses reveal a distinct North-South divide in Hb concentration of the children analysed and that states in Northern Nigeria possess a higher risk of anaemia. Other important risk factors include the household wealth index, sex of the child, whether or not the child had fever or malaria in the 2 weeks preceding the survey, and children under 24 months of age.
Conclusions
There is a need for state level implementation of specific programmes that target vulnerable children as this can help in reversing the existing patterns.
Introduction
Anaemia has been identified as one of the major causes of morbidity and mortality among young children (especially under the age of 5 years), in most developing countries, particularly in Africa. It is considered as a low level of functional Hb in the blood, which decreases the amount of oxygen reaching the tissues and organs of the body, thereby inhibiting their capacity to function effectively. Anaemia results when the Hb level is significantly depressed to result in a Hb or haematocrit below the 90% or 95% of the range of a healthy reference sample of the same age and sex.1 Since all human cells depend on oxygen for survival, anaemia in children can lead to severe health consequences, including impaired cognitive and motor development, stunted growth, and increased morbidity from infectious diseases.2 There are several types of anaemia which are produced by a variety of underlying causes. The inadequate intake of iron, folate, vitamin B12 or other nutrients accounts for the majority of cases of anaemia in many populations.2,3 The likely cause(s) of anaemia in children varies according to the area of the world in which the child lives. Overall, iron deficiency is the most common cause of anaemia. However, in developing countries, infectious diseases such as malaria, helminthic infections, HIV and tuberculosis are also important causes.4,5 The presence of anaemia in children under the age of 5 can negatively impact on their mental development and future social performance. Children suffering from iron deficiency anaemia, during their first 2 years of life have slower cognitive development, poorer school performance and poorer work capacity in later years.6,7 The most severe health effect of anaemia, which is the increased risk of maternal and child mortality due to severe anaemia, has been well documented.8,9
The WHO has recommended specific Hb levels below which a child is specified as having anaemia. Children aged 6–59 months are considered anaemic if their Hb concentration levels are below 11.0 g/dl. In a normal population, 2.5% of the population would be expected to fall below this threshold. Hence, iron deficiency anaemia would be considered a public health problem when the prevalence of Hb concentration exceeds 5.0% of the population. WHO regional estimates generated on anaemia for pre-school age children, pregnant and non-pregnant women indicate that the highest proportion of individuals affected by anaemia is in Africa (47.5–67.6%).2 In Nigeria, according to the UNICEF 1993 participatory information collection (PIC) studies, the prevalence for anaemia in mothers is 24%. The highest prevalence of anaemia in children was recorded in South Eastern Nigeria (49.6%) and the lowest (10.5%) in North Eastern Nigeria.10 Several other studies have documented evidence of high prevalence of anaemia in children of school age across some regions in Nigeria.11,12
It is known that some key social determinants, especially social and demographic factors such as a mother's education, wealth index, and family size, can affect various medical conditions. Studies that examine the prevalence and/or determinants of anaemia, at a national level in Nigeria, have not been adequately undertaken. Moreover, no attempt has been made to unravel the spatial pattern of Hb concentration and anaemic status of children after taking into account other possible determinants. Although the distribution of the risk of anaemia in pre-school children after adjusting for nutritional status, parasitic infections and other individual variables in West African countries has been mapped, the work was limited to Burkina Faso, Ghana and Mali.13 Available reports on the geographical distribution of anaemia across Nigeria are based on the six geopolitical regions and show the existence of geographical variation. This has been found to be too coarse to allow for detailed discussions of spatial effects, as spatial effects of states within the same region can vary widely.14 Therefore, this paper aims to examine the possible relationship between Hb concentration and severity of anaemia with individual and household characteristics of children aged 6-59 months; and the possible geographical variations of these outcome variables at a highly disaggregated state level in Nigeria. A Bayesian geoadditive modelling technique, which is a flexible approach that allows for joint modelling of fixed effects, nonlinear effects of metrical covariate and spatial effect, while at the same time controlling for the hierarchical nature of the data via random effects, was adopted.
Methods
Data
This study relies on data available from the 2010 Nigeria Malaria Indicator Survey (NMIS). With technical assistance from ICF International through Measure DHS, the nationally representative survey was implemented by the National Population Commission (NPC) and the National Malaria Control Programme (NMCP), alongside other malaria implementing partners. The survey was designed to provide information on malaria indicators and malaria prevalence at national and state level. Due to the strong association between anaemia and malaria, the NMIS included anaemia testing for children aged 6–59 months.
Samples were realised through a two-stage probability sampling. At the first stage, 240 clusters consisting of 83 in urban and 157 in rural areas were selected from the sampling frame used during the 2006 Population and Housing Census of the Federal Republic of Nigeria. The final sample included 239 clusters because access to one of the clusters was prevented by inter-communal disturbances. Within each state, the number of households was distributed proportionately between urban and rural areas in accordance with the 2006 Nigeria Population Census. A complete listing of households was conducted, and a mapping exercise of each cluster was carried out from August through to September 2010. At the second stage, an average of 26 households was selected in each cluster by equal probability sampling. A total of 6197 households were selected, and of these, 5986 were occupied. Of the occupied households, 5895 were successfully interviewed, yielding a response rate of 99%. All children aged 6-59 months in these households were eligible to be tested for malaria and anaemia. After obtaining informed consent from the child's parent or guardian, blood samples were requested and collected using a microcuvette to obtain a drop of blood from a finger prick or a heel prick in the case of young children with small fingers. Hb analysis was carried out on site using a battery-operated HemoCue analyser (HemoCue AB, Angelholm, Sweden), which produces a result within a minute. Data on Hb level and anaemic status from the survey was available for 5074 children. Other questions included in the survey were place of residence (urban or rural), mother's educational level, household wealth index, sex of the child, age of the child, number of household members, whether child had malaria or fever in the last 2 weeks before the survey or not, geographical region and state of residence and these were used in this study. Administratively, Nigeria is divided into six geopolitical zones with each comprising of at least six states (totalling 36 altogether) and a Federal Capital Territory (FCT), Abuja. Figure 1 presents the map of Nigeria showing the location of the states within the geographical zones and the FCT.
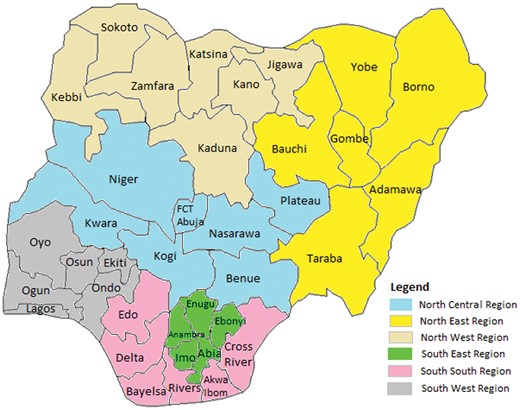
Figure 1.
Map of Nigeria showing the 36 states and Federal Capital Territory (FCT), Abuja.
Data analysis
A semi-parametric approach within the Bayesian framework was adopted to examine the influence of covariates of different types and geographical locations of the child on Hb level and anaemic status (or severity of anaemia) while, at the same time, controlling for the hierarchical nature of the data as a result of the multistage selection technique that was used. Three outcome variables were considered in this study. First, continuous Hb level of the children was considered and modelled assuming a Gaussian distribution to the response variable. Second, a dichotomous variable that classifies children into anaemic or normal was explored. This follows a Binomial distribution whose dependence and effect on a predictor of interest can be modelled either through a probit or logit link model. We choose the probit link in this study. The third outcome variable considered was a four-level ordered categorical variable that categorised children according to the severity of anaemia: severe anaemic, moderate anaemic, mild anaemic and not anaemic (normal). The dependence of this variable was modelled assuming a cumulative probit model.
The regression problem was considered with observations (y i , x i , s i , v i , r ij), _i_=1, …, 5074; _j_=1, 2 with y i being continuous, binary or ordered categorical; x i, the metrical covariate effect of child's age, _s_∈{1,…,37}; the spatial covariate of the district (state) where the child resided in Nigeria during the survey. A further categorical covariate vector _v_=(v i1,…, v ik)' whose effect was modelled parametrically. Let r i1 and r i2 further represent community and household random effects, respectively. Detailed description of these outcome variables are presented as y i1, y i2 and y i3 below. Modelling anaemia status using three different outcome variables rather than limiting to Hb level, would provide insight that might otherwise remain unknown and this provides an opportunity for public health researchers and policy makers with tools for evidence-based and informed decision making. In a similar study in Kenya, Gaussian and binary response variables were considered.15
The response variable, y i, can be considered as a realisation of some latent variable ui = ηi + ɛi where ηi is the predictor and ɛi is the error term. The influence of covariates of various types can be modelled in a semi-parametric form, using geoadditive predictors, thus:
(1)
where f(xi), fspat(si) and γ represent the unknown nonlinear smoothing effects of metrical covariate x (child's age), spatial effect and a vector of fixed effect parameters, respectively.16,17
In assessing the influence of the identified covariates on anaemic status for Nigerian children, the following models were examined:
Model 1: Anaemia is a product of low level of functional Hb in the blood. Hence, the concentration of Hb in the blood was considered as continuous variable (i.e. y i1) and modelled by assuming a Gaussian distribution.
Model 2: According to WHO, children aged 6-59 months are considered anaemic if their Hb concentration levels are below 11.0 g/dl. Thus, a binary response variable (y i2) was created as
Model 3: The severity of anaemia in a child can vary based on the concentration of Hb level. The level of anaemia in a child can be classified as being severe, moderate, mild or normal resulting in a four ordered categories. The response variable (y i3) in this case was constructed thus:
In an attempt to examine the influence of covariates, all analyses were based on predictor (1). For model 2, influence of determinants was modelled through a binary model assuming a probit link within a Bayesian perspective. Results using the probit model are qualitatively very similar to logit estimates and there are considerable computational advantages using the probit link based on latent variables.18 For the multicategorical outcome, a cumulative probit approach was adopted in fitting the model. It is postulated that the outcome variable could be obtained through a threshold mechanism.
Within the Bayesian framework, all parameters and functions are assumed as random variables upon which appropriate priors are assigned. Diffuse priors were assumed for the fixed effect parameters γ. For the unknown (smooth) functions, the Bayesian perspective of penalised splines (P-splines) was adopted.19,20 The P-splines allows for nonparametric estimation of f as a linear combination of basic functions (B-splines), i.e. where Bj(z) are B-splines and the coefficients βj are further defined to follow a first or second order random walk prior. In this case study, we assumed a second order random walk, i.e. βj = 2_β_ j_−1–_β _j_−2 + ɛt with Gaussian error ɛt ∼ N (0,τ_ɛ_2). The variance τ_ɛ_2 controls for the smoothness of f. The structured spatial effect (si) was modelled by assuming the intrinsic conditional autoregressive (CAR) prior which introduces a neighbourhood structure for the areas s i, s ∈{1,…,37}.19,20 This prior defines areas as neighbours if they share a common boundary and neighbouring areas are assumed to have similar patterns, such that the mean of area i is assumed to be an average of neighbouring areas, with variance as a function of neighbours and spatial variance. The random effect terms were estimated using exchangeable normal priors rij ∼ N(0,τ_b_2) where τ_b_2 is a variance component that incorporates over-dispersion and heterogeneity.
Bayesian inference was based on linear mixed model representation where the variance components τ_ɛ_2, corresponding to the inverse smoothing parameters in a frequentist approach, are estimated via restricted maximum likelihood/marginal likelihood estimation. In the mixed model representation, a variance components model is obtained with the variance considered as unknown constants to be estimated from their marginal likelihood. The regression coefficients are estimated via the modified Fisher scoring yielding posterior mode estimates. Detailed information about the modelling approach of space-time data via restricted maximum likelihood can be found in Kneib and Fahrmeir21 and has also been implemented in BayesX: a software for Bayesian analysis using Markov chain Monte Carlo and restricted maximum likelihood techniques.22 All analyses were performed using BayesX version 2.1.
Results
Descriptive analysis
Table 1 presents the findings of the descriptive analysis of biosocial and demographic characteristics of the households interviewed in this survey. The table shows that 239/5074 (4.7%) of all the children had severe anaemia while 2052/5074 (40.4%) had moderate anaemia. The average Hb for all the children is 12.0 g/dl (95% CI 11.7 to 12.4 g/dl). Altogether, 3687/5074 (72.7%) of the respondents resided in rural areas while 1387/5074 (27.3%) lived in urban areas. This corroborates the true reflection of the urban-rural residence in Nigeria that shows that almost three quarters of the population predominately reside in rural areas. Findings show a disproportionate prevalence of anaemia in Nigeria among children living in rural areas compared with their counterparts residing in urban areas. Of all the children surveyed, 204/3687 (5.5%) of those in rural areas compared with 35/1387 (2.5%) of those in urban areas were severely anaemic. Similarly, 1609/3687 (43.6%) of children in rural areas compared with 443/1387 (31.9%) of those in urban areas were moderately anaemic. The mean Hb level was, however, a little lower among children who resided in urban areas (11.1 g/dl) than for those in rural areas (12.3 g/dl). Across the geopolitical zones, the prevalence of severe anaemia was highest for children from the South South zone 68/963 (7.1%), followed by the North West, North East and South West with an equal prevalence of 63/1183, 48/908 and 26/486 respectively (5.3%). The lowest prevalence of severe anaemia 16/889 (1.8%) and the highest mean Hb level [22.0 g/dl (95% CI 20.2 to 23.9 g/dl)] was observed in the North Central region of the country.
Table 1.
Results of descriptive analysis for the demographic and biosocial characteristics of respondents
| Variables | No of children (%) | Mean Hb g/dL (95% CI) | Anaemia prevalence (%)a | |||
|---|---|---|---|---|---|---|
| Severe | Moderate | Mild | Normal | |||
| Total | 5074 (100) | 12.0 (11.7, 12.4) | 4.7 | 40.4 | 24.3 | 30.6 |
| Region | ||||||
| North Central | 889 (17.5) | 22.0 (20.2, 23.9) | 1.8 | 24.7 | 27.9 | 45.6 |
| North East | 908 (17.9) | 10.3 (10.2, 10.4) | 5.3 | 32.6 | 23.7 | 38.4 |
| North West | 1183 (23.3) | 9.7 (9.6, 9.8) | 5.3 | 50.5 | 19.9 | 24.3 |
| South East | 645 (12.7) | 10.1 (9.9, 10.2) | 2.8 | 42.2 | 27.3 | 27.7 |
| South South | 963 (18.9) | 9.5 (9.4, 9.6) | 7.1 | 49.7 | 24.3 | 28.9 |
| South West | 486 (9.6) | 10.1 (9.9, 10.2) | 5.3 | 38.7 | 25.1 | 30.9 |
| Place of residence | ||||||
| Urban | 1387 (27.3) | 11.1 (10.7, 11.5) | 2.5 | 31.9 | 27.1 | 38.4 |
| Rural | 3687 (72.7) | 12.3 (11.9, 12.8) | 5.5 | 43.6 | 23.2 | 27.7 |
| Mother's education | ||||||
| No education | 2733 (53.8) | 11.8 (11.3, 12.3) | 5.8 | 42.3 | 22.4 | 29.5 |
| Primary | 898 (17.7) | 12.6 (11.7, 13.6) | 4.5 | 40.8 | 24.6 | 30.1 |
| Secondary | 1233 (24.3) | 12.1 (11.4, 12.8) | 3.0 | 38.2 | 26.4 | 32.4 |
| Higher | 207 (4.1) | 11.6 (10.4, 12.9) | 1.4 | 28.5 | 34.5 | 35.7 |
| Missing | 3 (0.1) | |||||
| Wealth index | ||||||
| Poorest | 925 (18.2) | 13.7 (12.56, 14.8) | 5.9 | 42.2 | 21.5 | 30.4 |
| Poorer | 935 (18.4) | 14.1 (13.0, 15.3) | 7.3 | 39.1 | 22.4 | 31.2 |
| Middle | 1139 (22.5) | 10.5 (10.0, 10.9) | 5.4 | 45.6 | 22.7 | 26.3 |
| Richer | 1130 (22.3) | 11.0 (10.5, 11.6) | 3.5 | 41.9 | 26.4 | 28.2 |
| Richest | 945 (18.6) | 11.3 (10.8, 11.8) | 1.6 | 28.6 | 25 | 38.4 |
| Sex of child | ||||||
| Male | 2566 (50.6) | 11.8 (11.3, 12.3) | 5.0 | 41.9 | 24.7 | 28.4 |
| Female | 2508 (49.9) | 12.2 (11.7, 12.7) | 4.4 | 39.0 | 23.7 | 32.9 |
| Had fever in last 2 weeks | ||||||
| Yes | 3049 (60.1) | 13.1 (12.6, 13.7) | 7.5 | 49.0 | 21.4 | 22.1 |
| No | 1838 (36.2) | 10.2 (9.9, 10.9) | 3.1 | 35.2 | 25.7 | 36.0 |
| Missing | 187 (3.7) | |||||
| Had malaria in last 2 weeks | ||||||
| Yes | 1920 (37.8) | 12.8 (12.1, 13.6) | 7.7 | 49.4 | 21.7 | 21.2 |
| No | 3126 (61.6) | 11.5 (11.1, 11.9) | 2.9 | 35.0 | 25.8 | 36.3 |
| Missing | 28 (0.6) | |||||
| Number of household members | ||||||
| 2–4 | 1008 (19.9) | 12.1 (11.3, 12.9) | 5.9 | 38.5 | 24.1 | 31.5 |
| 5–6 | 1533 (30.2) | 12.2 (11.6, 12.9) | 4.7 | 42.4 | 23.5 | 29.4 |
| ≥7 | 2533 (49.9) | 11.7 (11.3, 12.3) | 3.9 | 38.5 | 25.6 | 32.0 |
| Child's age (in months) | ||||||
| 6–11 | 546 (10.8) | 12.1 (11.0, 13.3) | 5.1 | 49.3 | 20.5 | 25.1 |
| 12–23 | 1067 (21.0) | 11.6 (10.9, 12.4) | 8.2 | 48.3 | 21.9 | 21.6 |
| 24-35 | 1096 (21.6) | 11.9 (11.1, 12.6) | 4.7 | 41.8 | 26.1 | 27.4 |
| 36-47 | 1134 (22.3) | 12.7 (11.9, 13.5) | 3.4 | 34.0 | 26.3 | 36.3 |
| 48-59 | 1231 (24.3) | 11.8 (11.2, 12.4) | 2.8 | 34.5 | 24.3 | 38.4 |
a Severe anaemia is defined as having Hb level below 8.0 g/dl; moderate anaemia as Hb level between 8.0–9.9 g/dl; mild anaemia as Hb level between 10.0–10.9 g/dl; Hb level ≥11.0 g/dl are considered normal.
As with other health indices, severe anaemia was directly associated with the mother's education. Of children whose mothers had no education, 159/2733 (5.8%) were severely anaemic and 1155/2733 (42.3%) moderately anaemic. The mean Hb level of children from these women was 11.8 g/dl (95% CI 11.3 to 12.3 g/dl). The majority of the children who were mildly anaemic had mothers who attained higher education. The wealth index, a composite measure of a household's collective living standard, places individual households on a continuous scale of relative wealth. A positive relationship between household wealth quintiles and severity of anaemia was evident. Descriptive analysis of prevalence of anaemia among the surveyed children showed a prevalence of 55/925 (5.9%) severe anaemia among children from the poorest households and about 7% (highest) among those from poorer households. From the poorer households, the prevalence of severe anaemia reduced as the scale moves to the richest quantum. The mean Hb level was highest among children from the poorer households (14.1 g/dl) while those from the middle wealth quintile had the lowest mean Hb (10.5 g/dl).
There seems to be no striking difference in terms of gender and the prevalence of anaemia in children: 129/2566 (5%) of male children tested had severe anaemia compared with 110/2508 (4.4%) of female children. About 3046/5074 (60.1%) of children had fever during the 2 weeks preceding the survey. Of these, 138/1838 (7.5%) had severe anaemia while another 900/1838 (49.0%) had moderate anaemia. Mean Hb was higher among these children (13.1 g/dl; 95% CI 12.6 to 13.7 g/dl) compared with those who did not have fever. About thirty-eight percent (1920/5074, 37.8%) (37.8%) were reported to have had malaria in the last 2 weeks preceding the survey. The prevalence of severe anaemia among these children was much higher 148/1920 (7.7%) than among those who did not have malaria during the time period 90/3126 (2.7%). Severe anaemia prevalence was highest 59/1008 (5.9%) in households with two to four members. As the number of household members increased, the prevalence of severe anaemia reduced. Moderate anaemia was highest among households with membership of between five and six 650/1533 (42.4%). Children aged between 12 and 23 months had the highest percentage of severe anaemia. Mean Hb was highest (12.7 g/dl) among those aged 36–47 months and lowest (11.6 g/dl) among those aged 12–23 months.
Results of the Bayesian hierarchical modelling
Results of fixed effects
Table 2 presents the results of the fixed effects from Bayesian Gaussian hierarchical model fitted to the Hb level of the children. Presented are the posterior modes and 95% credible intervals. Results show that the North Central zone, South East and South South zones were significantly associated with low Hb level while the North West zone was significantly associated with higher Hb level. Mean Hb of children who resided in urban areas was not significantly different from that of children who dwell in rural areas. Similarly, there was no evidence of significant difference in mean Hb of the children based on the educational level of their mothers. With regard to the wealth index, the mean Hb was significantly higher for those children from poorer households while its effect was not significant for those of the middle, richer and richest households. Mean Hb was higher among female children than in male children, though not significant. Also, there was no difference in mean Hb for children who had fever and malaria in the 2 weeks preceding the survey. Household membership did not also show any difference in mean Hb. The posterior mode for the community and household random effects were 5979 (95% CI 4.082 to 8.442) and 0.258 (95% CI 0.055 to 0.703), respectively.
Table 2.
Results of fixed effects for model 1 with Hb level considered as continuous and modelled as Gaussian model
| Variables | Post mode | SD | 95% credible interval |
|---|---|---|---|
| Constant | 10.634 | 0.407 | 9.837, 11.432 |
| Region | |||
| North Central (ref) | 0 | ||
| North East | 6.917 | 4.819 | −2.530, 16.364 |
| North West | 9.493 | 4.375 | 0.916, 18.070 |
| South East | −13.867 | 4.305 | −22.306, −4.152 |
| South South | −12.596 | 4.307 | −21.040, −4.152, |
| South West | −2.147 | 4.727 | −11.414, 7.120 |
| Place of residence | |||
| Rural (ref) | 0 | ||
| Urban | −0.223 | 0.285 | −0.782, 0.336 |
| Mother's education | |||
| No education (ref) | 0 | ||
| Primary | −0.036 | 0.347 | −0.716, 0.644 |
| Secondary | 0.469 | 0.319 | −0.157, 1.095 |
| Higher | −0.142 | 0.587 | −1.293, 1.010 |
| Wealth index | |||
| Poorest | 0 | ||
| Poorer | 0.947 | 0.359 | 0.244, 1.650 |
| Middle | −0.586 | 0.318 | −1.211, 0.038 |
| Richer | −0.465 | 0.341 | −1.134, 0.203 |
| Richest | −0.488 | 0.452 | −1.374, 0.398 |
| Sex of child | |||
| Male (ref) | 0 | ||
| Female | 0.179 | 0.144 | −0.104, 0.462 |
| Had fever in last 2 weeks | |||
| No (ref) | 0 | ||
| Yes | −0.18 | 0.16 | −0.495, 0.134 |
| Had malaria in last 2 weeks | |||
| No (ref) | 0 | ||
| Yes | 0.15 | 0.166 | −0.176, 0.476 |
| Number of household members | |||
| 2–4 | 0 | ||
| 5–6 | 0.033 | 0.219 | −0.396, 0.462 |
| ≥7 | 0.346 | 0.208 | −0.062, 0.755 |
| Random effects component | |||
| Community | 5.979 | 1.109 | 4.082, 8.442 |
| Household | 0.258 | 0.178 | 0.055, 0.703 |
Results of the binary and cumulative probit models are presented in Table 3. From the binary model, results show that the likelihood of being anaemic varies according to the geographical locations of the children. It was higher among children from the South East and South South zones compared with those from the North Central zone; while children from the North East were less likely to be anaemic compared with their counterparts from the North Central. Children from the richest households were significantly less likely to be anaemic compared with those from the poorest households. Results for the other wealth quintiles were not significant. Findings further revealed that female children were significantly less likely to be anaemic than their male counterparts. Children who had fever and those who had malaria in the 2 week period before the survey were significantly more likely to be anaemic than those who did not have these illnesses. However, the number of household membership, type of place of residence and mothers' educational attainment did not significantly affect the anaemic status of the children. The posterior mode for the community and household random effects were 0.056 (95% CI 0.027 to 0.096) and 0.002 (95% CI 0.001 to 0.005), respectively.
Table 3.
Results of fixed effects for models 2 and 3 with binary and cumulative probit models
| Variables | Binomial probit | Cumulative probit | ||||
|---|---|---|---|---|---|---|
| Post mode | SE | 95% credible interval | Post mode | SE | 95% credible interval | |
| Constant | 0.705 | 0.045 | 0.607, 0.794 | |||
| Region | ||||||
| North Central (ref) | 0 | 0 | ||||
| North East | −0.698 | 0.280 | −1.239, −0.140 | −0.601 | 0.277 | −1.145, −0.058 |
| North West | −0.249 | 0.254 | −0.746, 0.248 | −0.306 | 0.252 | −0.799, 0.188 |
| South East | 0.648 | 0.247 | 0.133, 1.103 | 0.615 | 0.246 | 0.133, 1.097 |
| South South | 0.797 | 0.248 | 0.311, 1284 | 0.745 | 0.246 | 0.263, 1.227 |
| South West | −0.034 | 0.276 | −0.577, 0.511 | 0.080 | 0.274 | −0.457, 0.616 |
| Place of residence | ||||||
| Rural (ref) | 0 | 0 | ||||
| Urban | −0.051 | 0.033 | −0.116, 0.015 | −0.051 | 0.032 | −0.113, 0.01 |
| Mother's education | ||||||
| No education (ref) | 0 | 0 | ||||
| Primary | −0.057 | 0.049 | −0.153, 0.038 | −0.021 | 0.04 | −0.099, 0.057 |
| Secondary | −0.003 | 0.044 | −0.090, 0.081 | 0.019 | 0.037 | −0.053, 0.091 |
| Higher | 0.042 | 0.081 | −0.116, 0.201 | −0.043 | 0.068 | −0.177, 0.091 |
| Wealth index | ||||||
| Poorest | 0 | 0 | ||||
| poorer | 0.040 | 0.050 | −0.058, 0.138 | 0.085 | 0.041 | 0.005, 0.166 |
| Middle | 0.083 | 0.045 | −0.004, 0.172 | 0.060 | 0.036 | −0.011, 0.131 |
| Richer | −0.014 | 0.048 | −0.107, 0.079 | −0.061 | 0.039 | −0.137, 0.015 |
| Richest | −0.213 | 0.061 | −0.332, −0.094 | −0.223 | 0.052 | −0.323, −0.121 |
| Sex of child | ||||||
| Male (ref) | 0 | 0 | ||||
| Female | −0.07 | 0.021 | −0.110, −0.030 | −0.053 | 0.017 | −0.086, −0.021 |
| Had fever in last 2 weeks | ||||||
| No (ref) | 0 | 0 | ||||
| Yes | 0.134 | 0.023 | 0.089, 0.180 | 0.15 | 0.018 | 0.119, 0.191 |
| Had malaria in last 2 weeks | ||||||
| No (ref) | 0 | 0 | ||||
| Yes | 0.257 | 0.024 | 0.210, 0.305 | 0.261 | 0.019 | 0.223, 0.299 |
| Household members | ||||||
| 2–4 | 0 | 0 | ||||
| 5–6 | −0.018 | 0.031 | −0.079, 0.042 | −0.042 | 0.025 | −0.092, 0.007 |
| ≥7 | 0.029 | 0.029 | −0.029, 0.087 | 0.025 | 0 .024 | −0.021, 0.072 |
| Random effects component | ||||||
| Community | 0.056 | 0.017 | 0.027, 0.096 | 0.063 | 0.015 | 0.035, 0.098 |
| Household | 0.002 | 0.012 | 0.001, 0.005 | 0.002 | 0.002 | 0.001, 0.007 |
| Threshold parameters | ||||||
| Θ1: Severe anaemic | NA | NA | NA | −0.724 | 0.043 | −0.807, −0.640 |
| Θ2: Moderate anaemic | NA | NA | NA | 0.045 | 0.042 | −0.037, 0.127 |
| Θ3: Mild anaemic | NA | NA | NA | 1.925 | 0.052 | 1.823, 2.027 |
Similar findings to the binary probit model were obtained for the cumulative probit model. However, results showed that children from poorer households were significantly more likely to be anaemic than those from the poorest households. Estimates of the threshold parameters θ1, θ2, and θ3 are for the categories as presented in Table 3 alongside the other fixed effects. For interpretation of the results of threshold parameters, higher (lower) values correspond to higher (less) likelihood of being anaemic. For instance, a negative sign of θ1 signifies a shift on the latent scale to the right side, yielding a lower probability for category severe anaemic while a positive sign of θ2 and θ3 signifies a shift on the latent scale to the left side, yielding a higher probability of moderate and mild anaemic categories.
Results of nonlinear effects
The nonlinear effects of child's age for the three models are shown in Figure 2 (a–c), illustrating the posterior modes and 95% credible intervals. Findings from the Gaussian model show that the Hb of the children has an approximately inverse ‘U’ shape that rises from age 6 months to peak around 40 months. A steady decline was noticed thereafter. The nonlinear effect of child's age has a similar pattern for both the binary and cumulative probit models. From a higher likelihood of being anemic around the age of 6 months, the likelihood reduces as the child advances in age.
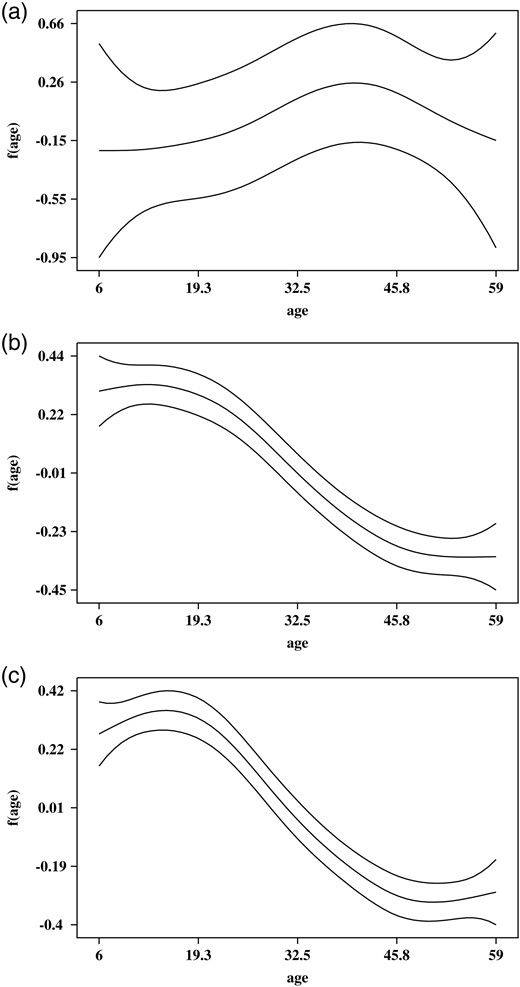
Figure 2.
Nonlinear effect of age (in months) for (a) Hb level; (b) model with binomial probit and (c) model with cumulative probit.
Results of spatial effect
Spatial effects for the three models are presented in Figure 3 (a–f). Presented are the maps of posterior modes (left panel) and the maps showing the locations of the 95% credible intervals (right panel), which are used in determining the significance of the estimates. From the maps of the credible intervals, states with white (black) colours are associated with significantly high (low) estimate (95% credible intervals lie in the positive [negative] side), while the estimates are not significant for states with grey colour (95% credible intervals include 0). There was evidence of a North-South divide in the Hb level of the children after adjusting for other covariates. For instance, findings from the Gaussian model revealed that children from the states in the southern region, particularly those from the South East and South South regions, were associated with significantly higher Hb level, while those from the northern states were associated with significantly lower Hb. However, the credible intervals of Hb of children from all the states in the South West (Ekiti, Lagos, Ogun, Ondo Osun and Oyo) and those in the North East regions (Adamawa, Bauchi, Borno, Gombe, Taraba and Yobe) include zero. Results of the binary model showed that four states, namely, Jigawa, Kano, Kwara and Yobe, had a significantly higher likelihood of being anaemic while Benue, Delta, Kogi, and Rivers states were significantly associated with non-anaemia (normal). Similar findings were obtained for the cumulative probit model. Results showed that Jigawa, Kebbi, Kwara, and Yobe states were significantly associated with a higher likelihood of being anaemic while neighbouring Anambra, Benue, Enugu, and Kogi states were significantly associated with non-anaemia (normal).
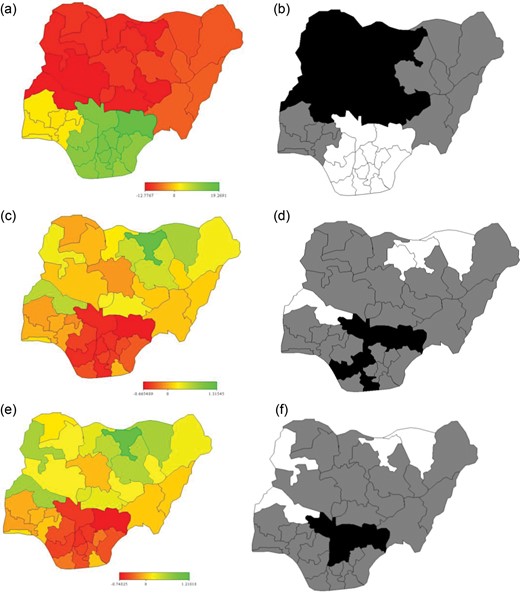
Figure 3.
Maps of Nigeria showing spatial effects of (a) Hb level (Gaussian model) and (b) its 95% credible interval; (c) binomial model and (d) its 95% credible interval; (e) cumulative probit model and (f) its 95% credible interval.
Discussion
The prevalence of anaemia is an important health indicator and when it is used with other measurements of iron status the Hb concentration can provide information about the severity of iron deficiency.23 Anaemia has constituted a public health problem and its determinants interact at different degrees in each individual. There is, therefore, a need for quantifying the residual spatial variation at a district level in Nigeria when investigating its determinants. A good understanding of possible determinants and geographical distribution of anaemia among young children is desirable in designing appropriate intervention strategies to reverse and turn the tide of all anaemia-related complications in this target group. The impact of social determinants on iron deficiency anaemia has been widely studied, and factors identified as having the greatest influence on the development of this deficiency are family and per capital income, maternal schooling, place of residence and household crowding.24,25 It is evident that socioeconomic status (SES) of households where children resided during the survey, was significantly associated with Hb concentration level and anaemic status in Nigeria. Children residing in the poorest and poorer SES were significantly associated with low Hb concentration level and have a higher likelihood of being anaemic. This finding is similar to what was discovered in other countries.25–28 In this study, our findings further corroborate that SES is a known determinant of anaemia status. Policy-makers should, therefore, consider comprehensive and integrated interventions that will enhance economic empowerment of both households and individuals in tackling the problem of anaemia if any meaningful impact is to be made. Furthermore, interventions on supplementary food fortification for children under the age of 5 years needs to be targeted towards those from poorer households.
Unlike findings from a study in Kenya where female school children were found to have lower mean Hb than males, findings from this study showed that female children have higher mean Hb, although it was not significant.15 We also found that female children were significantly less likely to be anaemic. This is similar to what was observed in other West African countries.13 In some Nigerian societies, parental gender preference still exists resulting in discriminatory practices against children of the less-desired sex. For instance, more preference is given to female children because of the perceived bride price to be earned when the child is to be given out in marriage. This affects the kind of care treatment that the children receive resulting in a skewed social, demographic and health consequences.29 Children who experienced episodes of malaria or fever 2 weeks prior the survey were significantly more likely to be anaemic than their counterparts who did not. This has been similarly reported.15 The process in which malaria and other parasitic infections affect anaemia is multi-factorial, involving a complexity of mechanisms, including increased destruction of red blood cells through rupturing, phagocytosis and hypersplenism, and decreased red blood cell production through inflammation and dyserythropiesis.30 Therefore, efforts should be focussed towards elimination, if not eradication, of malaria as an encompassing approach to addressing the problem of anaemia.
Maternal education is a known determinant of health of children. Maternal schooling is associated with the type of care that children receive, especially in a population like Nigeria where the majority of mothers are housewives. Educated mothers are more likely to know the type and proportion of food to give to their children. A higher level of education of the parent can also provide better work opportunities and consequently better income. This in turn allows for access to a better diet with improved quality and greater variety, and helps to improve the environment in which the child lives. However, in this study, maternal education was not significantly related with the concentration of Hb and likelihood of being anaemic in children between the ages of 6-59 months. This is likely due to the fact that iron-rich foods, such as weaning foods, depends more on cultural-related beliefs than on the level of maternal education. Similar findings were obtained in Mexico.7 This study did not provide evidence of an association between the place of residence and household crowding with Hb concentration of children and likelihood of being anaemic. This is perhaps due to other variables taken into consideration.
The non-linear effects of a child's age indicates a higher likelihood of them being anaemic for children below 24 months of age, thus, corroborating findings from other studies.24,31 Children experience intense growth and development in the first 2 years of life, generating a high demand for iron while being more susceptible to infections. This increased demand is not always met by their diet, especially in underprivileged households. After the age of 6 months when complementary feeding is introduced, diets offered to infants are predominantly milk-based and monotonous without important sources of iron or vitamin C. If additionally, weaning foods are often initially rejected by the infant, thereby exacerbating the risk of anaemia. Complementary foods given to them, which are largely cereal-based, usually contain very little bio-available iron, which has a significant independent effect on mean Hb levels and iron stores.26 As a result, infants over 6 months need supplementary sources of iron. As children grow older, their diets become more varied and increases in quantity, which can help in meeting their demand for iron.
Exploring possible geographical variations in Hb concentration and anaemicstatus avails policy-makers with tools to prioritise and roll out interventions in a more prudent manner. Findings from this study show significant geographical variation in the Hb concentration level as well as anaemic status of children in Nigeria. Children from Jigawa, Kebbi, Kwara, and Yobe states were significantly associated with higher chances of being anaemic, which should raise concerns of policy-makers in those states. Intervention efforts should be focussed toward reversing this pattern. Similarly, in those states that are associated with a lower likelihood of being anaemic, a need for behaviour maintenance interventions is needed to ensure that the success made is not eroded over time .
A close look at the results of the three models shows that the output for the binomial and cumulative probit models are consistent for the fixed, nonlinear and spatial effects. This also conforms with the Gaussian model which is based on the actual Hb level. While the Gaussian model suggests that the Hb level of the children increases as they grow older to peak at a certain age before declining, the binomial and cumulative models confirmed that the likelihood of being anaemic is higher among younger children compared with older ones. Similarly, the spatial effect revealed a North-South divide in the level of Hb for the Gaussian model. This implies that states in the northern part of Nigeria are associated with significantly lower Hb levels, which may lead to more children from this area being anaemic. This was further corroborated with the binomial and cumulative probit models that the likelihood of being anaemic is higher in some states in the North compared with the states in the South.
Limitations
As is the case with many cross-sectional data, causal relationship cannot be established with these data. Due to the fact that information in these data is self-reported, there is a tendency of recall-error or bias especially with issues related to age and episodes of fever or malaria in the children. In spite of these limitations, the authors believe that the findings from this study will enhance proper targeting for interventions and types of strategies.
Conclusions
The control of anaemia, especially among infants, can be achieved through a combination of various nutritional interventions such as micronutrient supplementation, food fortification and nutrition education to caregiver. Policy implications of these findings may include designing of interventions that target caregivers and mothers of infants, especially on the need for supplementary dietary considerations that are richer in bio-available iron when introducing infants to semi-solids. Also, there is need for state level implementation of nutritional supplementary support for children under 5 in all states in Nigeria, but most especially in states where there is a higher likelihood of children being anaemic. The control of anaemia is often overlooked; however, it is a cost-effective and strategic intervention with vast public health benefits that needs to be focused on before anaemia becomes a life-threatening issue that may increase morbidity and mortality of children under 5 years of age in Nigeria.
Authors’ contributions: EG and SBA conceptualised the modelling idea; EG performed the analyses; EG, EDA and SBA jointly drafted and revised the manuscript. All authors read and approved the final manuscript. SBA is guarantor of the paper.
Acknowledgments: The first author appreciates the support from the National Council for Scientific and Technological Development (CNPq) and Third World Academy of Science (TWAS) towards a postdoctoral fellowship during which this study was carried out. The authors appreciate Measure DHS, National Malaria Control Programme of the Federal Ministry of Health and its partners Samson B. Adebayo for granting the authors access to these data.
Funding: None.
Competing interests: None declared.
Ethical approval: Not required.
References
1
, . ,
Present knowledge in nutrition 8th edition
,
2001
Washington D.C
International Life Sciences Institute, ILSI Press
2
, , , et al.
WHO
,
Worldwide prevalence of anaemia 1993–2005: WHO global database on anaemia
Geneva, Switzerland
World Health Organization; 2008
3
WHO, Unicef
,
Focusing on anaemia: Towards an integrated approach for effective anaemia control
4
, , , et al. ,
Prevalence of iron deficiency with and without concurrent anaemia in population groups with high prevalences of malaria and other infections: a study in Côte d'Ivoire
,
Am J Clin Nutr
,
2001
, vol.
74
(pg.
776
-
82
)
5
UNICEF, UNN, WHO
,
Iron deficiency anaemia: Assessment, prevention, and control
6
, , , et al. ,
Assessment of the prevalence and potential determinants of nutritional anemia in Upper Egypt
,
Food Nutr Bull
,
1999
, vol.
20
(pg.
417
-
21
)
7
, , , et al. ,
Prevalence of anemia in children 1 to 12 years of age. Results from a nationwide probabilistic survey in Mexico
,
Salud pública de México
,
2003
, vol.
45
4
(pg.
s490
-
98
)
8
, . ,
Anaemia and iron-deficiency anaemia: compilation of data on pregnancy outcome
,
Am J Clin Nutr
,
1994
, vol.
59
(pg.
492S
-
500S
)
9
, . ,
Iron deficiency in women
,
1981
Washington DC
Nutrition Foundation
10
FGN, UNICEF
,
The nutritional status of women and children in Nigeria
,
1994
Lagos, Nigeria
Federal Government of Nigeria & UNICEF
11
, , . ,
Preoperative anaemia and blood transfusion requirements in children undergoing surgery under general anaesthesia at the University of Benin Teaching Hospital, Nigeria
,
Journal of Medicine in the Tropics
,
2011
, vol.
13
1
12
, , , et al. ,
Prevalence of moderate and severe anaemia in children under 5 in University of Nigeria Teaching Hospital Enugu, Southeast Nigeria
,
Pediatr Res
,
2011
, vol.
70
(pg.
489
-
98
)
13
, . ,
Mapping the risk of anaemia in preschool-age children: the contribution of malnutrition, malaria, and helminth infections in West Africa
,
PLoS Medicine
,
2011
, vol.
8
6
e1000438
14
NPC, NMCP, ICF International
,
Nigeria Malaria Indicator Survey 2010
,
2012
Abuja, Nigeria
National Population Commission [Nigeria], National Malaria Control Programme [Nigeria] and ICF International
15
, , , et al. ,
Relationship between anaemia and parasitic infections in Kenyan schoolchildren: A Bayesian hierarchical modelling approach
,
Int J Parasitol
,
2008
, vol.
38
(pg.
1663
-
71
)
16
, . ,
Generalized additive models
,
1990
London
Chapman and Hall
17
, . ,
Bayesian semiparametric regression analysis of multicategorical time-space data
,
Ann Inst Stat Math
,
2001
, vol.
53
(pg.
10
-
30
)
18
, . ,
Multivariate Statistical Modelling based on Generalized Linear Models (3rd ed)
,
2001
New York
Springer
19
, . ,
Bayesian inference for generalized additive mixed models based on markov random field priors
,
J R Stat Soc Ser C Appl Stat
,
2001
, vol.
50
(pg.
201
-
20
)
20
, . ,
Bayesian P-Splines
,
J Comput Graph Stat
,
2004
, vol.
13
(pg.
183
-
212
)
21
, . ,
Structured additive regression for categorical space-time data: a mixed model approach
,
Biometrics
,
2006
, vol.
62
(pg.
109
-
18
)
22
, , , et al. ,
BayesX – Software for Bayesian Inference in Structured Additive Regression Models
23
WHO
,
Haemoglobin concentrations for the diagnosis of anaemia and assessment of severity. Vitamin and Mineral Nutrition Information System
24
, , , et al. ,
Social and biological determinants of iron deficiency anemia
,
Cad. Saúde Pública
,
2011
, vol.
27
Supl. 2
(pg.
S309
-
S20
)
25
, , , et al. ,
Burden of anemia and its socioeconomic determinants among adolescent girls in India
,
Food Nutr Bull
,
2009
, vol.
30
3
(pg.
217
-
26
)
26
, , , et al. ,
Determinants of anemia among preschool children in the Philippines
,
J Am Coll Nutr
,
2008
, vol.
27
2
(pg.
229
-
43
)
27
, , , et al. ,
Malaria and anaemia among children in two communities of Kumasi, Ghana: a cross-sectional survey
,
Malar J
,
2006
, vol.
5
105
28
, , , et al. ,
The prevalence of nutritional anemia in pregnancy in an east Anatolian province, Turkey
,
BMC Public Health
,
2010
, vol.
10
329
29
. ,
Variations in attitudinal gender preferences for children across 50 less-developed countries
,
Demogr Res
,
2010
, vol.
23
36
(pg.
1031
-
48
)
30
, , . ,
Malaria-related iron deficiency disease in children
,
Parasitology Today
,
2000
, vol.
16
469–76
31
, , . ,
Risk factors for moderate to severe anemia among children in Benin and Mali: insights from a multilevel analysis
,
Food Nutr Bull
,
2007
, vol.
28(1)
(pg.
76
-
89
)
Author notes
1
Present address: Department of Mathematical Sciences, Redeemer's University, Redemption City, Nigeria
© The Author 2014. Published by Oxford University Press on behalf of Royal Society of Tropical Medicine and Hygiene. All rights reserved. For permissions, please e-mail: [email protected].
I agree to the terms and conditions. You must accept the terms and conditions.
Submit a comment
Name
Affiliations
Comment title
Comment
You have entered an invalid code
Thank you for submitting a comment on this article. Your comment will be reviewed and published at the journal's discretion. Please check for further notifications by email.
Advertisement intended for healthcare professionals
Advertisement intended for healthcare professionals