The Impact of Instant Coffee and Decaffeinated Coffee on the Gut Microbiota and Depression-Like Behaviors of Sleep-Deprived Rats (original) (raw)
Abstract
Objective:
Based on our previous research, chronic paradoxical sleep deprivation (PSD) can cause depression-like behaviors and microbial changes in gut microbiota. Coffee, as the world’s most popular drink for the lack of sleep, is beneficial to health and attention and can eliminate the cognitive sequelae caused by poor sleep. The purpose of this study is to investigate the effects of coffee and decaffeinated coffee on PSD rats.
Research Design and Methods:
A total of 32 rats were divided into four groups: control group, PSD model group, conventional coffee group, and decaffeinated coffee group. Behavioral tests, including sucrose preference test, open field test, forced swimming test, and tail suspension test, as well as biochemical detection for inflammatory and antioxidant indexes were performed. The effects of coffee and decaffeinated coffee on the gut microbiota of PSD rats were investigated by 16S rRNA gene sequencing.
Results:
Coffee and decaffeinated coffee significantly improved the depression-like behaviors. Moreover, the serum levels of interleukin-6 and tumor necrosis factor alpha were decreased in both coffee and decaffeinated coffee groups, as well as the levels of superoxide dismutase and GSH-Px were increased. Gut microbiota analysis revealed that the abundance of S24-7, Lachnospiraceae, Oscillospira, and Parabacteroides were significantly increased in PSD rats, while the abundance of Akkermansia and Klebsiella were significantly decreased. After the treatment of coffee and decaffeinated coffee, the abundance of the above gut microbiota was all restored in different degrees. Coffee had relatively more significant effects on PSD-induced depressive-like behaviors, while the difference between coffee and decaffeinated coffee was not obvious in correcting the disorder of gut microbiota.
Conclusions:
These findings have shown that both coffee and decaffeinated coffee are effective for sleep deprivation-induced depression-like behaviors and the dysbiosis of gut microbiota and indicated that caffeine may be not the only key substance of coffee for regulating gut microbiota.
Introduction
As the most consumed drink in the world, coffee is second only to water (Butt and Sultan, 2011). In European countries, most adults drink coffee every day (Lopez Garcia et al., 2014). Evidence has been found in recent years that coffee has benefit to the health. People who drink three or four cups of coffee a day have a lower risk of developing type 2 diabetes, which may be due to the presence of green folic acid and caffeine in coffee (George et al., 2008). Moreover, a large amount research reveals that caffeine in the coffee with moderate consumption (three-to-five cups, volume not identified) has the effect of anti-Alzheimer’s disease (Mahshad and Mazen, 2017). Caffeine and coffee with a dose of 600 ml/day are helpful to reduce the risk of depression (Grosso et al., 2016). It is said that caffeine and modafinil could improve neuroinflammation and anxiety during sleep deprivation in rats by inhibiting microglial activation (Meetu et al., 2018), while an excessive dose of caffeine (70 mg/kg) showed anxiogenic effect (Kayir and Uzbay, 2006). Drinking coffee also can enhance cognitive function, in which it is believed that coffee has the benefit for attention and can eliminate cognitive sequelae caused by poor sleep (Franke et al., 2014). However, excessive intake of coffee or caffeine can lead to the development of physiological tolerance, and when a habitual caffeine consumer suddenly reduces or ceases taking caffeine, he or she may experience withdrawal symptoms (Hughes et al., 1998; Stachyshyn et al., 2021).
Coffee contains more than 1,000 different compounds including phenolics, diterpenes, and melanoidins (Renouf et al., 2014), of which about 1% is caffeine (Hoelzl et al., 2010; Kim et al., 2017). Studies have proven that caffeine can improve attention measurement and alertness (Haskell et al., 2005; Childs and Wit, 2006). However, excessive caffeine intake can lead to negative health consequences, such as psychomotor agitation, insomnia, headaches, and gastrointestinal discomfort (Wierzejska, 2012). Caffeine and its metabolites pass freely across the placenta into a fetus. Studies have shown that it may bring damage to the fetus by affecting the expression of genes related to cell damage (Abdelkader et al., 2013). Some recent systematic reviews have shown that moderate intake (three cups a day) of various types of coffee can reduce all-cause mortality in healthy people. These benefits may be due to some biologically active compounds instead of caffeine, mainly phenolic acids and diterpenoids, like cafestol and kahweol (Ding et al., 2015; Tsujimoto et al., 2017; Li et al., 2019). Thus, decaffeinated coffee appeared on the market. Decaffeinated coffee contains only a small amount of caffeine, and the International Coffee Organization defines that the content of caffeine is less than 0.3% in decaffeinated coffee. Chlorogenic acid, a kind of phenolic phytochemicals, can represent the principal non-caffeine components in coffee. Decaffeinated coffee with high chlorogenic acid content improves alertness and reduces negative emotions (Camfield et al., 2013). However, these effects of using chlorogenic acid alone are not obvious, considering that it may be the synergistic effect of non-caffeine compounds in coffee (Camfield et al., 2013). To study the effects of coffee on humans, Bunker and McWilliams proposed a criteria in 1979 to define decaffeinated coffee and coffee, using commercial-branded coffee and espresso (caffeine-containing coffee and caffeine-containing coffee 5 mg per cup) (Adan et al., 2008). Studying the impact of coffee or decaffeinated coffee on cognition can better understand daily habits in life and further clarify the benefits of coffee or decaffeinated coffee (Ho and Chung, 2013).
Sleep deprivation has become a health problem in the modern society (Malinalli et al., 2018). Sleep deprivation can be acute or chronic (Jamie et al., 2019). By definition, 24 h without sleep is acute sleep loss, and less than 6 h of sleep per night for 6 nights or more in a row is considered chronic sleep deprivation (Krishnan et al., 2016). The consequences of sleep deprivation are enormous, especially in mental illness (World Health Organization, 2017). Evidence suggests that rapid eye movement sleep changes occur in most patients with mental illness, such as depression (Benca et al., 1992). Furthermore, sleep deprivation may also occur in the same symptoms (Dieter et al., 2019). A study found that the cytokine secretion induced by low-level exposure of immune cells to bacterial cell wall components contributes to normal sleep patterns, while excessive cytokine levels are associated with disrupted sleep (Galland, 2014). At the same time, recent investigations indicated that the alteration of gut microbiome patterns was evident in people with depression (Barandouzi et al., 2020).
Our previous study found that chronic paradoxical sleep deprivation (PSD) could lead to depression-like behaviors, as well as dysbiosis in the host’s gut microbiota (Ma et al., 2019). PSD could alter monoamine neurotransmitters such as norepinephrine and serotonin, as well as increase neuro-inflammatory cytokines including IL-1β and TNF-α, microglial activation, and neuronal apoptosis in the brain (Daniele et al., 2017; Mengmei et al., 2017). Sleep deprivation also leads to an accumulation of reactive oxygen species and oxidative stress, specifically in the gut (Alexandra et al., 2020). In addition, some preclinical studies have shown that gut microbiota can affect behaviors and brain conditions through neuroimmunity, neuroendocrine, neural, and humoral pathways (Dinan and Cryan, 2013; Kelly et al., 2016). Coffee has been proven to regulate the gut microbiota (González et al., 2020), which depends more on polyphenols and other non-digestible constituents of coffee like polysaccharides and melanoidins (Kolb et al., 2020). Coffee is the most common beverage used to combat fatigue and fatigue caused by sleep deprivation, while decaffeinated coffee is considered as a healthier alternative to traditional coffee. For the purpose of better understanding the effects of these two beverages on sleep deprivation, we first observed the intervention effect of coffee and decaffeinated coffee on the PSD rat model induced by multi-platform technology, mainly related to depression-related behavioral changes and serum inflammation and oxidative stress indicators. Then, we investigated their impacts on the corresponding alterations in the gut microbiota.
Materials and Methods
Materials
Commercial instant coffee powder (200 mg/kg; Nestlé, La Tour-de-Peilz, Switzerland) and decaffeinated coffee powder (200 mg/kg; Nestlé, La Tour-de-Peilz, Switzerland) were dissolved in pure water as previously described (Shin et al., 2010; Turner et al., 2012). Each group was administered by gavage in the same volume (0.5 ml/100 g) once a day. Rats in the control and the model group were given saline.
Animals
A total of 32 inbred-strain male Wistar rats [240 ± 10g, license: SCXK (Hu) 2008-0016] were purchased from Shanghai Sippr-BK Laboratory Animal Co., Ltd. The rats of the same group were housed in animal cages at a density of 4 per cage under standard experimental conditions (room temperature for 24 ± 1°C, relative humidity for 55 ± 15% and 12 h dark/light cycle [07:00–19:00 at 40 w light condition)]. The rats had free access to food and water. Animal welfare and experimental protocols strictly referred to the guide of the care and use of laboratory animals and the ethics and regulations of Shanghai University of Traditional Chinese Medicine. After the rats have been adaptively fed for 1 week, they were randomly divided into four groups as follows: control group (CON), PSD model group (SD), conventional coffee group (CC), and decaffeinated coffee group (DC). Coffee and pure water were administrated on 9:30 a.m. of each day of PSD processing.
Paradoxical Sleep Deprivation Procedure
The modified multi-platform method was used for PSD processing as described (Cheng et al., 2016). The method was based on the loss of muscle tone that characterizes the rapid eye movement sleep condition or paradoxical sleep. Animals would experience a sudden loss of the sleep cycle when falling into the water, and the method is proved to be feasible in the previous study (Machado et al., 2004). The rats were given free access to water and food in a climate-controlled room (24 ± 1°C, 55 ± 15%) on a 12 h light/dark schedule (light on at 07:00–19:00). The box for PSD was sterilized with 75% alcohol every day. The PSD procedure lasted for 7 days.
Behavioral Testing
When the PSD was finished on the morning of the eighth day, the behavioral tests of each group were performed under the conditions of dim light and low noise in the following order. Each test started 30 min after the daily administration of coffee.
Open Field Test
The open field test (OFT) was performed as previously described (Zhai et al., 2015). The test was performed in a quiet room. The apparatus is a self-made rectangular arena (80 cm × 80 cm × 40 cm), with the floor being divided into 25 equal-size squares, and the side walls were black. After the PSD procedure, the rats were set in the center of the arena one by one to explore for 5 min. The following behaviors were recorded: the number of crossing (grid lines crossed with at least three paws) and the total number of grooming and rearing (defined as standing upright with hind legs). Every grooming or rearing was counted as one point alone, every grid crossed was counted as one point, and the behavioral score was the total number of points. The open-field arena was thoroughly cleaned with 70% ethanol at the interval of each test.
Sucrose Preference Test
The sucrose preference test (SPT) was performed as previously described (Zhai et al., 2015). All rats were reared in a single cage during the experiment. The rats were trained to adapt by exposing them to two bottles (one containing 1% sucrose solution and the other containing tap water) for 24 h. Then, the test was performed after 4 h of water deprivation. Two bottles (one with 1% sucrose solution and the other with tap water) were weighed and presented to each rat for 1 h. The position of the two bottles was randomly determined. Sucrose solution and tap water consumption (g) were measured, and the sucrose preference was calculated using the equation: sucrose solution (g)/[sucrose solution (g) + water (g)] × 100%.
Forced Swimming Test
After administration, each rat was placed in a transparent container (50 cm in height, 18 cm in diameter) with water in 30 cm depth (25 ± 1°C). The test lasted 6 min, and the immobility time during the final 4 min was recorded by the person blinded to the purpose of the experiment. The immobility state was defined as the state of rats floating in the water and only keeping the head above the water without struggling or any motions. The test time was from 14:00 to 18:00, and the water was changed after each test.
Tail Suspension Test
Each rat was individually suspended 50 cm above the floor by the tail, using a tape. The test lasted 6 min, and the immobility time during the final 4 min was recorded by the person blinded to the purpose of the experiment. The immobility state was defined as the state only when rats remain completely motionless. The test time was from 14:00 to 18:00.
Sample Collection
After the last sleep deprivation and administration were performed, the rats were individually housed in a metabolic cage, which could separate and collect urine and feces. Fresh feces were collected continuously with sterile operation (Eriksson et al., 2004; Ward and Hubscher, 2012), and stored at −80°C for subsequent analysis. Then rats were sacrificed, and blood was collected from the abdominal aorta. Blood was centrifuged at 4°C at 3,000 r/min for 15 min (Centrifuge 5702R, Eppendorf), and the supernatants were stored at −80°C prior to use.
Biochemical Parameters in Serum
Serum samples were thawed on ice. The levels of interleukin-6 (IL-6), tumor necrosis factor alpha (TNF-α), superoxide dismutase (SOD), and glutathione peroxidase (GSH-Px) in serum samples were detected by commercial enzyme linked immunosorbent assay (ELISA) kits, referring to the instructions provided by the manufacturer (Nanjing Jiancheng Bioengineering Institute, Nanjing, China).
Microbial Community Profiling
The E.Z.N.A. ® soil DNA Kit (Omega Bio-Tek, Norcross, GA, United States) was used to extract the microbial community genomic DNA from fecal samples. The microbial DNA regions V3–V4 of the bacterial 16S rRNA gene were amplified with primer pairs 338F (5′-ACTCCTACGGGAGGCAGCAG-3′) and 806R (5′-TACHVGGGTWTCTAAT-3′) (Sinha et al., 2017). The PCR product was extracted from 2% agarose gel and purified using the AxyPrep DNA Gel Extraction Kit (Axygen Biosciences, Union City, CA, United States). Purified amplicons were pooled in equimolar and paired-end sequences on an Illumina MiSeq PE300 platform/NovaSeq PE250 platform (Illumina, San Diego, CA, United States) according to the standard protocols by Majorbio Bio-Pharm Technology Co., Ltd. (Shanghai, China). The raw reads were deposited into the NCBI Sequence Read Archive database (Accession Number: SRP337042; PRJNA762663).
Fastp software (1 version 0.20.0) and FLASH software (2 version 1.2.7) were used for the quality control of the original sequencing sequence and splicing (Magoč and Salzberg, 2011; Shifu et al., 2018). UPARSE software (3 version 7.1) was used to perform an operational taxonomic unit (OTU) clustering of sequences based on 97% similarity, as well as to eliminate chimeras (Stackebrandt and Goebel, 1994; Edgar, 2013). The Venny 2.14 was employed to map the Venn diagram of OTUs among four groups. Alpha diversity index (Chao1 index, Ace index, Simpson index, and Shannon index) was based on Mothur 9 (version 1.30.25), and beta diversity was performed based on partial least squares discriminant analysis (PLS-DA) for assessing the clustering patterns on the weighted UniFrac matrices and the ANOSIM function of QIIME 11 (version 1.9.16).
Data Statistical Analysis
All the data were presented as mean ± standard deviation. The statistical analyses were carried out using IBM statistical product and service solutions (SPSS) Statistic Version 21.0 (SPSS; IBM, Armonk, NY, United States). One-way ANOVA test and two tailed Student’s _t_-test were used to analyze significant differences between the two groups. A _p_-value of less than 0.05 or 0.01 was considered statistical significance.
Results
Coffee and Decaffeinated Coffee Improved the Depressive-Like Behaviors in PSD Rats
After 7 days of sleep deprivation procedure, as showed in Figure 1A, the total behavioral score in the PSD model group was significantly lower than the control group (P < 0.001). Conventional coffee significantly increased the total behavioral score (_P_ < 0.05), while decaffeinated coffee also increased the score (_P_ > 0.05).
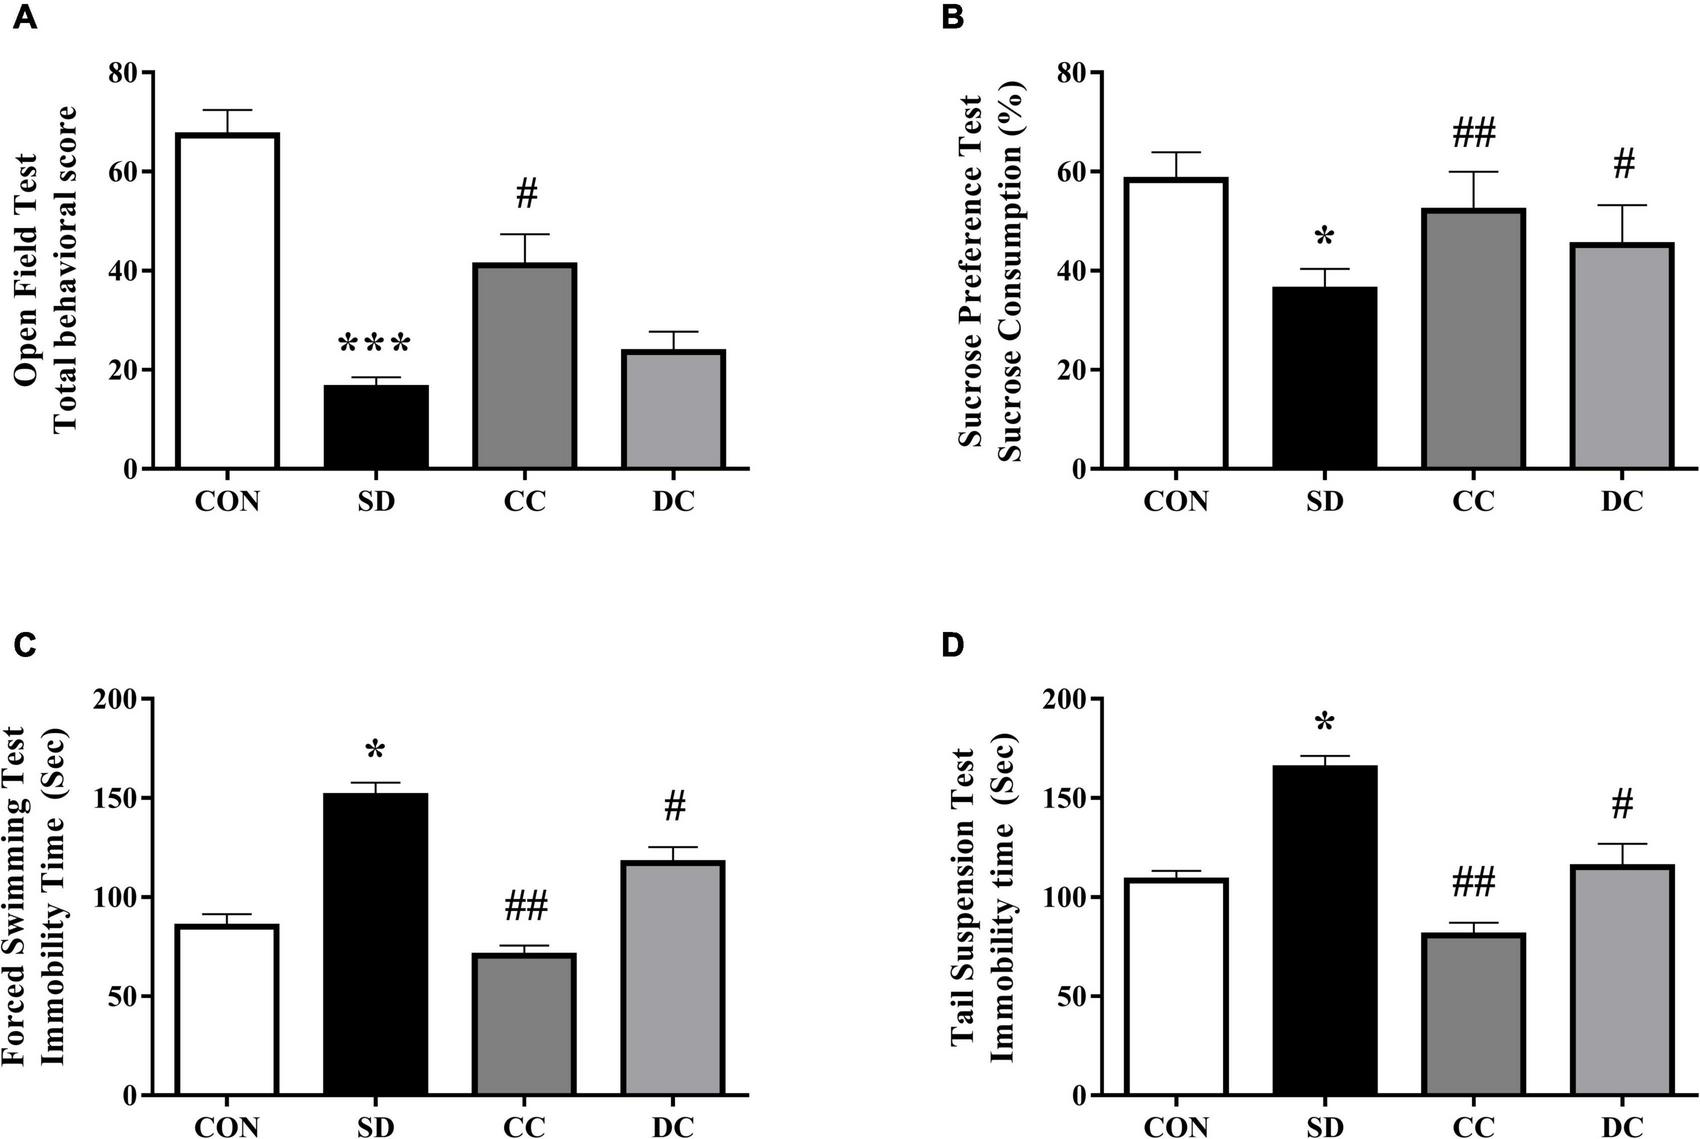
Effects of coffee and decaffeinated coffee on different behaviors in the PSD model. Total behavior score (A), sucrose consumption (B), immobility time of FST (C), immobility time of TST (D). Values were expressed as means ± SEM (n = 8). *P < 0.05, ***P < 0.001 significant differences compared to the control group; #P < 0.05, ##P < 0.01 significant differences compared to the SD group. CON, control group; SD, PSD model group; CC, conventional coffee group; DC, decaffeinated coffee group.
The results of SPT showed the effects of coffee and decaffeinated coffee on the changes of sucrose consumption (Figure 1B). Compared to the control group, sucrose consumption was significantly reduced in the PSD model group (P < 0.05). However, the sucrose consumption was significantly higher after the treatment of conventional coffee and decaffeinated coffee than in the model group (P < 0.01, P < 0.05).
Chronic PSD remarkably increased immobility time in forced swimming test (FST) and tail suspension test (TST) (Figures 1C,D) (P < 0.05). The immobility time in the conventional coffee and decaffeinated coffee group was significantly lower than the PSD model group (P < 0.01, P < 0.05).
Coffee and Decaffeinated Coffee Ameliorate the Level of Inflammatory and Antioxidant Factors in PSD Rats
The effects of conventional coffee and decaffeinated coffee on inflammatory factors and antioxidant factors in the serum of PSD rats were investigated (Table 1). Compared with the control group, the levels of IL-6 and TNF-α in PSD rats were significantly increased (P < 0.001, P < 0.01). IL-6 and TNF-α levels were remarkably decreased after the treatment of conventional coffee (P < 0.01, P < 0.05), and the level of TNF-α was significantly decreased with the treatment of decaffeinated coffee (P < 0.05). Furthermore, the levels of SOD and GSH-Px in the model group were much lower than in the control group (P < 0.01, P < 0.001). The levels of SOD and GSH-Px were significantly increased with the treatment of conventional coffee (P < 0.05, P < 0.01), and the level of GSH-Px was significantly increased after the treatment of decaffeinated coffee (P < 0.05).
| Parameter | n | CON | SD | CC | DC |
|---|---|---|---|---|---|
| IL-6 (pg/ml) | 8 | 4.19 ± 1.04 | 17.58 ± 3.71*** | 10.25 ± 3.01## | 14.03 ± 2.42 |
| TNF-α (pg/ml) | 8 | 5.07 ± 0.79 | 12.57 ± 2.67** | 8.34 ± 3.16# | 9.22 ± 2.66# |
| SOD (U/ml) | 8 | 156.32 ± 11.61 | 104.57 ± 13.45** | 140.35 ± 15.26# | 137.88 ± 16.39 |
| GSH-Px (U/ml) | 8 | 319.23 ± 22.70 | 167.53 ± 17.13*** | 217.53 ± 27.35## | 193.50 ± 23.62# |
Inflammatory and antioxidant factors in the serum.
Values were expressed as means ± SEM.
**P < 0.01, ***P < 0.001 significant differences compared to the control group; #P < 0.05, ##P < 0.01 significant differences compared to the SD group.
CON, control group; SD, PSD model group; CC, conventional coffee group; DC, decaffeinated coffee group.
Effects of Coffee and Decaffeinated Coffee on the Gut Microbiota Composition
OTU Classification Statistics
The number of OTUs of each sample, as well as common and unique OTUs, was shown by the Venn diagram (Supplementary Figure 1), which could describe sample similarity and overlap intuitively (Cheng et al., 2016). The OTUs alone in each group were as follows: CON group 479; SD group 663; CC group 494; and DC group 465. The total number of OTU in each group was 3,359 (CON), 3.814 (SD), 3,458 (CC), and 3,430 (DC). Therefore, the ratio of the OTU alone in each group to the total OTU was 3.41, 4.72, 3.51, and 3.31%, respectively. A total of 1,343 OTUs were shared among the four groups. The results showed that the out number of the PSD model group increased, while both coffee and decaffeinated coffee treatments could reduce it.
The Diversity of the Gut Microbiota
The Chao1 index, Ace index, Simpson index, and Shannon index were selected to analyze the alpha diversity (Figure 2). The value of Simpson was significantly decreased, and the value of Shannon was significantly increased in the PSD model group compared with the control group (P < 0.01, P < 0.01). After the administration of conventional coffee, the value of Simpson was significantly increased and the value of Shannon was significantly lower than that in the PSD model group (P < 0.05, P < 0.05), while those values had no significantly changes with the administration of decaffeinated coffee.
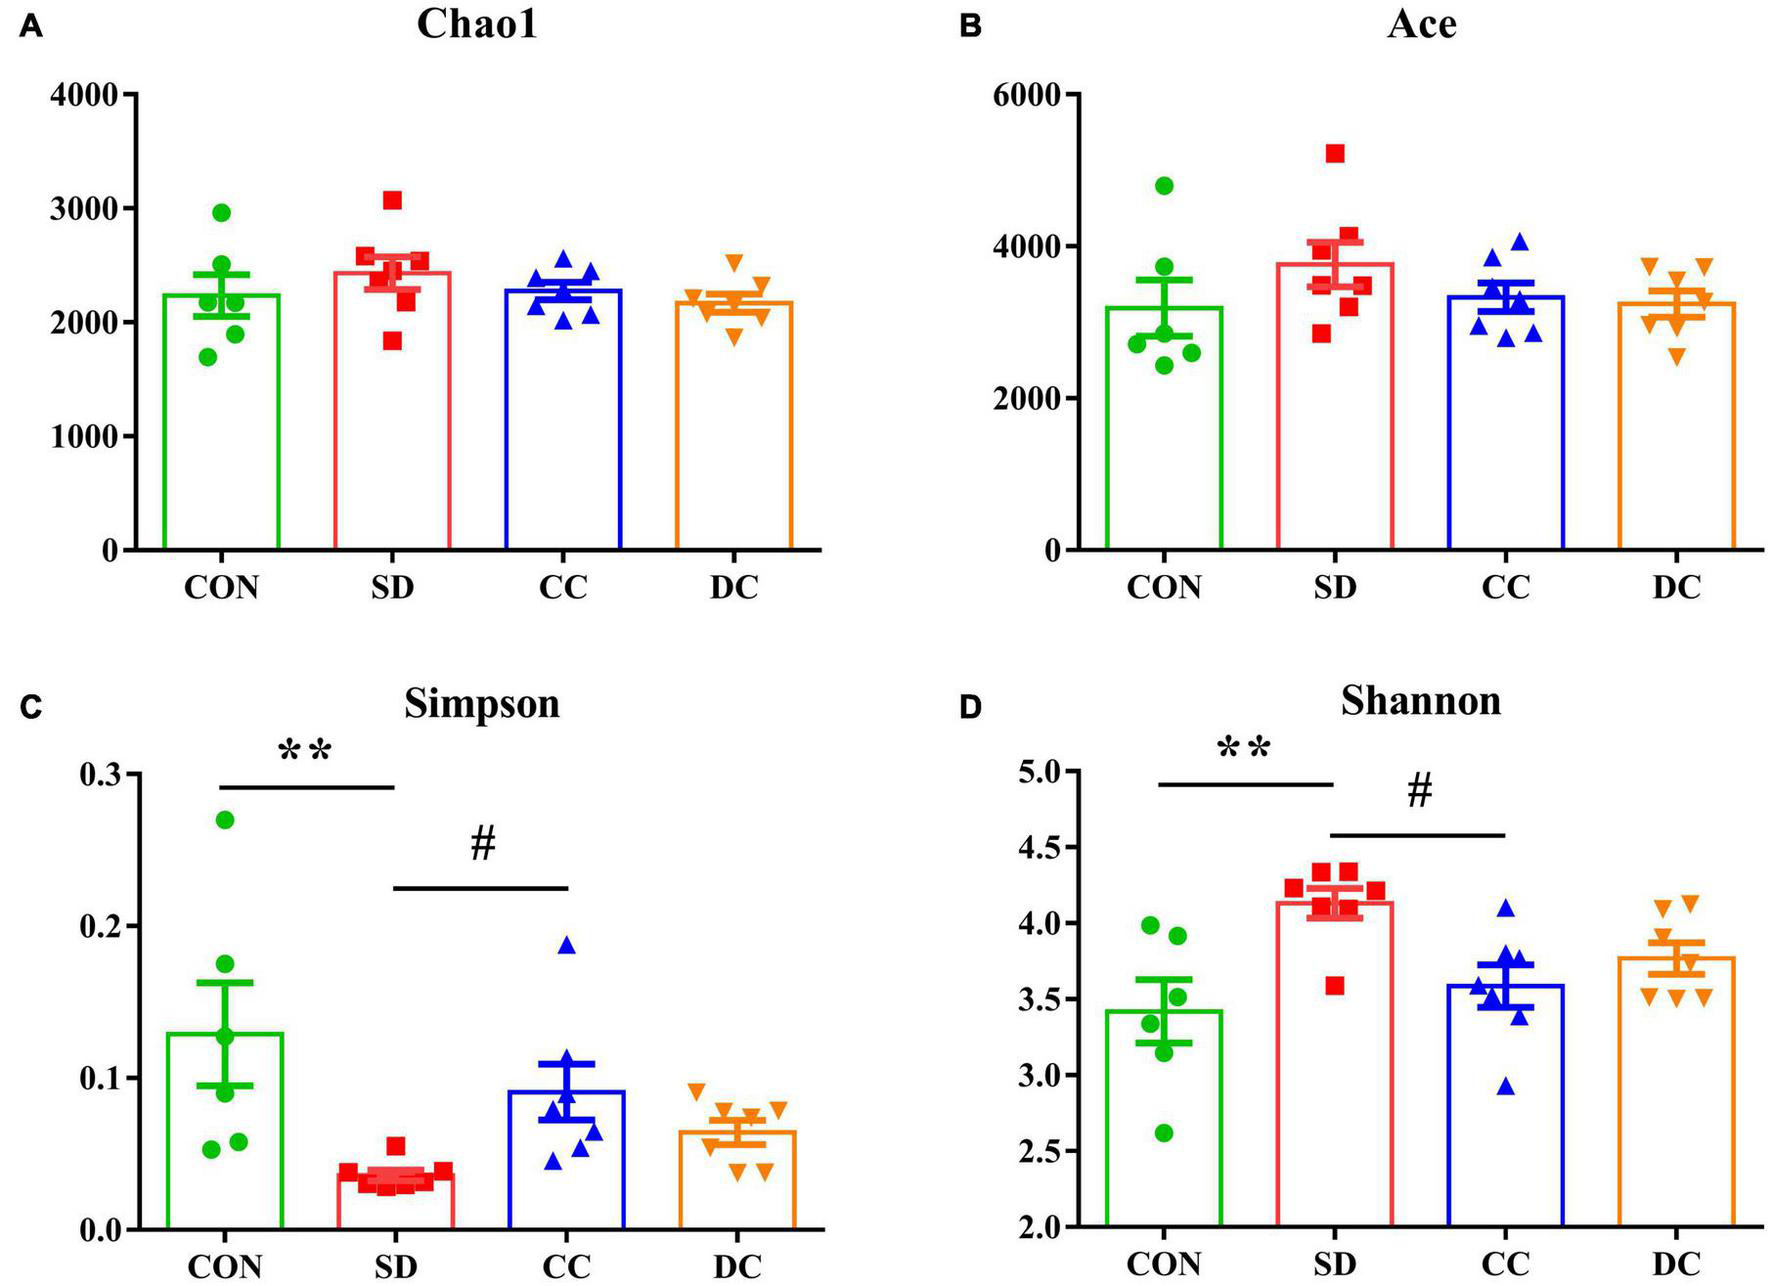
Alpha diversity in each group. Chao1 diversity (A); Ace diversity (B); Simpson diversity (C); Shannon diversity (D). Values were expressed as means ± SEM (n = 6 or 7). **P < 0.01 significant differences between the SD group and the control group; #P < 0.05 significant differences of the CC group or DC group as compared to the SD group. CON, control group; SD, PSD model group; CC, conventional coffee group; DC, decaffeinated coffee group.
PLS-DA analysis was performed to analyze the beta diversity among the four groups. As shown in Figure 3, the composition of the gut microbiota of the control group and the PSD model group was significantly separated and changed. In addition, the composition of the gut microbiota of the conventional coffee group and the decaffeinated coffee group was similar, and both tended to be closer to the control group than the model group. These results indicated that PSD caused disturbances in the gut microbiota. The treatment of conventional coffee and decaffeinated coffee could improve the PSD-induced changes in the gut microbiota, and both had similar therapeutic effects.
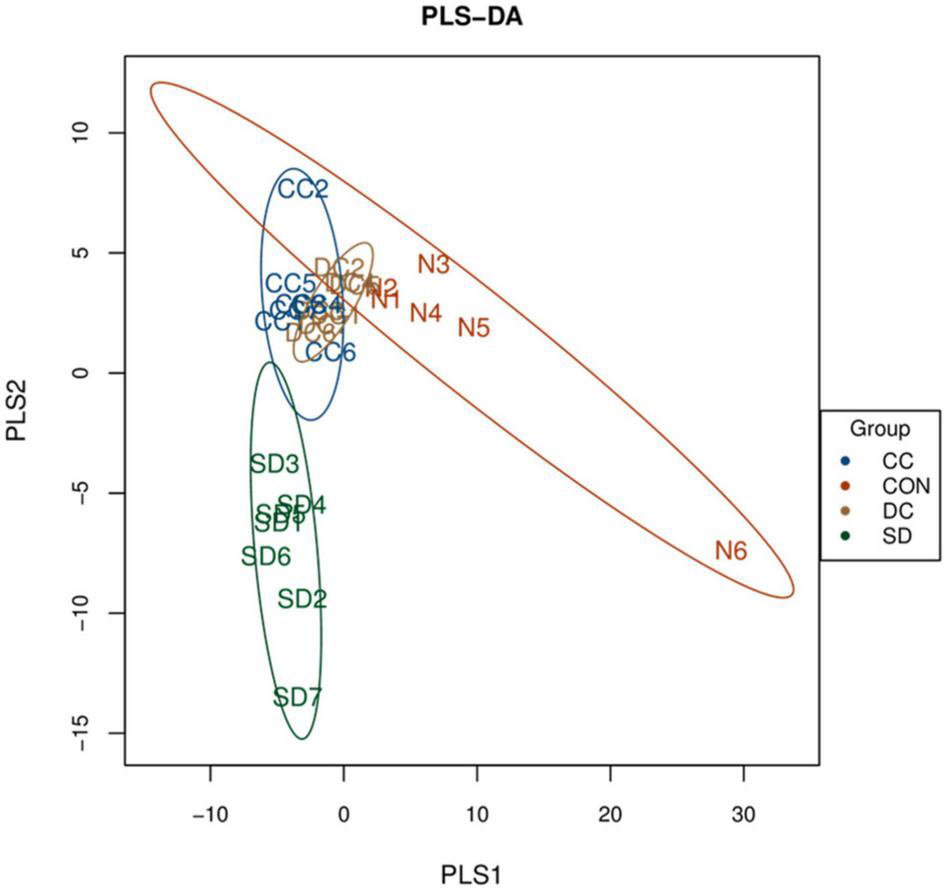
PLS-DA score plots for beta diversity of the microbial community among each group (n = 6 or 7). CON, control group; SD, PSD model group; CC, conventional coffee group; DC, decaffeinated coffee group.
Analysis of the Gut Microbiota Composition
At the phylum level, gut microbiota was mainly composed of Firmicutes, Verrucomicrobia, Proteobacteria, and Bacteroidetes (Figure 4A). Compared with the control group, the abundance of Firmicutes and Bacteroidetes was remarkably elevated in the model group (P < 0.05, P < 0.001). After the treatment of conventional coffee, the abundance of Firmicutes and Bacteroidetes was significantly reduced (P < 0.05, P < 0.001), and after the treatment of decaffeinated coffee, only the abundance of Bacteroidetes had a significant decrease (P < 0.001). Moreover, compared with the control group, the abundance of Verrucomicrobia was remarkably decreased in the model group (P < 0.001). With the treatment of conventional coffee and decaffeinated coffee, the abundance of Verrucomicrobia was significantly reversed (P < 0.001, P < 0.01). After decaffeinated coffee treatment, the abundance was still much lower than the control group (P < 0.05). For the abundance of Proteobacteria, there was no significant difference between the model group and the control group, and after the administration of conventional coffee and decaffeinated coffee, the abundance was much higher than the model group (P < 0.05, P < 0.05) and the control group (P < 0.05, no statistical significance) (Figure 4B).
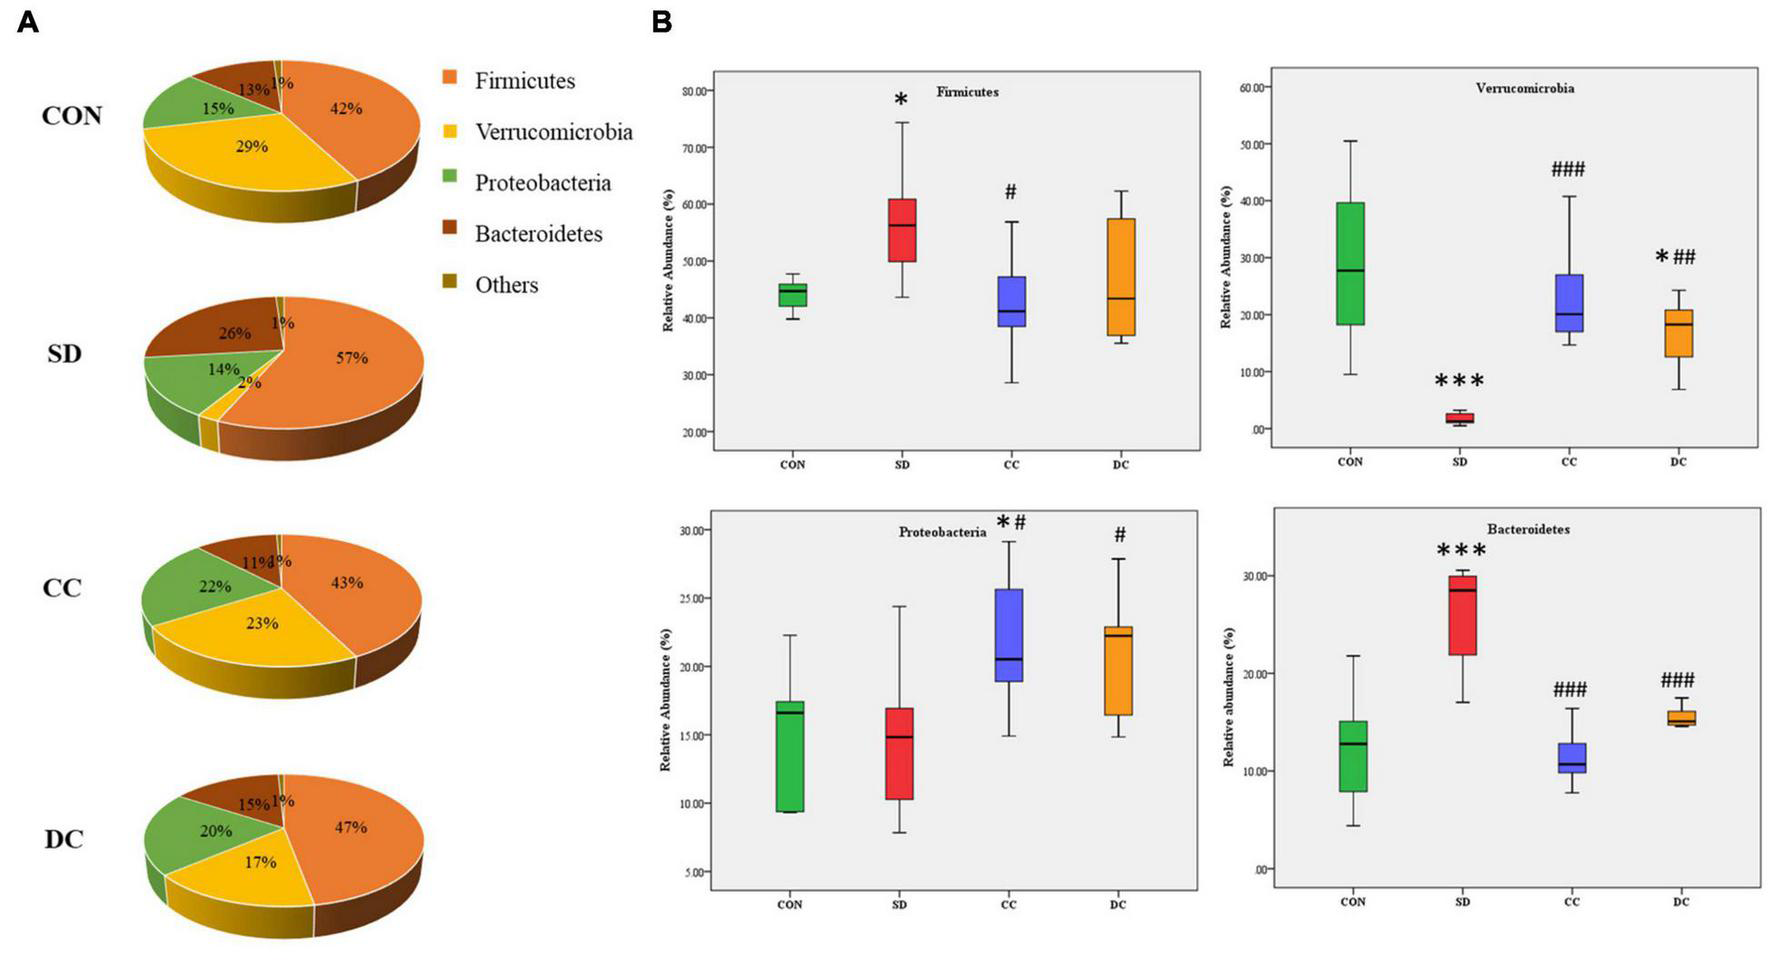
Relative abundances profiling at the phylum level of gut microbiota. (A) Pie chart of the relative abundances of gut microbiota in each group; (B) the relative abundances of Firmicutes, Verrucomicrobia, Proteobacteria, and Bacteroidetes. Values were expressed as means ± SEM (n = 8). *P < 0.05, ***P < 0.001 significant differences compared to the control group; #P < 0.05, ##P < 0.01, ###P < 0.001 significant differences compared to the SD group. CON, control group; SD, PSD model group; CC, conventional coffee group; DC, decaffeinated coffee group.
At the family level, the abundance of Verrucomicrobiaceae (P < 0.001), S24-7 (P < 0.001), Ruminococcaceaea (P < 0.01), Enterobacteriaceae (P < 0.001), Porphyromonadaceae (P < 0.05), and Lachnospiraceae (P < 0.01) showed a significant difference between the PSD and normal group (Figures 5A,B). Compared with the PSD model group, those relatively abundance except Porphyromonadaceae were significantly reversed after the treatment of conventional coffee, and those relatively abundance except Ruminococcaceae were significantly reversed after the treatment of decaffeinated coffee (Figure 5B).
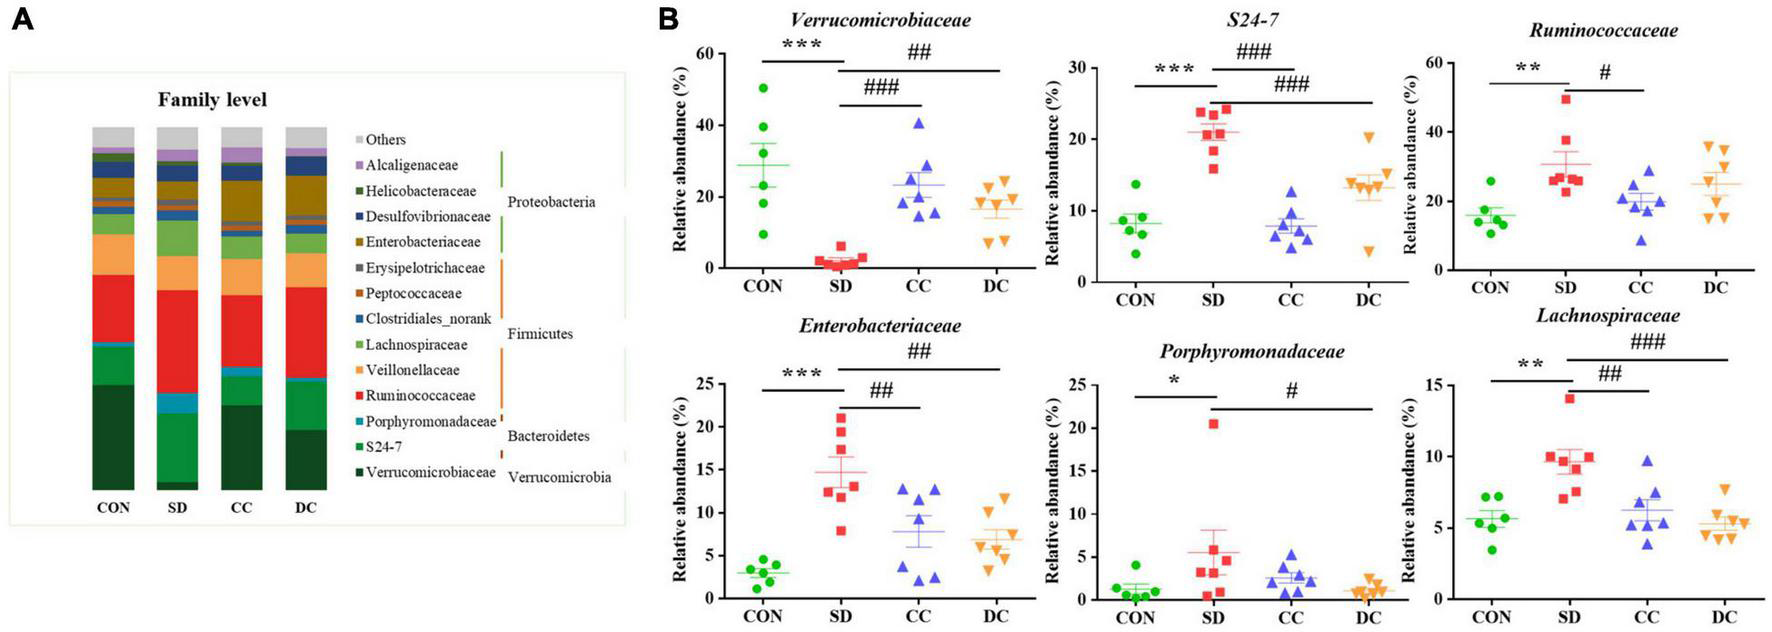
Bacterial taxonomic profiling at the family level of gut microbiota. (A) The relative abundance of Verrucomicrobiaceae, S24-7, Ruminococcaceaea, Enterobacteriaceae, Porphyromonadaceae, and Lachnospiraceae; (B) values were expressed as means ± SEM (n = 8). *P < 0.05, **P < 0.01, ***P < 0.001 significant differences compared to the control group; #P < 0.05, ##P < 0.01, ###P < 0.001 significant differences compared to the SD group. CON: control group; SD: PSD model group; CC: conventional coffee group; DC: decaffeinated coffee group.
At the genus level, Akkermansia (P < 0.001), S24-7_norank (P < 0.001), Lachnospiraceae_unclassified (P < 0.01), Oscillospira (P < 0.01), Parabacteroides (P < 0.05), and Klebsiella (P < 0.05) were the differential microbiota of the top six highest contents, between the PSD and normal group (Figures 6A,B). After the treatment of conventional coffee, the abundance of Akkermansia (P < 0.001), S24-7_norank (P < 0.001), Lachnospiraceae_unclassified (P < 0.01), Oscillospira (P < 0.05), and Klebsiella (P < 0.01) significantly reversed, while the abundance of Akkermansia (P < 0.01), S24-7_norank (P < 0.01), Lachnospiraceae_unclassified (P < 0.001), Parabacteroides (P < 0.05), and Klebsiella (P < 0.01) significantly reversed after the treatment of decaffeinated coffee (Figure 6B).
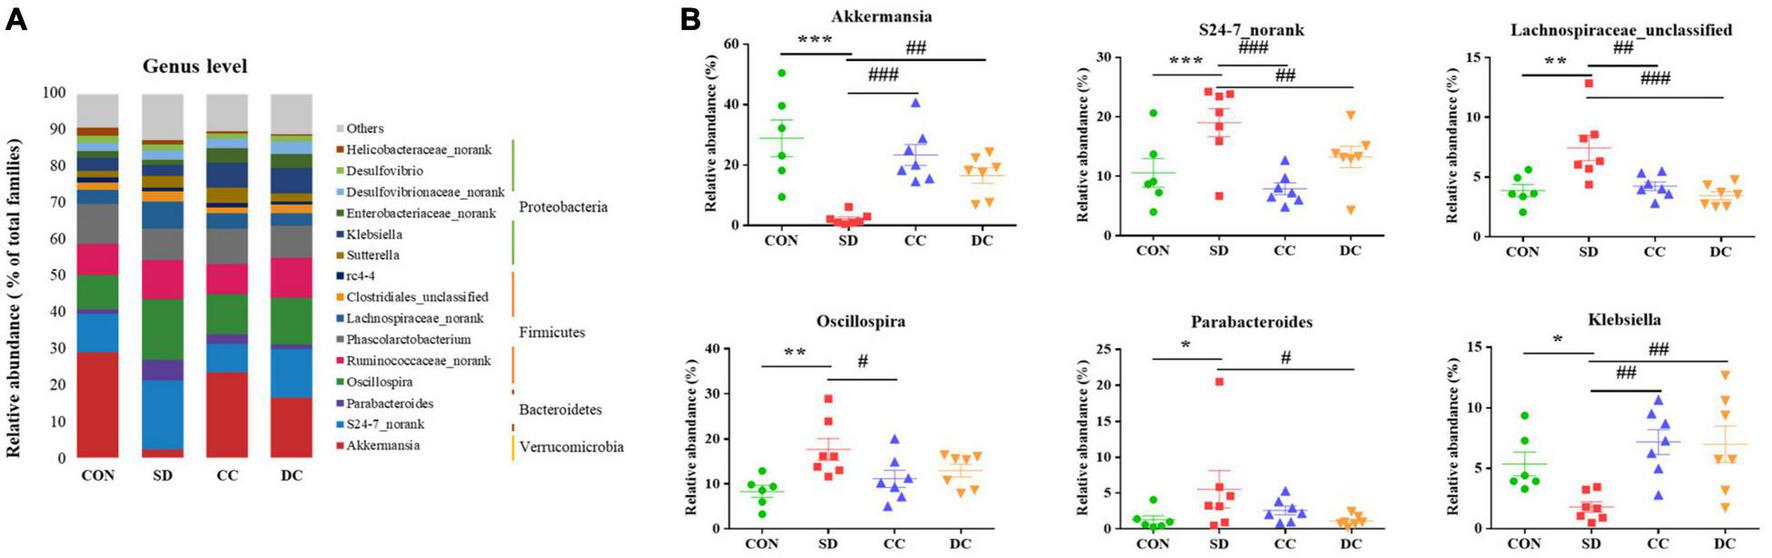
Bacterial taxonomic profiling at the genus level of gut microbiota. (A) The relative abundance of Akkermansia, S24-7_norank, Lachnospiraceae_unclassified, Oscillospira, Parabacteroides, and Klebsiella; (B) values were expressed as means ± SEM. (n = 8). *P < 0.05, **P < 0.01, ***P < 0.001 significant differences compared to the control group; #P < 0.05, ##P < 0.01, ###P < 0.001 significant differences compared to the SD group. CON, control group; SD, PSD model group; CC, conventional coffee group; DC, decaffeinated coffee group.
Discussion
Chronic sleep deprivation is a stressor that impairs the brain function and causes cognitive impairment, as well as increases oxidative stress and the risk for Alzheimer’s disease or depression (McEwen, 2006; Ma et al., 2019). The results of the behavior tests in our study showed the similar depression-like behaviors after PSD induced, and the symptom could be improved in a different extent with the treatment of conventional coffee and decaffeinated coffee (Figure 1). It has been reported that caffeinated coffee and caffeine were beneficial to depression-like behaviors, while the effect of decaffeinated coffee was not obvious (Paz-Graniel et al., 2020; Xue et al., 2020).
Elevated levels of IL-6 and TNF-α, as well as a negative feedback of SOD and GSH-Px levels in the PSD group (Table 1) confirmed that sleep deprivation induced inflammation and oxidative stress. Both IL-6 and TNF-α are the multifunctional cytokines involved in the regulation of the immune response and inflammation, and the production of these pro-inflammatory cytokines could be increased by different stimuli (Akira et al., 1990; Schindler et al., 1990). As one of the stimuli, sleep disturbance was associated with disorders related to inflammation, such as cardiovascular disease, arthritis, diabetes mellitus, and certain cancers (Michael et al., 2015). In addition, evidence suggested that sleep deprivation would promote oxidative stress (Villafuerte et al., 2016). In our study, the levels of IL-6, TNF-α, SOD, and GSH-Px were all reversed after the treatment of conventional coffee and decaffeinated coffee, while the effect of coffee was relatively more significant than that of decaffeinated coffee (Table 1). The anti-inflammatory effect of coffee has been widely reported (Yamashita et al., 2012; Erikka et al., 2015). In our study, both in the caffeinated coffee group and the decaffeinated coffee group, a decrease in the levels of pro-inflammatory factors was observed, and the therapeutic effect of caffeinated coffee was more obvious, which indicated that not only caffeine but also the other ingredients in coffee played a role in promoting anti-inflammatory effect, such as chlorogenic acid (Dong et al., 2019). Chlorogenic acid can inhibit protein tyrosine phosphatase 1B to reduce the expression of pro-inflammatory cytokine genes (Giuseppe et al., 2017). Research on the effect of coffee and its biologically active substances such as caffeine, phenolic compounds, diterpenoids. and soluble fiber on oxidative stress is increasing these years (Martini et al., 2016). It has been reported that chronic coffee and caffeine ingestion would increase the activity of SOD, as well as protect the antioxidant system in the brain (Abreu et al., 2011). Light-dark roasted coffee (rich in chlorogenic acid) showed a more significant effect in increasing the level of SOD (Kotyczka et al., 2011). Evidence showed that some diterpenoids (kafestol and kahweol) in coffee could increase the concentration of GSH (Scharf et al., 2001). Furthermore, caffeine also has the exact effect of antioxidant and anti-inflammatory (Daniela et al., 2017; Soohan et al., 2017; Haroon et al., 2019).
Coffee has been confirmed to confer various health benefits, and drinking coffee can alter a host’s gut microbiota (Chong et al., 2020). Coffee may partly depend on the modulation of gut microbiota to influence health (González et al., 2020). It has been proven that polyphenols in coffee can change the environment, or they can be catabolized by gut microbiota (Aura, 2008; Couteau et al., 2010). In the microbial community profiling, both caffeinated coffee and decaffeinated coffee could reduce the number of OTUs that increased after PSD induction. Only the Simpson index and Shannon index in alpha diversity index were restored significantly after coffee treatment. In the beta diversity analysis, there was a significant separation between the control group and the model group. With the treatment of coffee and decaffeinated coffee, the composition of the gut microbiota tended to approach the control group, which indicated that both coffee and decaffeinated coffee restored the composition of the gut microbiota of PSD rats. In our results, the levels of Akkermansia (Phylum Verrucomicrobia) and Klebsiella (Phylum Proteobacteria) were significantly decreased in the rats with sleep deprivation (Figure 6B). As a Gram-negative pathogen, Klebsiella could cause a variety of infectious diseases (Guoying et al., 2020) and has the effect of inducing the inflammatory response (Atarashi et al., 2017; Marjolaine et al., 2019). It has been reported that when the Proteobacteria increases, intestinal mucus would decrease, resulting in damage to the intestinal barrier and low-grade inflammation (Shin et al., 2015). In our results, sleep deprivation caused an increase in the expression of inflammatory factors, while a decrease in the pro-inflammatory bacteria Proteobacteria. This indicated that the inflammation caused by sleep deprivation might be not through the gut microbiota pathway. The decrease of Akkermansia is commonly observed in the symptom of sleep deprivation (Heintz-Buschart et al., 2018; Ting et al., 2019). Akkermansia is known as a beneficial microbe that is inversely associated with obesity, diabetes, cardiometabolic diseases, and low-grade inflammation (Plovier et al., 2016; Patrice and Willem, 2017). With treatment of conventional coffee and decaffeinated coffee, both levels of Akkermansia were increased significantly, and the effect of coffee was more obvious (Figure 6B). A study has found that coffee has antibacterial effects and prebiotic function (Nakayama and Oishi, 2013). Compared to caffeine, which is rapidly absorbed and degraded in the upper digestive tract, polyphenols are difficult to be absorbed in the gastrointestinal tract. This caused most of the polyphenols to enter the intestine and affect the gut microbiota and mucosal cells and increase of the abundance of Akkermansia in the intestine (Yuji et al., 2018). A study has shown that tea is rich in polyphenols and caffeine plays a key role in remodeling the disturbed gut microbiota (including Akkermansia), which may be a synergistic effect (Xiaoyu et al., 2018).
Our results illustrated that the abundance of Parabacteroides (Phylum Bacteroidetes) in the PSD group was significantly higher than the normal control. As a kind of Gram-negative bacteria, Parabacteroides contains lipopolysaccharide, which is a typical potent endotoxin that can induce strong pro-inflammatory reactions in the host (Kaisa et al., 2020). Akkermansia and Klebsiella, also Gram-negative bacteria, had lower levels in the PSD group, compared to the normal control, and high levels of inflammatory factors were detected after PSD intervention. These indicated that the inflammatory response might not necessarily be caused by Parabacteroides, Akkermansia, and Klebsiella, but rather be caused by the release of lipopolysaccharide from other types of Gram-negative bacteria or other stress response in the host. In addition, a high level of Parabacteroides can be found in patients with depression (Barandouzi et al., 2020), and our results also showed depression-like behaviors after PSD induced. With the treatment of decaffeinated coffee, the decrease of the level of Parabacteroides was relatively more significant than the conventional coffee group. Polyphenols in the decaffeinated green tea and black tea could regulate the abundance of Parabacteroides and induced weight loss (Rothenberg et al., 2018). For example, chlorogenic acid can protect intestinal integrity and reduce inflammation by inhibiting the growth of Bacteroides and the accumulation of _Bacteroides_-derived lipopolysaccharide (Yan et al., 2020). In addition, evidence has indicated that both caffeinated and decaffeinated coffee have a similar anti-inflammatory effect (Dong et al., 2019), and not only caffeine, but also some phenols including pyrocatechol, chlorogenic acid, and so on, can prevent the inflammatory responses (Hwang et al., 2016; Stefanello et al., 2018; Megumi et al., 2020). Therefore, caffeine and phenols exert anti-inflammatory effects by affecting different gut microbiota.
In our study, the relative abundance of Lachnospiraceae (Phylum Firmicutes), S24-7 (Phylum Bacteroidetes), and Oscillospira (Phylum Firmicutes) were significantly increased in the SD group (Figure 6B). Lachnospiraceae and S24-7 impact their hosts by producing short-chain fatty acids (SCFAs) (Jennifer et al., 2017; Matthew et al., 2020). In patients with ulcerative coliti, an increase in the level of Lachnospiraceae could be observed (Schirmer et al., 2019), which could be explained by the fact that stress increases the abundance of Lachnospiraceae (Li et al., 2017). As shown in our study, after the stress of sleep deprivation, the level of Lachnospiraceae increased significantly. However, as a butyric acid-producing bacteria, increasing the content of Lachnospiraceae also has a beneficial effect to the body (Huws et al., 2011; Dong et al., 2020). Oscillospira can be seen in the obese animals, which ferments polysaccharide into SCFAs (Na et al., 2018). In addition, Oscillospira is correlated with inflammatory disease (Uri et al., 2017). SCFAs are involved in the regulation of the gut immune system, and the production of the SCFAs is one of the crucial ways that gut microbiota affect the hosts (Jost et al., 2020). Besides, SCFAs play an important role in host defense and immunity, including anti-inflammation and anti-oxidant activities. The increase of these gut microbiota related to fatty acid metabolism indicated that sleep deprivation would lead to metabolism disorders, inflammation, and oxidative stress. After the administration of conventional coffee and decaffeinated coffee, the relative abundance of these gut bacteria decreased in different degrees, and coffee had a relatively more significant effect. Caffeine consumption could attenuate the increase in _Firmicutes_-to-Bacteroidetes ratio in high-fat-fed rats (Cowan et al., 2014). Interestingly, some recent studies have now shown that the increase in this ratio has no relation with the presence of high- fat diet but only related to the content of dietary fiber (Dalby et al., 2017; Singh et al., 2020). Moreover, due to lifestyle-associated factors such as diet, physical activity, food additives, and contaminants, the relative abundance of the Firmicutes and Bacteroidetes varies greatly among individuals (Magne et al., 2020). Caffeine intake is linked to weight loss and the regulation of lipid metabolism, partly through its inhibition of adipogenesis-related factors (Su et al., 2013). It has been reported that some phenols and caffeine were directly associated with Bacteroides group levels (González et al., 2020). A study has found that caffeine and chlorogenic acid in coffee have a partially positive effect to the SCFAs in plasma (Kazuchika et al., 2018). The reaction of polyphenols in tea with residual carbohydrates and gut microbiota within the colon produce SCFAs, which enhance lipid metabolism (Rothenberg et al., 2018).
As shown in the previous studies, the differential gut microbiota in our study is commonly seen in patients with depression (Zheng et al., 2016; Cheung et al., 2019). Gut microbiota influences the emotional behavior by affecting the interactions of the gut–brain axis (Emeran et al., 2015), and sleep deprivation would increase the risk of depression (Robert and Hao, 2014). Chronic PSD could bring about depression-like performance, which is proven by our study and previous researches (Ma et al., 2019; Rahmani et al., 2020). In the behavior tests of our study, the effect of coffee to improve depression is more significant than the decaffeinated coffee. The main difference between the two drinks is the caffeine content. Caffeine is an alkaloid and modulates the dopaminergic activity through nonspecific antagonism against A1/A2 adenosine receptors (Navarro et al., 2018). A moderate intake of caffeine has a stimulating effect on the central nervous system and can improve psychomotor activities (Adan et al., 2008). Furthermore, coffee contains many functional components other than caffeine, such as chlorogenic acid, ferulic acid, nicotinic acid, trigonelline, quinolinic acid, tannic acid, and pyrogallic acid. These compounds have anti-inflammatory or antioxidative effects. Chlorogenic acid and trigonelline, which are present in high amounts in coffee, have an anti-inflammatory effect (Godos et al., 2014), and it has been found that low-grade inflammation seems to be related to the pathogenesis of depression (Sanchez Villegas and Martínez González, 2013). From our results of the treatment with decaffeinated coffee, we know that polyphenols in coffee also can improve depression-like behaviors by affecting the gut microbiota associated with inflammation such as Akkermansia, Klebsiella, and Parabacteroides. On the other hand, it has been suggested that patients with depression have increased oxidative stress and decreased antioxidant defense (Black et al., 2015) and antioxidant is an important aspect of treating depression (Vaváková et al., 2015). Coffee is rich in polyphenols, which not only has an anti-inflammatory effect but also has antioxidant activity (Godos et al., 2014; Martini et al., 2016). In our study, the abundance of the gut microbiota related to oxidative stress such as S24-7, Lachnospiraceae, and Oscillospira, could be revised by both coffee and decaffeinated coffee. Thus, it is demonstrated that the anti-inflammatory and antioxidant effects of polyphenols may be through regulating the gut microbiota, further playing a role in the treatment of depression induced by chronic PSD.
Some limitations must be considered when interpreting our results. The manufacturing procedure of the instant coffee powder we used in the experiment involves the aqueous extraction of soluble coffee components followed by drying to form a soluble powder. Although there are no other food additives, the loss of volatile aroma compounds during concentration through evaporation will lower product quality (Beverly et al., 2020), and at the same time, the results of the study could not fully represent the activity of coffee. In addition, the study lacks the analysis of the components of the samples, although there are other relevant literatures for reference, as well as the analysis of the metabolites of gut microbiota (such as SCFAs), these need to be strengthened in future research to better judge the role of gut microbiota in coffee on sleep deprivation.
Conclusion
In this study, 16S rRNA gene sequencing was applied to assess the effects of conventional coffee and decaffeinated coffee on the gut microbial community profiling. Our results revealed that the administration of conventional coffee and decaffeinated coffee ameliorated depression-like behaviors in rats of PSD induced, as well as the changed levels of IL-6, TNF-α, SOD, and GSH-Px. The effect of conventional coffee was relatively obvious than that of decaffeinated coffee. In microbiome analysis, PSD disturbed the composition of gut microbiota, including Akkermansia, S24-7, Lachnospiraceae, Oscillospira, Parabacteroides, and Klebsiella. Both the treatment of conventional coffee and decaffeinated coffee could restore the abundance levels of these gut microbiota. In a word, both coffee and decaffeinated coffee are effective for sleep deprivation-induced depression-like behaviors and the dysbiosis of gut microbiota. It implies that caffeine is not the only key substance of coffee in the regulation of PSD induced gut microbiota disorder.
Publisher’s Note
All claims expressed in this article are solely those of the authors and do not necessarily represent those of their affiliated organizations, or those of the publisher, the editors and the reviewers. Any product that may be evaluated in this article, or claim that may be made by its manufacturer, is not guaranteed or endorsed by the publisher.
Statements
Data availability statement
The datasets presented in this study can be found in online repositories. The names of the repository/repositories and accession number(s) can be found below: https://www.ncbi.nlm.nih.gov/, PRJNA762663.
Ethics statement
The animal study was reviewed and approved by Animal Experiment Center, Shanghai University of Traditional Chinese Medicine.
Author contributions
YX, TZ, MZ, CX, and LY accomplished the conception and design of the research. XG, SZ, WM, QW, and YL performed the experiments. XG and SZ prepared the figures. XG, WM, and SZ analyzed and interpreted the data. XG, WM, and YL drafted the manuscript. MZ edited and revised the manuscript. MZ and LY approved final version of the manuscript. All authors read and approved the final manuscript.
Funding
This work was supported by Natural Science Foundation of Shanghai, no. 21ZR1460900, and also sponsored by Innovation Project for Undergraduates of Shanghai University of Traditional Chinese Medicine (202110268240).
Acknowledgments
We would like to thank Jing Song for her efforts in animal experiments and sample analyzation. We would also like to acknowledge the support from the Majorbio Company (Shanghai, China).
Conflict of interest
The authors declare that the research was conducted in the absence of any commercial or financial relationships that could be construed as a potential conflict of interest.
Supplementary material
The Supplementary Material for this article can be found online at: https://www.frontiersin.org/articles/10.3389/fmicb.2022.778512/full#supplementary-material
Abbreviations
- FST
forced swimming test - GSH-Px
glutathione peroxidase - IL-6
interleukin-6 - OFT
open field test - PSD
paradoxical sleep deprivation - SOD
superoxide dismutase - SPT
sucrose preference test - TNF-α
tumor necrosis factor alfa - TST
tail suspension test.
References
- 1
Abdelkader T. S. Chang S. N. Kim T. H. Song J. Kim D. S. Park J. H. (2013). Exposure time to caffeine affects heartbeat and cell damage-related gene expression of zebrafish Danio rerio embryos at early developmental stages.__J. Appl. Toxicol._331277–1283. 10.1002/jat.2787 - 2
Abreu R. V. Silva Oliveira E. M. Moraes M. F. Pereira G. S. Moraes Santos T. (2011). Chronic coffee and caffeine ingestion effects on the cognitive function and antioxidant system of rat brains.__Pharmacol. Biochem. Behav._99659–664. 10.1016/j.pbb.2011.06.010 - 3
Adan A. Prat G. Fabbri M. Sànchez-Turet M. (2008). Early effects of caffeinated and decaffeinated coffee on subjective state and gender differences.__Prog. Neuropsychopharmacol. Biol. Psychiatry_321698–1703. 10.1016/j.pnpbp.2008.07.005 - 4
Akira S. Hirano T. Taga T. Kishimoto T. (1990). Biology of multifunctional cytokines: IL 6 and related molecules (IL-1 and TNF).__FASEB J._42860–2867. - 5
Alexandra V. Yosef K. D. Keishi N. Elizabeth A. P. Cindy L. Michael E. G. et al (2020). Sleep loss can cause death through accumulation of reactive oxygen species in the gut.__Cell_1811307–1328.e15. 10.1016/j.cell.2020.04.049 - 6
Atarashi K. Suda W. Luo C. Kawaguchi T. Motoo I. Narushima S. et al (2017). Ectopic colonization of oral bacteria in the intestine drives TH1 cell induction and inflammation.__Science_358359–365. 10.1126/science.aan4526 - 7
Aura A. M. (2008). Microbial metabolism of dietary phenolic compounds in the colon.__Phytochemistry Rev._7407–429. 10.1007/s11101-008-9095-3 - 8
Barandouzi Z. A. Starkweather A. R. Henderson W. A. Gyamfi A. Cong X. S. (2020). Altered composition of gut microbiota in depression: a systematic review.__Front. Psychiatry_11:541. 10.3389/fpsyt.2020.00541 - 9
Benca R. M. Obermeyer W. H. Thisted R. A. Gillin J. C. (1992). Sleep and psychiatric disorders. A meta-analysis.__Arch. Gen. Psychiatry_49651–670. 10.1001/archpsyc.1992.01820080059010 - 10
Beverly D. Lopez-Quiroga E. Farr R. Melrose J. Henson S. Bakalis S. et al (2020). Modeling mass and heat transfer in multiphase coffee aroma extraction.__Ind. Eng. Chem. Res._5911099–11112. 10.1021/acs.iecr.0c01153 - 11
Black C. N. Bot M. Scheffer P. G. Cuijpers P. Penninx B. (2015). Is depression associated with increased oxidative stress? A systematic review and meta-analysis.__Psychoneuroendocrinology_51164–175. 10.1016/j.psyneuen.2014.09.025 - 12
Butt M. S. Sultan M. T. (2011). Coffee and its consumption: benefits and risks.__Crit. Rev. Food Sci. Nutr._51363–373. 10.1080/10408390903586412 - 13
Camfield D. A. Silber B. Y. Scholey A. B. Nolidin K. Goh A. Stough C. (2013). A randomised placebo-controlled trial to differentiate the acute cognitive and mood effects of chlorogenic acid from decaffeinated coffee.__PLoS One_8:e82897. 10.1371/journal.pone.0082897 - 14
Cheng Z. Hu X. Sun Z. (2016). Microbial community distribution and dominant bacterial species analysis in the bio-electrochemical system treating low concentration cefuroxime.__Chem. Eng. J._303137–144. 10.1016/j.cej.2016.05.131 - 15
Cheung S. G. Goldenthal A. R. Uhlemann A. C. Mann J. J. Miller J. M. Sublette M. E. (2019). Systematic review of gut microbiota and major depression.__Front. Psychiatry_10:34. 10.3389/fpsyt.2019.00034 - 16
Childs E. Wit H. D. (2006). Subjective, behavioral, and physiological effects of acute caffeine in light, nondependent caffeine users.__Psychopharmacology_185514–523. 10.1007/s00213-006-0341-3 - 17
Chong C. W. Wong L. C. Teh C. S. J. Ismail N. H. Chan P. Q. Lim C. S. et al (2020). Coffee consumption revealed sex differences in host endogenous metabolism and gut microbiota in healthy adults.__J. Food Biochem._44:e13535. 10.1111/jfbc.13535 - 18
Couteau D. Mccartney A. L. Gibson G. R. Williamson G. Faulds C. B. (2010). Isolation and characterization of human colonic bacteria able to hydrolyse chlorogenic acid.__J. Appl. Microbiol._90873–881. 10.1046/j.1365-2672.2001.01316.x - 19
Cowan T. E. Palmnäs M. S. Yang J. Bomhof M. R. Ardell K. L. Reimer R. A. et al (2014). Chronic coffee consumption in the diet-induced obese rat: impact on gut microbiota and serum metabolomics.__J. Nutr. Biochem._25489–495. 10.1016/j.jnutbio.2013.12.009 - 20
Dalby M. J. Ross A. W. Walker A. W. Morgan P. J. (2017). Dietary uncoupling of gut microbiota and energy harvesting from obesity and glucose tolerance in mice.__Cell Rep._211521–1533. - 21
Daniela M. Valeria C. Domenico S. Mattia P. Michele B. Salvatore B. et al (2017). Beneficial effects of oral pure caffeine on oxidative stress.__J. Clin. Transl. Endocrinol._1022–27. 10.1016/j.jcte.2017.10.001 - 22
Daniele T. Bruin P. Rios E. Bruin V. (2017). Effects of exercise on depressive behavior and striatal levels of norepinephrine, serotonin and their metabolites in sleep-deprived mice.__Behav. Brain Res._33216–22. - 23
Dieter R. Lukas B. K. Katharina W. Christoph N. (2019). Sleep, insomnia, and depression.__Neuropsychopharmacology_4574–89. 10.1038/s41386-019-0411-y - 24
Dinan T. G. Cryan J. F. (2013). Melancholic microbes: a link between gut microbiota and depression?__Neurogastroenterol. Motil._25713–719. 10.1111/nmo.12198 - 25
Ding M. Satija A. Bhupathiraju S. N. Hu Y. Sun Q. Han J. et al (2015). Association of coffee consumption with total and cause-specific mortality in 3 large prospective cohorts.__Circulation_1322305–2315. 10.1161/CIRCULATIONAHA.115.017341 - 26
Dong H. Ane S. K. Wenjie M. Yang H. Fred K. T. Hongmei N. et al (2019). Coffee consumption and plasma biomarkers of metabolic and inflammatory pathways in US health professionals.__Am. J. Clin. Nutr._109635–647. 10.1093/ajcn/nqy295 - 27
Dong Y. Yan H. Zhao X. Lin R. Lin L. Ding Y. et al (2020). Gu-Ben-Fang-Xiao decoction ameliorated murine msthma in remission stage by modulating microbiota-acetate-tregs axis.__Front. Pharmacol._11:549. 10.3389/fphar.2020.00549 - 28
Edgar R. C. (2013). UPARSE: highly accurate OTU sequences from microbial amplicon reads.__Nat. Methods_10996–998. 10.1038/nmeth.2604 - 29
Emeran A. M. Kirsten T. Arpana G. (2015). Gut/brain axis and the microbiota.__J. Clin. Invest._125926–938. 10.1172/JCI76304 - 30
Erikka L. Meredith S. S. Barry I. G. Hormuzd A. K. Anil K. C. Britton T. et al (2015). Associations of coffee drinking with systemic immune and inflammatory markers.__Cancer Epidemiol. Biomarkers Prev._241052–1060. 10.1158/1055-9965.EPI-15-0038-T - 31
Eriksson E. Royo F. Lyberg K. Carlsson H. E. Hau J. (2004). Effect of metabolic cage housing on immunoglobulin A and corticosterone excretion in faeces and urine of young male rats.__Exp. Physiol._89427–433. 10.1113/expphysiol.2004.027656 - 32
Franke A. G. Bagusat C. Rust S. Engel A. Lieb K. (2014). Substances used and prevalence rates of pharmacological cognitive enhancement among healthy subjects.__Eur. Arch. Psychiatry Clin. Neurosci._26483–90. 10.1007/s00406-014-0537-1 - 33
Galland L. (2014). The gut microbiome and the brain.__J. Med. Food_171261–1272. 10.1089/jmf.2014.7000 - 34
George S. E. Ramalakshmi K. Mohan Rao L. J. (2008). A perception on health benefits of coffee.__Crit. Rev. Food Sci. Nutr._48464–486. 10.1080/10408390701522445 - 35
Giuseppe G. Justyna G. Fabio G. Edward L. G. (2017). Coffee, caffeine, and health outcomes: an umbrella review.__Annu. Rev. Nutr._37131–156. 10.1146/annurev-nutr-071816-064941 - 36
Godos J. Pluchinotta F. R. Marventano S. Buscemi S. Li Volti G. Galvano F. et al (2014). Coffee components and cardiovascular risk: beneficial and detrimental effects.__Int. J. Food Sci. Nutr._65925–936. 10.3109/09637486.2014.940287 - 37
González S. Salazar N. Ruiz-Saavedra S. Gómez-Martín M. Los Reyes-Gavilán C. G. Gueimonde M. (2020). Long-term coffee consumption is associated with fecal microbial composition in humans.__Nutrients_12:1287. 10.3390/nu12051287 - 38
Grosso G. Micek A. Castellano S. Pajak A. Galvano F. (2016). Coffee tea, caffeine and risk of depression: a systematic review and dose–response meta-analysis of observational studies.__Mol. Nutr. Food Res._60223–234. 10.1002/mnfr.201500620 - 39
Guoying W. Guo Z. Xiaoyu C. Longxiang X. Hongju W. (2020). The characteristic of virulence, biofilm and antibiotic resistance of Klebsiella pneumoniae.__Int. J. Environ. Res. Public Health_17:6278. 10.3390/ijerph17176278 - 40
Haroon B. Muhammad I. Waqar A. Sareer A. Jong R. H. Myeong O. K. (2019). Caffeine may abrogate LPS-induced oxidative stress and neuroinflammation by regulating Nrf2/TLR4 in adult mouse brains.__Biomolecules_9:719. 10.3390/biom9110719 - 41
Haskell C. F. Kennedy D. O. Wesnes K. A. Scholey A. B. (2005). Cognitive and mood improvements of caffeine in habitual consumers and habitual non-consumers of caffeine.__Psychopharmacology_179813–825. 10.1007/s00213-004-2104-3 - 42
Heintz-Buschart A. Pandey U. Wicke T. Sixel-Döring F. Janzen A. Sittig-Wiegand E. et al (2018). The nasal and gut microbiome in Parkinson’s disease and idiopathic rapid eye movement sleep behavior disorder.__Mov. Disord._3388–98. 10.1002/mds.27105 - 43
Ho S. C. Chung J. W. (2013). The effects of caffeine abstinence on sleep: a pilot study.__Appl. Nurs. Res._2680–84. 10.1016/j.apnr.2012.08.004 - 44
Hoelzl C. Knasmüller S. Wagner K. H. Elbling L. Huber W. Kager N. et al (2010). Instant coffee with high chlorogenic acid levels protects humans against oxidative damage of macromolecules.__Mol. Nutr. Food Res._541722–1733. 10.1002/mnfr.201000048 - 45
Hughes J. R. McHugh P. Holtzman S. (1998). Caffeine and schizophrenia.__Psychiatr. Serv._491415–1417. 10.1176/ps.49.11.1415 - 46
Huws S. A. Kim E. J. Lee M. R. Scott M. B. Tweed J. K. Pinloche E. et al (2011). As yet uncultured bacteria phylogenetically classified as Prevotella, Lachnospiraceae incertae sedis and unclassified Bacteroidales, Clostridiales and Ruminococcaceae may play a predominant role in ruminal biohydrogenation.__Environ. Microbiol._131500–1512. 10.1111/j.1462-2920.2011.02452.x - 47
Hwang J. H. Kim K. J. Ryu S. J. Lee B. Y. (2016). Caffeine prevents LPS-induced inflammatory responses in RAW264.7 cells and zebrafish.__Chem. Biol. Interact._2481–7. 10.1016/j.cbi.2016.01.020 - 48
Jamie J. C. Caitlin K. R. Ben L. Z. Lava T. Grace S. R. David V. F. (2019). To Sleep, perchance to dream: acute and chronic sleep deprivation in acute care surgeons.__J. Am. Coll. Surg._229166–174. 10.1016/j.jamcollsurg.2019.03.019 - 49
Jennifer M. M. Dion L. Wenqing W. Peter K. P. Lindsay E. R. Krista A. P. (2017). Navy and black bean supplementation primes the colonic mucosal microenvironment to improve gut health.__J. Nutr. Biochem._4989–100. 10.1016/j.jnutbio.2017.08.002 - 50
Jost L. Anna K. K. Petra V. Gustav J. D. Andreas R. (2020). Distinct patterns of short-chain fatty acids during flare in patients with ulcerative colitis under treatment with mesalamine or a herbal combination of myrrh, chamomile flowers, and coffee charcoal: secondary analysis of a randomized controlled trial.__Eur. J. Gastroenterol. Hepatol._32175–180. 10.1097/meg.0000000000001582 - 51
Kaisa H. Veera K. Maiju S. Tuomas H. Jolene R. B. Daniel J. S. et al (2020). Isolation of anti-inflammatory and epithelium reinforcing Bacteroides and Parabacteroides Spp. from a healthy fecal donor.__Nutrients_12:935. 10.3390/nu12040935 - 52
Kayir H. Uzbay I. T. (2006). Nicotine antagonizes caffeine-but not pentylenetetrazole-induced anxiogenic effect in mice.__Psychopharmacology(Berl)_184464–469. 10.1007/s00213-005-0036-1 - 53
Kazuchika N. Syunsuke W. Jinzhong X. Ryosuke N. Hirohisa O. Takaaki T. et al (2018). Effect of coffee or coffee components on gut microbiome and short-chain fatty acids in a mouse model of metabolic syndrome.__Sci Rep._8:16173. 10.1038/s41598-018-34571-9 - 54
Kelly J. R. Borre Y. O’ Brien C. Patterson E. El Aidy S. Deane J. et al (2016). Transferring the blues: depression-associated gut microbiota induces neurobehavioural changes in the rat.__J. Psychiatr. Res._82109–118. 10.1016/j.jpsychires.2016.07.019 - 55
Kim S. H. Park S. Y. Park Y. L. Myung D. S. Rew J. S. Joo Y. E. (2017). Chlorogenic acid suppresses lipopolysaccharide-induced nitric oxide and interleukin-1β expression by inhibiting JAK2/STAT3 activation in RAW264.7 cells.__Mol. Med. Rep._169224–9232. 10.3892/mmr.2017.7686 - 56
Kolb H. Kempf K. Martin S. (2020). Health effects of coffee: mechanism unraveled?__Nutrients_12:1842. 10.3390/nu12061842 - 57
Kotyczka C. Boettler U. Lang R. Stiebitz H. Bytof G. Lantz I. et al (2011). Dark roast coffee is more effective than light roast coffee in reducing body weight, and in restoring red blood cell vitamin E and glutathione concentrations in healthy volunteers.__Mol. Nutr. Food Res._551582–1586. 10.1002/mnfr.201100248 - 58
Krishnan H. C. Gandour C. E. Ramos J. L. Wrinkle M. C. Sanchez-Pacheco J. J. Lyons L. C. (2016). Acute sleep deprivation blocks short-and long-term operant memory in Aplysia.__Sleep_392161–2171. 10.5665/sleep.6320 - 59
Li Q. Liu Y. Sun X. Yin Z. Li H. Cheng C. et al (2019). Caffeinated and decaffeinated coffee consumption and risk of all-cause mortality: a dose–response meta-analysis of cohort studies.__J. Hum. Nutr. Diet._32279–287. 10.1111/jhn.12633 - 60
Li S. Wang Z. Yang Y. Yang S. Yao C. Liu K. et al (2017). Lachnospiraceae shift in the microbial community of mice faecal sample effects on water immersion restraint stress.__AMB Express_7:82. 10.1186/s13568-017-0383-4 - 61
Lopez Garcia E. Guallar Castillon P. Leon Muñoz L. Graciani A. Rodriguez Artalejo F. (2014). Coffee consumption and health-related quality of life.__Clin. Nutr._33143–149. 10.1016/j.clnu.2013.04.004 - 62
Ma W. Song J. Wang H. Shi F. Zhou N. Jiang J. et al (2019). Chronic paradoxical sleep deprivation-induced depression-like behavior, energy metabolism and microbial changes in rats.__Life Sci._22588–97. 10.1016/j.lfs.2019.04.006 - 63
Machado R. B. Hipólide D. C. Benedito-Silva A. A. Tufik S. (2004). Sleep deprivation induced by the modified multiple platform technique: quantification of sleep loss and recovery.__Brain Res._100445–51. 10.1016/j.brainres.2004.01.019 - 64
Magne F. Gotteland M. Gauthier L. Zazueta A. Pesoa S. Navarrete P. et al (2020). The Firmicutes/Bacteroidetes ratio: a relevant marker of gut dysbiosis in obese patients?__Nutrients_12:1474. - 65
Magoč T. Salzberg S. L. (2011). FLASH: fast length adjustment of short reads to improve genome assemblies.__Bioinformatics_272957–2963. 10.1093/bioinformatics/btr507 - 66
Mahshad K. Mazen J. H. (2017). The neuroprotective effects of caffeine in neurodegenerative diseases.__CNS Neurosci. Ther._23272–290. 10.1111/cns.12684 - 67
Malinalli B. P. Fausto S. M. Gonzalo V. P. Fengyang H. Julio César A. P. Rafael B. et al (2018). Cytokine and microRNA levels during different periods of paradoxical sleep deprivation and sleep recovery in rats.__PeerJ_13:5567. 10.7717/peerj.5567 - 68
Marjolaine V. D. Sylvie M. Sophie G. Thomas B. Damien B. Bertrand E. et al (2019). Immunomodulatory effects of Lactobacillus plantarum on inflammatory response induced by Klebsiella pneumoniae.__Infect. Immun._87:e00570-19. 10.1128/iai.00570-19 - 69
Martini D. Del Bo’ C. Tassotti M. Riso P. Del Rio D. Brighenti F. et al (2016). Coffee consumption and oxidative stress: a review of human intervention studies.__Molecules_21:979. 10.3390/molecules21080979 - 70
Matthew T. S. Eric R. L. Emily F. Thomas U. M. Claire E. K. Mergim G. et al (2020). Functional and genomic variation between human-derived isolates of Lachnospiraceae reveals inter- and intra-species diversity.__Cell Host Microbe_28134–146.e4. 10.1016/j.chom.2020.05.005 - 71
McEwen B. S. (2006). Sleep deprivation as a neurobiologic and physiologic stressor: allostasis and allostatic load.__Metabolism_5520–23. 10.1016/j.metabol.2006.07.008 - 72
Meetu W. Garima C. Koustav R. Surajit S. Satyanarayan D. Vishal J. et al (2018). Caffeine and modafinil ameliorate the neuroinflammation and anxious behavior in rats during sleep deprivation by inhibiting the microglia activation.__Front. Cell Neurosci._12:49. 10.3389/fncel.2018.00049 - 73
Megumi F. T. Yusuke N. Kenji T. Mika T. Yuma I. Ami S. et al (2020). Pyrocatechol, a component of coffee, suppresses LPS-induced inflammatory responses by inhibiting NF-κB and activating Nrf2.__Sci .Rep._10:2584. 10.1038/s41598-020-59380-x - 74
Mengmei Y. Yali C. Hui Z. Tinglin P. Charles M. Ting W. et al (2017). Assessment of mouse cognitive and anxiety-like behaviors and hippocampal inflammation following a repeated and intermittent paradoxical sleep deprivation procedure.__Behav. Brain Res._32169–78. 10.1016/j.bbr.2016.12.034 - 75
Michael R. I. Tuff W. Marissa C. Richard O. Elizabeth C. B. (2015). Sleep loss activates cellular inflammation and signal transducer and activator of transcription (STAT) family proteins in humans.__Brain Behav. Immun._4786–92. 10.1016/j.bbi.2014.09.017 - 76
Na J. Susan S. B. Colleen A. N. Maria T. Liting C. Yong W. et al (2018). Gut microbiome may contribute to insulin resistance and systemic inflammation in obese rodents: a meta-analysis.__Physiol. Genomics_50244–254. 10.1152/physiolgenomics.00114.2017 - 77
Nakayama T. Oishi K. (2013). Influence of coffee (Coffea arabica) and galacto-oligosaccharide consumption on intestinal microbiota and the host responses.__FEMS Microbiol. Lett._343161–168. 10.1111/1574-6968.12142 - 78
Navarro A. M. Abasheva D. Martínez-González M. Á Ruiz-Estigarribia L. Martín-Calvo N. Sánchez-Villegas A. et al (2018). Coffee consumption and the risk of depression in a middle-aged cohort: the SUN project.__Nutrients_10:1333. 10.3390/nu10091333 - 79
Patrice D. C. Willem M. V. (2017). Next-generation beneficial microbes: the case of Akkermansia muciniphila.__Front. Microbiol._8:1765. 10.3389/fmicb.2017.01765 - 80
Paz-Graniel I. Babio N. Becerra-Tomás N. Toledo E. Camacho-Barcia L. Corella D. et al (2020). Association between coffee consumption and total dietary caffeine intake with cognitive functioning: cross-sectional assessment in an elderly Mediterranean population.__Eur. J. Nutr._602381–2396. 10.1007/s00394-020-02415-w - 81
Plovier H. Everard A. Druart C. Depommier C. Van Hul M. Geurts L. et al (2016). A purified membrane protein from Akkermansia muciniphila or the pasteurized bacterium improves metabolism in obese and diabetic mice.__Nat. Med._23107–113. 10.1038/nm.4236 - 82
Rahmani M. Rahmani F. Rezaei N. (2020). The brain-derived neurotrophic factor: missing link between sleep deprivation, insomnia, and depression.__Neurochem. Res._45221–231. 10.1007/s11064-019-02914-1 - 83
Renouf M. Marmet C. Giuffrida F. Lepage M. Barron D. Beaumont M. et al (2014). Dose-response plasma appearance of coffee chlorogenic and phenolic acids in adults.__Mol. Nutr. Food Res._58301–309. 10.1002/mnfr.201300349 - 84
Robert E. R. Hao T. D. (2014). The prospective association between sleep deprivation and depression among adolescents.__Sleep_37239–244. 10.5665/sleep.3388 - 85
Rothenberg D. O. Zhou C. Zhang L. (2018). A review on the weight-loss effects of oxidized tea polyphenols.__Molecules_23:1176. 10.3390/molecules23051176 - 86
Sanchez Villegas A. Martínez González M. A. (2013). Diet, a new target to prevent depression?__BMC Med._11:3. 10.1186/1741-7015-11-3 - 87
Scharf G. Prustomersky S. Huber W. W. (2001). Elevation of glutathione levels by coffee components and its potential mechanisms.__Adv. Exp. Med. Biol._500535–539. 10.1007/978-1-4615-0667-6_82 - 88
Schindler R. Mancilla J. Endres S. Ghorbani R. Clark S. C. Dinarello C. A. (1990). Correlations and interactions in the production of interleukin-6 (IL-6), IL-1, and tumor necrosis factor (TNF) in human blood mononuclear cells: IL-6 suppresses IL-1 and TNF.__Blood_7540–47. - 89
Schirmer M. Garner A. Vlamakis H. Xavier R. (2019). Microbial genes and pathways in inflammatory bowel disease.__Nat. Rev. Microbiol._17497–511. 10.1038/s41579-019-0213-6 - 90
Shifu C. Yanqing Z. Yaru C. Jia G. (2018). Fastp: an ultra-fast all-in-one FASTQ preprocessor.__Bioinformatics_34i884–i890. 10.1093/bioinformatics/bty560 - 91
Shin J. W. Wang J. H. Kang J. K. Son C. G. (2010). Experimental evidence for the protective effects of coffee against liver fibrosis in SD rats.__J. Sci. Food Agric._90450–455. 10.1002/jsfa.3838 - 92
Shin N. R. Whon T. W. Bae J. W. (2015). Proteobacteria: microbial signature of dysbiosis in gut microbiota.__Trends Biotechnol._33496–503. 10.1016/j.tibtech.2015.06.011 - 93
Singh R. P. Halaka D. A. Hayouka Z. Tirosh O. (2020). High-fat diet induced alteration of mice microbiota and the functional ability to utilize fructooligosaccharide for ethanol production.__Front. Cell Infect. Microbiol._10:376. - 94
Sinha R. Abu-Ali G. Vogtmann E. Fodor A. A. Ren B. Amir A. et al (2017). Assessment of variation in microbial community amplicon sequencing by the Microbiome Quality Control (MBQC) project consortium.__Nat. Biotechnol._351077–1086. 10.1038/nbt.3981 - 95
Soohan J. Min Hyung K. Jae Hee P. Yoonhwa J. Kwang Suk K. (2017). Cellular antioxidant and anti-inflammatory effects of coffee extracts with different roasting levels.__J. Med. Food_20626–635. 10.1089/jmf.2017.3935 - 96
Stachyshyn S. Ali A. Wham C. Knightbridge-Eager T. Rutherfurd-Markwick K. (2021). Caffeine consumption habits of New Zealand tertiary students.__Nutrients_13:1493. 10.3390/nu13051493 - 97
Stackebrandt E. Goebel B. M. (1994). Taxonomic note: a place for DNA-DNA reassociation and 16S rRNA sequence analysis in the present species definition in bacteriology.__Int. J. Syst. Bacteriol._44846–849. 10.1099/00207713-44-4-846 - 98
Stefanello N. Spanevello R. M. Passamonti S. Porciúncula L. Bonan C. D. Olabiyi A. A. et al (2018). Coffee, caffeine, chlorogenic acid, and the purinergic system.__Food Chem. Toxicol._123298–313. 10.1016/j.fct.2018.10.005 - 99
Su S. H. Shyu H. W. Yeh Y. T. Chen K. M. Su S. J. (2013). Caffeine inhibits adipogenic differentiation of primary adipose-derived stem cells and bone marrow stromal cells.__Toxicol. Vitro_271830–1837. 10.1016/j.tiv.2013.05.011 - 100
Ting G. Zixu W. Yulan D. Jing C. Rutao L. Xintong W. et al (2019). Role of melatonin in sleep deprivation-induced intestinal barrier dysfunction in mice.__J. Pineal. Res._67e12574. 10.1111/jpi.12574 - 101
Tsujimoto T. Kajio H. Sugiyama T. (2017). Association between caffeine intake and all-cause and cause-specific mortality: a population-based prospective cohort study.__Mayo Clin. Proc._921190–1202. 10.1016/j.mayocp.2017.03.010 - 102
Turner P. V. Vaughn E. Sunohara Neilson J. Ovari J. Leri F. (2012). Oral gavage in rats: animal welfare evaluation.__J. Am. Assoc. Lab. Anim. Sci._5125–30. - 103
Uri G. Tom K. Henrik B. N. (2017). Oscillospira and related bacteria-From metagenomic species to metabolic features.__Environ. Microbiol._19835–841. 10.1111/1462-2920.13658 - 104
Vaváková M. Ďuračková Z. Trebatická J. (2015). Markers of oxidative stress and neuroprogression in depression disorder.__Oxid. Med. Cell Longev._2015:898393. 10.1155/2015/898393 - 105
Villafuerte G. Miguel-Puga A. Rodríguez E. M. Machado S. Manjarrez E. Arias-Carrión O. (2016). Sleep deprivation and oxidative stress in animal models: a systematic review.__Oxid. Med. Cell Longev._2015:234952. 10.1155/2015/234952 - 106
Ward P. J. Hubscher C. H. (2012). Persistent polyuria in a rat spinal contusion model.__J. Neurotrauma._292490–2498. 10.1089/neu.2012.2402 - 107
Wierzejska R. (2012). Caffeine-common ingredient in a diet and its influence on human health.__Rocz. Panstw. Zakl. Hig._63:141. - 108
World Health Organization (2017). __Depression and Other Common Mental Disorders: Global Health Estimates._Geneva: WHO. - 109
Xiaoyu G. Qiuhong X. Ping K. Ling L. Sheng S. Boyu X. et al (2018). Polyphenol-and caffeine-rich postfermented pu-erh tea improves diet-induced metabolic syndrome by remodeling intestinal homeostasis in mice.__Infect. Immun._86:e00601-17. 10.1128/iai.00601-17 - 110
Xue D. Shiru L. Jing S. Yan L. Dongfeng Z. (2020). Association of coffee, decaffeinated coffee and caffeine intake from coffee with cognitive performance in older adults: national health and nutrition examination survey (NHANES) 2011–2014.__Nutrients_12:840. 10.3390/nu12030840 - 111
Yamashita K. Yatsuya H. Muramatsu T. Toyoshima H. Murohara T. Tamakoshi K. (2012). Association of coffee consumption with serum adiponectin, leptin, inflammation and metabolic markers in Japanese workers: a cross-sectional study.__Nutr. Diabetes_2:e33. 10.1038/nutd.2012.6 - 112
Yan Y. Zhou X. Guo K. Zhou F. Yang H. (2020). Chlorogenic acid protects against indomethacin-induced inflammation and mucosa damage by decreasing _Bacteroides_-derived LPS.__Front. Immunol._11:1125. 10.3389/fimmu.2020.01125 - 113
Yuji N. Kazuhiko U. Tomohisa T. (2018). A next-generation beneficial microbe: Akkermansia muciniphila.__J. Clin. Biochem. Nutr._6333–35. 10.3164/jcbn.18-57 - 114
Zhai X. J. Chen F. Chen C. Zhu C. R. Lu Y. N. (2015). LC–MS/MS based studies on the anti-depressant effect of hypericin in the chronic unpredictable mild stress rat model.__J. Ethnopharmacol._169363–369. 10.1016/j.jep.2015.04.053 - 115
Zheng P. Zeng B. Zhou C. Liu M. Fang Z. Xu X. et al (2016). Gut microbiome remodeling induces depressive-like behaviors through a pathway mediated by the Host’s metabolism.__Mol. Psychiatry_21786–796. 10.1038/mp.2016.44
Keywords
coffee, decaffeinated coffee, sleep deprivation, depression, gut microbiota
Citation
Gu X, Zhang S, Ma W, Wang Q, Li Y, Xia C, Xu Y, Zhang T, Yang L and Zhou M (2022) The Impact of Instant Coffee and Decaffeinated Coffee on the Gut Microbiota and Depression-Like Behaviors of Sleep-Deprived Rats. Front. Microbiol. 13:778512. doi: 10.3389/fmicb.2022.778512
Received
21 September 2021
Accepted
04 January 2022
Published
25 February 2022
Volume
13 - 2022
Edited by
Ekaterina Avershina, Inland Norway University of Applied Sciences, Norway
Reviewed by
Silvia Arboleya, Institute of Dairy Products of Asturias, Spanish National Research Council (CSIC), Spain; Zabdiel Alvarado-Martínez, University of Maryland, College Park, United States
Updates
Copyright
© 2022 Gu, Zhang, Ma, Wang, Li, Xia, Xu, Zhang, Yang and Zhou.
This is an open-access article distributed under the terms of the Creative Commons Attribution License (CC BY). The use, distribution or reproduction in other forums is permitted, provided the original author(s) and the copyright owner(s) are credited and that the original publication in this journal is cited, in accordance with accepted academic practice. No use, distribution or reproduction is permitted which does not comply with these terms.
*Correspondence: Mingmei Zhou, zhoumm368@163.com
†These authors have contributed equally to this work
This article was submitted to Microorganisms in Vertebrate Digestive Systems, a section of the journal Frontiers in Microbiology
Disclaimer
All claims expressed in this article are solely those of the authors and do not necessarily represent those of their affiliated organizations, or those of the publisher, the editors and the reviewers. Any product that may be evaluated in this article or claim that may be made by its manufacturer is not guaranteed or endorsed by the publisher.