2. Structure of the FABLE Calculator and conventions (original) (raw)
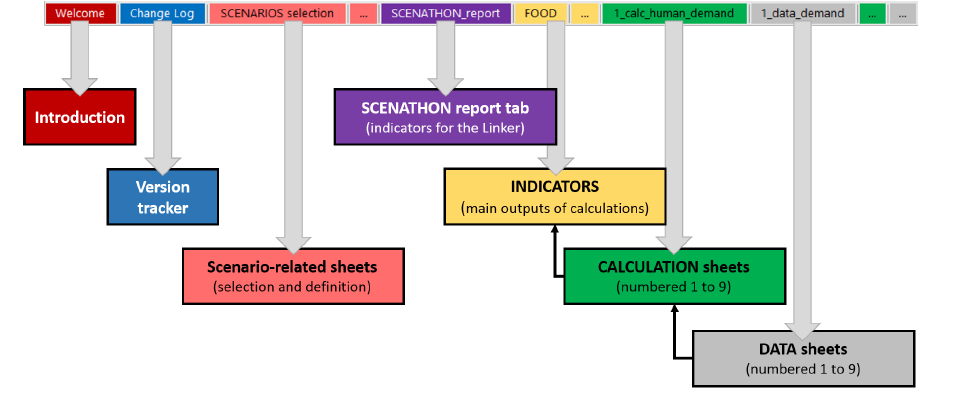
The current version of the FABLE Calculator is a light Excel file (less than 6 MB) that contains country or regional historical data in the grey “DATA” sheets, the calculation formulas for the calculation in the green “CALCULATION” sheets, the definition and selection of scenarios in the light red “SCENARIOS” sheets, and the visualization of the main results in the yellow “INDICATORS” sheets (Figure 1).
The worksheet called “CHANGE LOG” is used to document the changes which are made to the Calculator over time by one or different users. This is useful for the user to avoid forgetting what has changed and, in the case of multiple people working with the same Calculator, to ensure that all users know which changes have been made. We recommend that the FABLE Calculator be saved under a different version name after a change or a series of changes have been implemented.
Figure 1. Overview of the FABLE Calculator Excel workbook
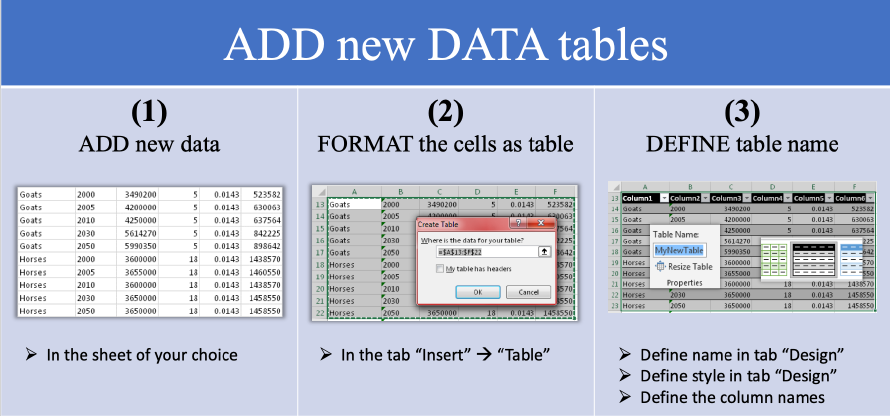
Each worksheet usually contains several tables. Each table is formatted as an Excel object called “Table” (Figure 2). This feature makes it possible to:
- give a name to a table which can be directly used in calculations,
- automatically recognize all column names which can be used in calculations as an attribute of the table name,
- automatically copy the calculation entered in the first row to all the other rows or lines of the table in the same column,
- better understand the formula when table names are used instead of cell numbers, and
- avoid mistakes in the formulas when rows/columns number of a table are changed.
Figure 2. Format as table in Excel
Each table uses the following conventions summarized in Figure 3:
- The name of the Table which is recognized as an object by Excel should be written on the top of the table.
- The table should be numbered and described by clear text (potentially dividing the table into several sections if it facilitates understanding).
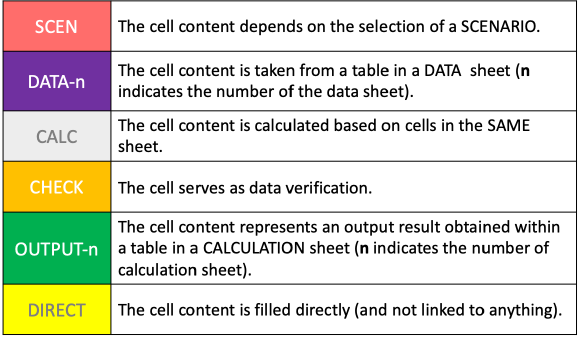
- Each column of the table should use the legend presented in Figure 4 to allow the user to quickly identify the type of information that is used in a column: a parameter defined by a scenario (“SCEN”), a parameter that comes from certain input data tables (“DATA”), a variable that results from a computation in the column (“CALC”), a variable computed in another table or column (“OUTPUT”), or a parameter that has been entered manually i.e., which is not related to any other table or column (DIRECT).
- Each column should be described with clear text and the unit should be specified.
Figure 3. Information displayed in each table
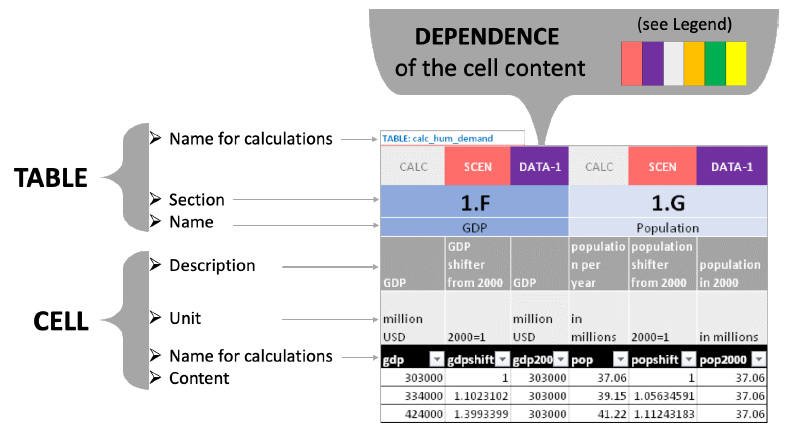
Figure 4. Legend for table columns
We define a pathway as a combination of scenarios that represents the coherent development of a system along a certain trajectory. Scenarios are the suite of possible actions that set a pathway on a certain trajectory. Assumptions are the conditions that a modeler establishes before the model is run to make predictions on, for example, causality chains and changes in specific parameters of the model according to the selected scenarios. A parameter is a constant in model simulations except when it is changed for a specific scenario (i.e. the modeler decides on its value before running the model) - this is an input of the model. A variable represents a model state and results from the model’s computations (i.e. the modeler does not decide on its value before the model is run) - this is an outcome of the model.