2.T3 Training Materials: Exercise "Introduction to FABLE Calculator" (original) (raw)
Exercise: "Introduction to FABLE Calculator"
Changing population scenarios
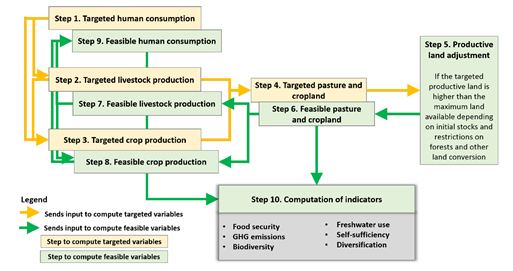
1.- In which computation step do you think the population parameter is used first?
2.- What is the population scenario with the lowest population growth between 2000 and 2050, in the Open Source calculator?
3.- Where is the data related to population in the FABLE Calculator?
4.- Select the population scenario with the lowest growth.
5.- Everything else remaining the same, what would you expect would be the impacts of the lower population growth on:
a) food security
b) GHG emissions
c) land use
Solutions
1.- The Population parameter is used in the first computation step, the calculation of targeted human demand, which takes place in the worksheet called "1_calc_human_demand". It enters the computation of GDP per capita in Table 1.G, which will later inform the calculation of food and non-food consumption per capita, as well as the calculation of total human consumption, where it is multiplied by consumption per capita and added to the consumption of biofuels. It is also used in the computation of the Average Minimum Dietary Energy Requirement (MDER) in Table 1.K (Calc_min_daily_kcal). The MDER is used to define a minimum level of nutrition, against which the FABLE Calculator compares feasible consumption. An average feasible consumption level below, or just at, the MDER level could be worrying as it would mean that each individual in a given country would have just enough food to cover the minimum requirements, if the available food were equally shared across the population. This can be seen on the first graph of the yellow worksheet called "FOOD", entitled "Daily food intake per capita".
2.- Table S.2 for the Population projections in the worksheet Scenarios Selection is copied below.
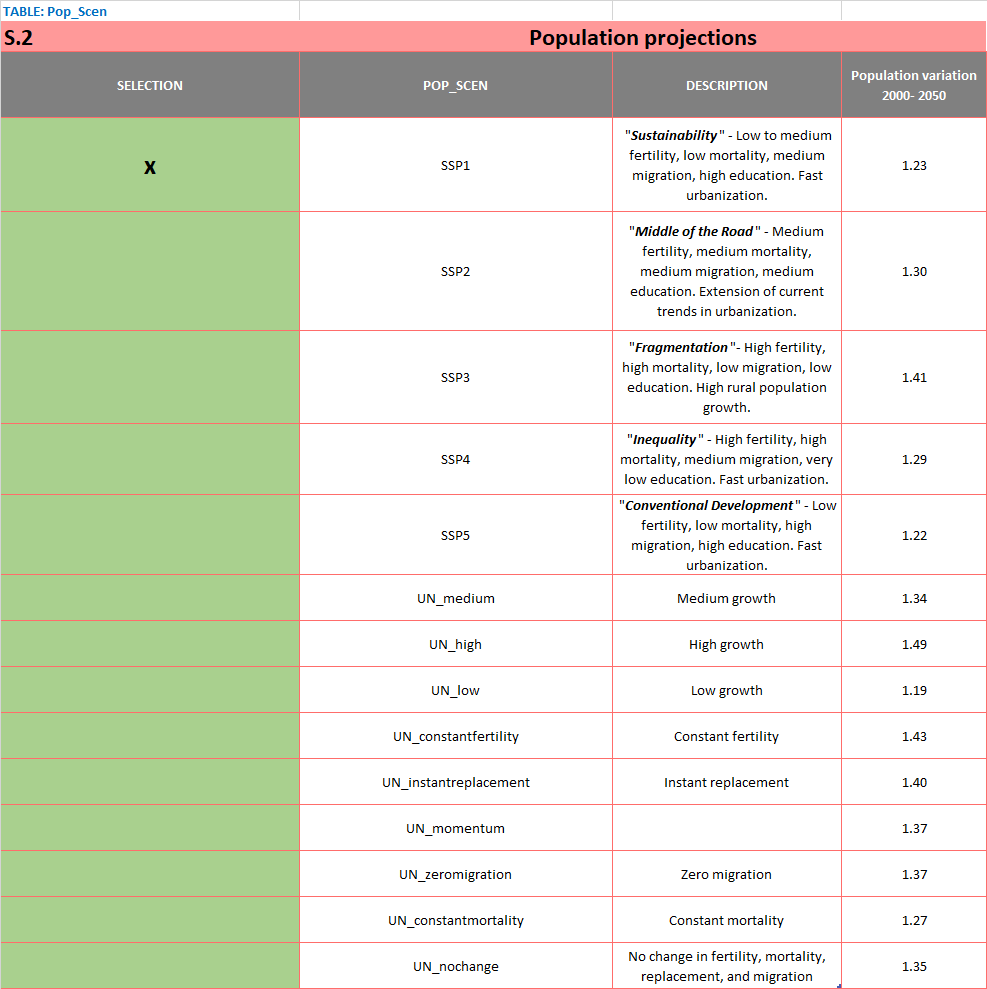
In this Table, you can see that the lowest population growth between 2000 and 2050 is 1.19, corresponding to the "UN_low" Population projection.
3.- The data related to population in the FABLE Calculator is found in the worksheet called "1_data_demand", in Table 1.1 (gdp_pop_hist), column [POPT]. This data is obtained from UN DESA. (2017). World Population Prospects: The 2017 Revision, Volumen II: Demographic Profiles. https://population.un.org/wpp/Publications/Files/WPP2017_Volume-II-Demographic-Profiles.pdf
4-5.- Once you have selected the population scenario with the lowest growth, compare the results you get in the yellow sheets with other population scenarios, in terms of:
a) Food security.- As the population grows, more human consumption of food products is required, which requires more human production or imports
b) GHG emissions.- As the population grows, GHG emissions grow as well
c) land use.- As the population grows, more human consumption of food products is required, which will increase the need for more land used for productive activities (i.e. agriculture or livestock)