3. Scenarios (original) (raw)
We have established a list of parameters that can be changed through the selection of different scenarios. Each parameter and corresponding alternative scenarios are grouped by tables. By default, the Open Calculator has 16 parameters that can be modified through scenarios, each of which has between 2 to 17 possible alternative values. There are, therefore, millions of possible combinations of scenarios that lead to different pathways (Table 1). The user can select predefined scenarios or add new scenarios, but the latter requires a good understanding of the Calculator.
Table 1. Example of a pathway definition in the FABLE Calculator
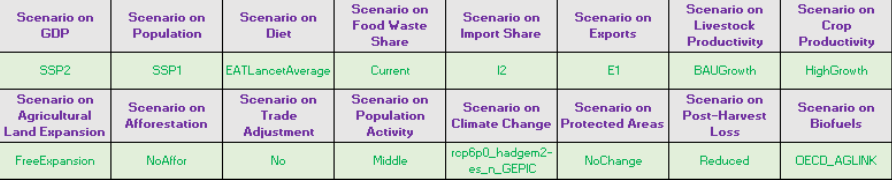
Note: The parameters that can be changed through scenarios are listed in purple, the selected scenarios are in green.
To select a scenario, the user simply needs to enter "x" next to the scenario that they want to test (Table 2). There can be only one scenario selected per table. The FABLE Calculator’s computation steps are automatically updated with the parameter values corresponding to the selected scenarios (see note at the end of this section), using SUMIFS and VLOOKUP Excel formulas (Appendix 2), respectively.
Table 2. Example of scenario selection
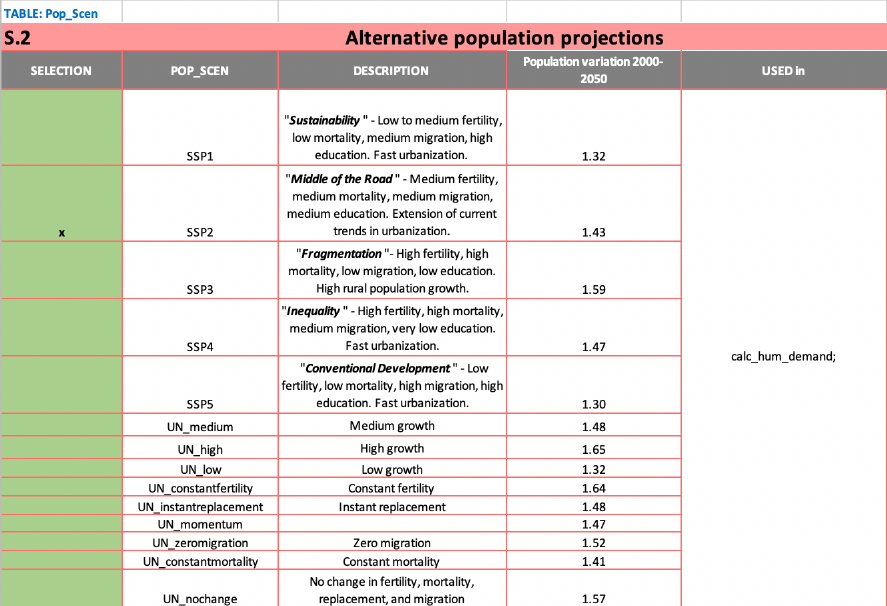
Note: “x” indicates which scenario is selected in the first column; the second column indicates the short name of the scenario that will appear in the different tables of the Calculator; the third column describes the scenario; the fourth column summarizes the quantitative change introduced by each scenario; the fifth column lists the tables where the scenario is used.
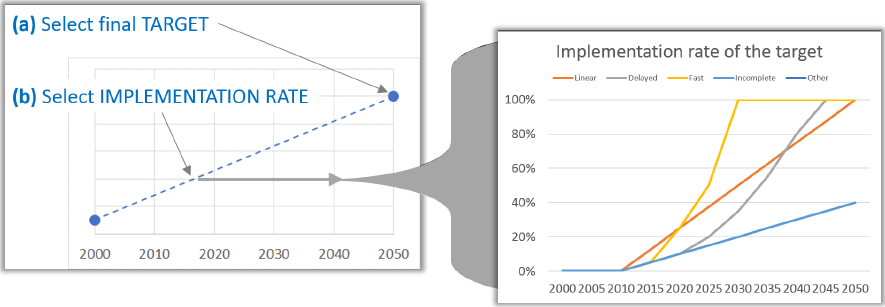
A key concept for implementing the scenarios are shifters, or time-step-specific relative changes applied to a parameter’s initial value, that introduce parameter time variation. Some shifters are created based on historical values or trajectories. The combination of final targeted values for 2050 defined by the user and an implementation rate of the target between 2010 and 2050 is also used to compute the evolution of some parameters for every time step for different scenarios. The implementation rate parameter is used to translate targeted values for 2050 as targeted values for each time step between 2015 and 2050 (Figure 5). The implementation coefficient is the share of the difference between the current situation and the 2050 target that is assumed to be achieved in each time-step.
Figure 5. Definition of alternative implementation rates for scenarios
In the next pages, we describe the various parameters that can be changed by selecting different scenarios.
Note: Excel tip: if you have a laptop / PC with limited computational power, you should turn off auto calculation while making changes (go to Formulas/Calculation options/ and select Manual), and just manually run the calculation (go to Formulas and select Calculate now) when you want to see the impact on the results. It is also recommended to turn the option back to Automatic when you have finished making changes, so that all the steps are considered in the final results.