3.3 Food waste (original) (raw)
In the FABLE Calculator, we account for food losses at the consumption level that include losses during distribution (e.g. supermarket retail) and at the household level. Food waste is represented as a share of total food available. For instance, if the targeted food consumption is 2,500 kilocalories per capita per day and the food waste at the household level represents 10%, the total market supply needs correspond to an average consumption level of 2,777 kilocalories per capita per day i.e. target /(1 - share of losses). The calorie, protein, and fat intake is thus computed on the basis of food consumption minus consumption losses. This can explain some deviations with the reported statistics on food consumption by the FAO, which does not take into account these losses at the consumption level.
In the previous version of the Calculator, it was assumed that food losses represented 10% of total consumption. The new version represents shares of specific consumption losses by food group and by region using FAO reported values for large regions (Gustavsson et al., 2011). Three scenarios are available: a constant share of food waste over time, increased food waste over time, and reduced food waste over time. Specific relative changes and implementation rates per food group can be defined.
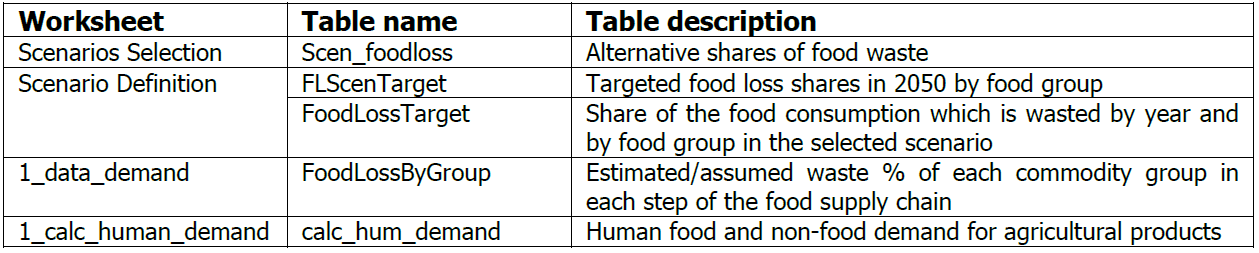
Table 6. List of tables related to the food waste scenarios