3.7T3 Training Materials: Exercise "Scenario definition" (original) (raw)
Exercise: "Scenario definition"
In the videos above, you have learned how to change the scenarios in the worksheet called “Scenarios selection” of the Open Source calculator, and then how to understand the values included in the "Scenarios Definition" worksheet, so that you can adapt them to fit the reality of your country.
In this exercise, we will further explore the Afforestation scenario, especially looking for a tradeoff, or “a balance achieved between two desirable but incompatible features; a compromise.” The FABLE Calculator is an accounting model that can help users interested to explore synergies and tradeoffs between the different sectors represented in the model, such as land cover and sustainability. A typical tradeoff that countries face is the need to maintain some type of sustainability criteria, such as intact forests, vs the pressures that economic growth or population increase bring to this sustainability criteria, such as the need to expand pasture and cropland, to feed the population. The tradeoff here is: for a certain amount of forests increased, there could be a decrease in the available land for pasture and cropland, and viceversa.
Let us find this tradeoff in the Open Source calculator, by playing around with the values for the Bonn Challenge target, which as you can review in the video of Scenarios Definition, are found in the first columns of table S.10a:
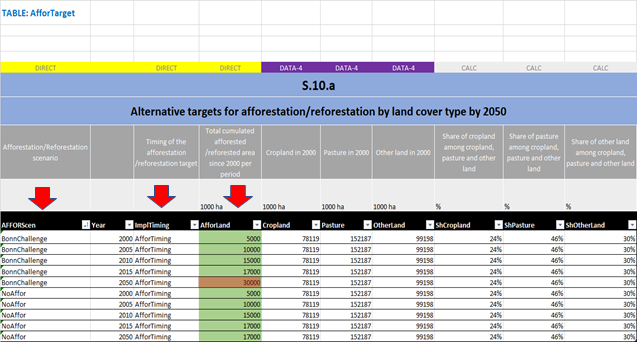
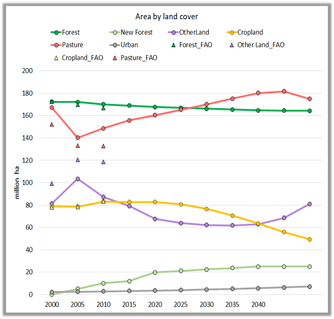
Let us select Bonn Challenge in the Scenarios Selection worksheet. By selecting this scenario, the rows that will be active in the worksheet Scenario Definition are the first ones, where the target for 2050 is 30,000 kha of afforested land. Now, let us analyze the implications that this selection and definition have on the resulting graph found in the LAND worksheet, entitled "Area by land cover". As you can see in the graph below, the amount of land dedicated to the 2050 Bonn Challenge target is very minor (~30,000 kha), when compared to the total land for this region, which is ~500 millions ha (You can see this last number in the first table in the LAND worksheet, called "TABLE: ResultsLand", in the column entitled "TOTAL").
What would happen if we decide to increase the afforestation 2050 target of the Bonn Challenge to half the land available, namely to ~250,000? Arguably, this may not be a realistic target, but it could be useful as an exercise to find possible tradeoffs in the system. Let us experiment and change the Bonn Challenge 2050 value, by substituting the 30,000 kha currently in the respective row, to 250,000 kha. We can also adjust the implementation rate parameters or implementation coefficients. What happens to the land cover in the first graph of the LAND worksheet?
Below goes the resulting graph:
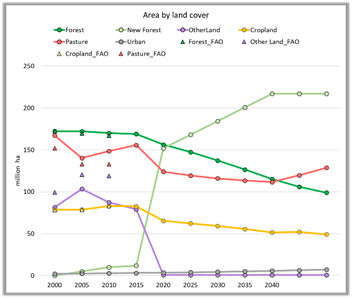
How do you explain these changes in land cover?
One explanation is that we have found a tradeoff: An increase in the land used for afforestation leads to a decrease in the land available for pasture and cropland, as well as a decrease in "other natural land".
What would explain these changes? How would you explain this tradeoff? Write these thoughts in one paragraph, which can be useful to you as you progress in exploring the FABLE Calculator, as you advance reading the next sections of the wiki.