4.0T3 Training Materials: Exercise "FABLE Calculator model structure" (original) (raw)
Exercise: "FABLE Calculator model structure"
The table entitled “ChkCrops” is a very useful built-in tool of the FABLE Calculator to make sure your demand and supply of agricultural products is in line with historical values, for all the steps in the economic accounting process: consumption, imports, exports, production and harvested area. Use the Excel “Find” tool to go where this table is located in the Open Source FABLE Calculator. You can check the video here, in case you have any questions on how to do this!
Once you are in this table, let us analyze two crops, corn and nuts, for the historical years in the calculator, which are 2000, 2005, and 2010. You can use the data filters to focus the visibility only in these rows, as follows:
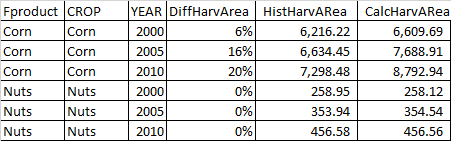
Let us focus this exercise only on Harvested Area. What this table does, is to compare historical values from the default dataset of the calculator for any given good, with the values that the model calculates for those same years. This gives the user a way to calibrate the model. Ideally, all model calculated values should match the historical values up to 100%, so that the column above named [DiffHarvArea] would show 0% difference.
As you see above, this comparison is almost perfect for nuts, for which the three years show almost a 100% match in all values (or 0% difference). However, the same is not true for corn. Troubleshooting the FABLE Calculator will usually entail finding out why the model is not resulting in the numbers we would like for it to have, given our scenario choices and data available. One possible source of error in this case is that the historical values obtained by default are not correct. This can be the case when the default dataset (i.e. FAOSTAT) does not reflect adequately the production of a particular agricultural good in our country. For example, FAO can call bananas what we in our country call plantains and bananas, so the comparison is not valid. There are many possible sources of inconsistencies, for example, when some crops are not fully accounted for in the harvested area, or when there is an error in the calculation in previous steps to calculating harvested area.
If we have confirmed that the historical dataset values for corn are adequate, the next step is to try to find out where the error or infeasibility comes from, in the calculator. This requires tracing formulas in different tables of the Excel model, and understanding/validating the logic of these different steps. Let us start tracing the formula for CalcHarvArea. When you click in any cell of that column, you obtain the following formula:
=IF([@Fproduct]=[@CROP],SUMIFS(calc_crops[Harvarea],calc_crops[CROP],[@CROP],calc_crops[YEAR],[@YEAR]),0).
Breaking it down:
=IF([@Fproduct]=[@CROP],
SUMIFS(calc_crops[Harvarea],calc_crops[CROP],[@CROP],calc_crops[YEAR],[@YEAR])
,0)
And translating it to words:
If the value in this same row under the column Fproduct is the same as the value in this same row for the column CROP,
If the above is true, recall the value that is in table “calc_crops” and the column “Harvarea”, which matches the criteria of having the same crop and the same year
If the above is false, print zero
Making sense of this set of instructions, we see that for products that are final (i.e. not inputs in the processing of other final products), which is the case for corn, the formula recalls the value from the mentioned table and column-cell. Look for the table “calc_crops” and the column “Harvarea”, for the rows of corn, and make sure the numbers are the same, for each respective year! You have now done your first investigation into the FABLE Calculator! High five!
Continue tracing formulas in this way, now understanding the formula for calc_crops[Harvearea], which reads:
=IFERROR([@ProdCrop]*[@Fprodcount]/[@Pdty],"")
If you have doubts on the Excel functions, check the FABLE Calculator website, in the section of Excel formulas, or any official Excel forum online.
Try to understand what may be causing the difference between historical values and the numbers given by the model. This activity is not trivial, and it takes some time to practice with different formulas, to understand the causal links involved, and begin to pinpoint sources of error or inconsistences. Once you have had enough practice, you will be able to spot and fix these mismatches with more ease! 😊