4.1T2 Training Materials: Quiz "Human Demand" (original) (raw)
Quiz: "Human Demand"
(Please write down your answers in a notebook or a white sheet and compare them with the answers enlisted at the end of this section.)
Food Security in the FABLE Calculator is captured using the indicator "Average daily energy intake per capita", in comparison with the minimum daily energy requirement (MDER), as follows:
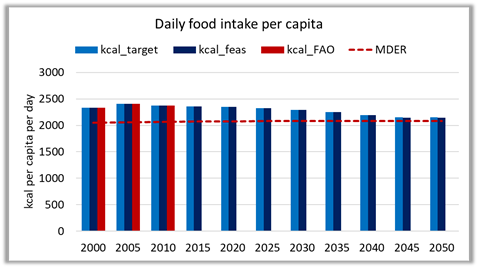
As you can see in the graph above, both targeted (light blue bars) and feasible (dark blue bars) values lie above the red-dotted MDER line for most of the period 2000-2050, as a proxy measure of attaining a minimum level of food consumption, in average.
An important question is: What changes in scenario choices could have an impact on any of these indicators?
To find out, let us trace back the formulas that make up the light blue columns, called kcal_target. We enlist below a back-tracing of two steps of the columns involved and the formulas required, and your task is to explain them in words and understand the causal links of each step.
1.- [kcal_target] = SUMIFS(Results_Diets[kcal_trend],Results_Diets[YEAR],[@YEAR])
2.- Results_Diets[kcal_trend]= =IF([@YEAR]<2015,[@[kcal_hist]],IF(SUMIFS(DietScenDef[Calc],DietScenDef[PROD_GROUP],[@[PROD_GROUP]],DietScenDef[Year],"2015")>0,SUMIFS(DietScenDef[Calc],DietScenDef[PROD_GROUP],[@[PROD_GROUP]],DietScenDef[Year],[@YEAR]),SUMIFS(calc_hum_demand[cal],calc_hum_demand[prodgroup],[@[PROD_GROUP]],calc_hum_demand[year],[@YEAR])+SUMIFS(MissingGroupsCalories[Value],MissingGroupsCalories[Element],"Kcal supply",MissingGroupsCalories[Year],"2010",MissingGroupsCalories[Prod_Group],[@[PROD_GROUP]])))
3a.- DietScenDef[Calc] =[@current]+[@ImplCoef]*[@DiffTarget]
3b.-SUMIFS(calc_hum_demand[cal],calc_hum_demand[prodgroup],[@[PROD_GROUP]],calc_hum_demand[year],[@YEAR])+SUMIFS(MissingGroupsCalories[Value],MissingGroupsCalories[Element],"Kcal supply",MissingGroupsCalories[Year],"2010",MissingGroupsCalories[Prod_Group],[@[PROD_GROUP]]
Answers:
1.- The targeted kilocalorie consumption per capita per day is calculated by recalling a value from the table “Results_Diets”, in the column “kcal_trend” for the same year of the current row.
2.- The targeted kilocalorie consumption per capita per day, per product, is calculated with the following IF conditional formula:
IS the year in the current row less than 2015?
If the condition above is true, recall the value of the column in this table called “kcal_hist”
If the condition above is false, a new conditional formula opens:
Is the value in table “DietScenDef, in the column “Calc” for the same PROD_GROUP in both tables, of this row, and for the year 2015 greater than zero?
If the condition above is true, recall the value of table “DietScenDef, in the column “Calc” for the same PROD_GROUP in both tables, and for the same year of this row.
If the condition above is false, recall the value of table “calc_hum_demand” in the column “cal”, for the same PROD_GROUP in both tables, and for the same year of this row. Then, add this value to the value found in “MissingGroupsCalories” in the column “Value”, where the column Element in the table MissingGroupsCalories matches “Kcal supply", for the same PROD_GROUP in both tables, of this row, and for the year 2010.
As you can see with this formula, some of the calculations of the model are simple, but they can combine various values in different places of the file, which makes following up harder. With practice, it will be easier to track formulas, although perhaps one will not escape writing some of them down in a piece of paper!
3a. The second IF conditional subclause above recalls the targeted consumption of calories, which is defined in the Scenario Definition worksheet as a sum between the FAO value for calorie consumption for that year and product group, plus the result of the multiplication between an implementation coefficient and the difference between target and real values, as is all included in Table S.3.d, DietScenDef.
3b. The second part of the last IF conditional above sums two values: the computed calories consumption for the same product group and year in the current row, and the consumption per capita per day of a set of “missing goods” that are added in a separate table.
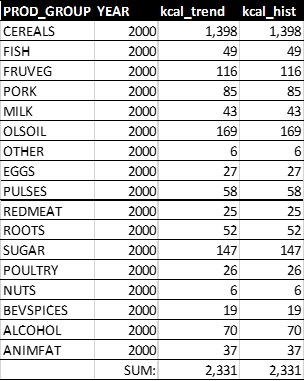
Another way to explore the above formula for targeted kilocalorie consumption per capita per day is to trace it with numbers. For the year 2000, the value in [kcal_target] is 2,331 kcalories, which is a sum of all values in Results_Diets[kcal_trend] for the year 2000, as follows:
Each number in this table, per PROD_GROUP is a result of the formula in Results_Diets[kcal_trend]. Because the case for this exploration is for the year 2000, only the following is activated:
IS the year in the current row less than 2015?
If the condition above is true, recall the value of the column in this table called “kcal_hist”
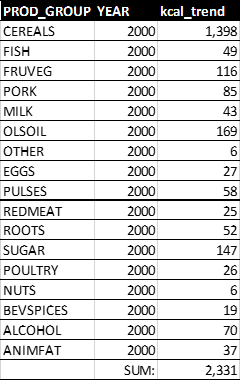
We can confirm that this is the case: