5.4 GHG (original) (raw)
Worksheet(s) in the FABLE Calculator:
⇒ GHG
⇒ 8_calc_emissions
⇒ 8_data_emissions
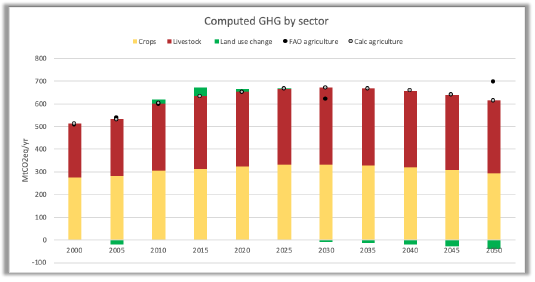
In the GHG worksheet of the Calculator, GHG emissions are expressed in MtCO2e per year per 5- year time-step (Figure 16). GHG emissions are grouped into four categories: emissions from crops, emissions from livestock, net emissions from land-use change, and GHG savings from biofuels replacing fossil fuel. Total emissions from the year 2000 cannot be directly compared with the other timesteps as it does not include emissions from land-use change. Historical emissions from agriculture (crops and livestock) and projected emissions from agriculture according to FAOSTAT are also displayed for comparison. Historical emissions from land-use change according to FAOSTAT are not displayed as they are not directly comparable with emissions from land-use change computed in the Calculator.
Figure 16. GHG emissions from agriculture and land use change
5.4.1 GHG from crops
There are three sources of emissions related to crop cultivation in the FABLE Calculator: methane emissions from rice cultivation, nitrogen emissions from synthetic fertilizers, and emissions related to energy use in crop fields. Emission factors are computed based on, or taken directly from, FAOSTAT for the year 2010. For rice cultivation, the emission factor is country specific and is expressed in tCO2e per hectare of harvested rice. Total emissions are computed as the total harvested rice area (cf. Crops and Feasible production) times the emission factor per hectare. For emissions from fertilizer use, without detailed data on fertilizer use per crop, we compute the emission factor as total emissions from fertilizer use divided by total harvested area (i.e. the same emission factor per hectare for all the crops). Finally, the emission factor for energy use for crops is also not specific by crop because of the lack of more detailed information on the energy use by crop in the FAOSTAT database. We have three emission factors for energy: one for methane emissions, one for nitrogen emissions, and one for carbon emissions, but all are expressed in tCO2e per hectare of harvested area.
5.4.2 GHG from livestock
There are two sources of emissions related to livestock production in the FABLE Calculator: methane emissions from ruminant enteric fermentation and methane and nitrogen emissions from manure. Emission factors per TLU per animal and production system come from the Herrero et al. (2013) database which has been calibrated on FAOSTAT for the year 2000. Total emissions are computed by multiplying the emission factor by TLU with the total herd in 1,000 TLU per animal type and production system (cf. Herd and Feasible production).
5.4.3 GHG from land
There are two sources of carbon sequestration and three sources of emissions from land use and land-use change in the FABLE Calculator: carbon sequestration in afforested land and in abandoned agricultural land, emissions due to the expansion of cropland, pasture, and urban areas into forests and other natural land. There is also an optional feature for computing emissions from peatland drainage. Emissions from land-use change are computed based on the land-use change matrix of each time-step as the number of hectares of forest and other natural land which have been converted to cropland, to pasture, and to urban areas, multiplied by the emission factor which depends on the land-cover class which is converted and the land cover class which expands. Land-use change emission factors are computed as the difference between the carbon stock per hectare in the initial land cover and the carbon stock per hectare of the land cover class at the end of the period. In the FABLE Calculator, emissions from land-use change include conversion of forests and other natural land to cropland, pasture, and urban area. The FAOSTAT database only provides carbon stock of forest land. Carbon stock in other natural land is assumed to be 30% of the forest carbon stock, carbon stock in pastureland 10% of forest carbon stock, and cropland 5%. Carbon stock in urban areas is assumed to be null. These are very rough assumptions, and each user is strongly encouraged to replace these assumptions by statistics on average carbon stock by land-cover class based on domestic biomass measurements. Carbon sequestration in afforested land is computed as the cumulative afforested land since 2000 and the sequestration rate is computed as the initial forest carbon stock divided by 50. This is also a rough assumption which implies linear growth of biomass and a 50-year period to reconstitute forest biomass. Carbon sequestration in abandoned agricultural land is assumed to be passive (i.e. without human action), which is why we assume a slower rate of carbon sequestration than on afforested land as we compute the annual sequestration rate by dividing the forest carbon stock by 80 instead of 50 for afforested land. Sequestration through passive regeneration is computed as the cumulative abandoned cropland and pasture times the sequestration rate.
5.4.4 GHG savings from biofuels
Based on the selected biofuel scenario, defining for each time step the amount of any possible commodity to be used as biofuel feedstock, GHG emissions savings due to biofuel replacing fossil fuels are calculated. Annual savings are calculated per feedstock, taking into account the conversion efficiency of each feedstock into biofuel, the biofuel energy density, and the CO2 savings per energy unit of fossil fuel and added up for the total annual saving.