5.5 Biodiversity (original) (raw)
Worksheet(s) in the FABLE Calculator:
⇒ BIODIVERSITY
⇒ 4_calc_land
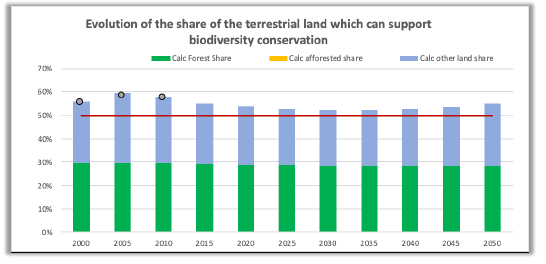
5.5.1 Land which could support biodiversity conservation
The first indicator related to biodiversity is the share of the total land which could support biodiversity conservation (Figure 17). This indicator is the proportion of total land which is covered by forest, nonagricultural, and non-urban land areas to the country or region’s total land area. It includes new forest as well as land converted from other uses. By default, the target is set at 50% share of total land area.
Figure 17. Share of total land which could support biodiversity conservation
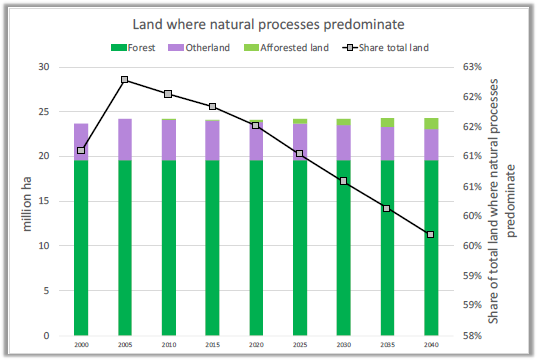
5.5.2 Land where natural processes predominate
The other indicator related to biodiversity is the share of the total land where natural processes predominate (Figure 18). The term is taken from Jacobson et al. (2019) who describe low-impact areas as “areas where natural processes predominate, but are not necessarily places with intact natural vegetation, ecosystem processes, or faunal assemblages”. There are many different spatial datasets that can be used as indicators of areas where natural processes predominate to monitor progress towards this target. By-default, we use a combination of key biodiversity areas (BirdLife International, 2019), intact forest landscapes (Potapov et al., 2008), and Low Impact Areas (Jacobson et al., 2019). Starting from the historical area where natural processes predominate, we remove the converted area of natural land (forest or other natural land) times the historical share of area where natural processes predominate per land cover type, times 80%, assuming that the first 20% of the conversion would occur in non-intact area.
Figure 18. Share of total land where natural processes predominate
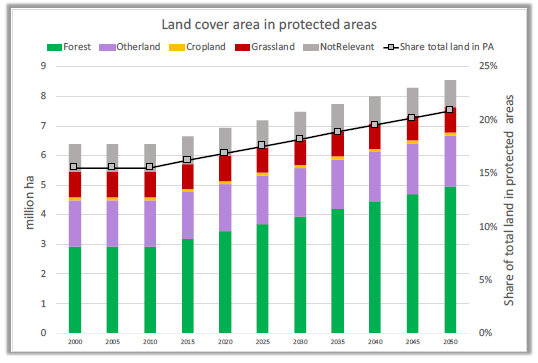
5.5.3 Protected areas
Finally, we compute the share of the total land in protected areas by 2050. For each unique ecoregion in a country, a specific share of protected land is targeted and implemented. Summing over the resulting protected areas gives the total protected area and the share of total protected land. The annual values per time step are broken down by land type (Figure 19).
Figure 19. Evolution of the land within protected areas