5.6 Water (original) (raw)
Worksheet(s) in the FABLE Calculator:
⇒ WATER
⇒ 9_calc_water
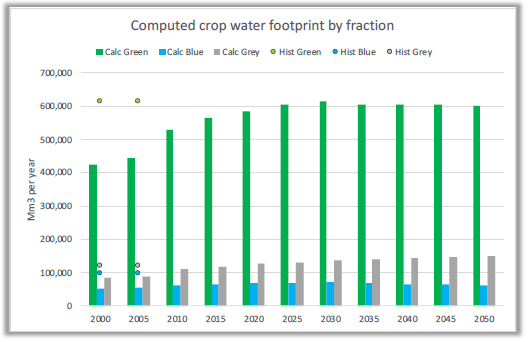
In the Water sheet of the FABLE Calculator, the total blue, green, and grey water use for domestic agricultural production is computed and compared to historical values, given in Mm³ per year per five-year time step (Figure 20). The calculations are based on water-use data per product tonne from Mekonnen and Hoekstra (2010a, 2010b, 2011). Blue water refers to surface and groundwater, green water to rainwater if it hasn’t become runoff. These two footprints describe water consumption instead of withdrawal. Consumed water is lost in the catchment area as it is incorporated in the product or evaporates to another catchment area. Water withdrawal, on the other hand, describes the total amount of water withdrawn from a source, including consumed water as well as withdrawals that are later returned to the source. Grey water refers to freshwater necessary to reduce pollution concentration to natural background levels.
The final overall water footprint for livestock products is calculated per five-year time step by summing over the feasible production quantity times the respective water fraction per tonne. Similarly, for crops, green and grey water use are calculated directly from the feasible production quantity times the respective footprint data. The blue-water footprint for some crops (cf. Climate change) can also be affected by the climate change scenario.
In the FABLE Calculator, the crop footprint and the livestock footprint should not be added to compute the total water footprint of the production in a country! This would lead to a problem of double-counting since the livestock product footprint includes the footprint from crops used for animal feed and this is by far the most important aspect of the water footprint for livestock (Mekonnen and Hoekstra, 2010b). Consequently, only the crop footprint is taken into account in the domestic water footprint of agricultural production. Further work is required to split the different components of the livestock water footprint in the Calculator to be able to compute the full water use from domestic agricultural production, including on pastureland.
Figure 20. Evolution of water footprint for crops
Estimated blue and green water footprints from Mekonnen and Hoekstra rely on the CROPWAT 8.0 model that includes daily soil water balance, crop water requirements, actual crop water use, and actual yields on global scale in 5 by 5 arc minute spatial resolution in rainfed and irrigated systems for 20 crops. To estimate actual crop water use, actual evapotranspiration is calculated, depending on climate parameters, soil water availability, and crop characteristics, where the latter depend on crop growth. Actual yield is estimated in response to computed water stress. Grey water is quantified considering nitrogen run offs and the difference between maximum acceptable concentration and the natural concentration (Mekonnen and Hoekstra, 2010a).
For animal products, Mekonnen and Hoekstra (2010b) consider water consumption for feed, animal drinking, and service water (water used for cleaning the animal and its environment). These footprints depend on the animal, the country of production and the farm system (grazing, industrial, mixed). When calculating the water footprint of feed, they use the national average footprints of the crop products described above, considering import shares from different countries, and combine those with a feed-mixing water footprint. Feed conversion efficiencies and feed concentrate shares are estimated based largely on FAOSTAT data and other sources. Finally, for each country and animal product a weighted average between the farming systems is calculated to get national average blue, green, and grey water footprints.