GitHub Discussions · Developer Collaboration & Communication Tool (original) (raw)
GitHub Discussions
The home for developer communities
Ask questions, share ideas, and build connections with each other—all right next to your code. GitHub Discussions enables healthy and productive software collaboration.
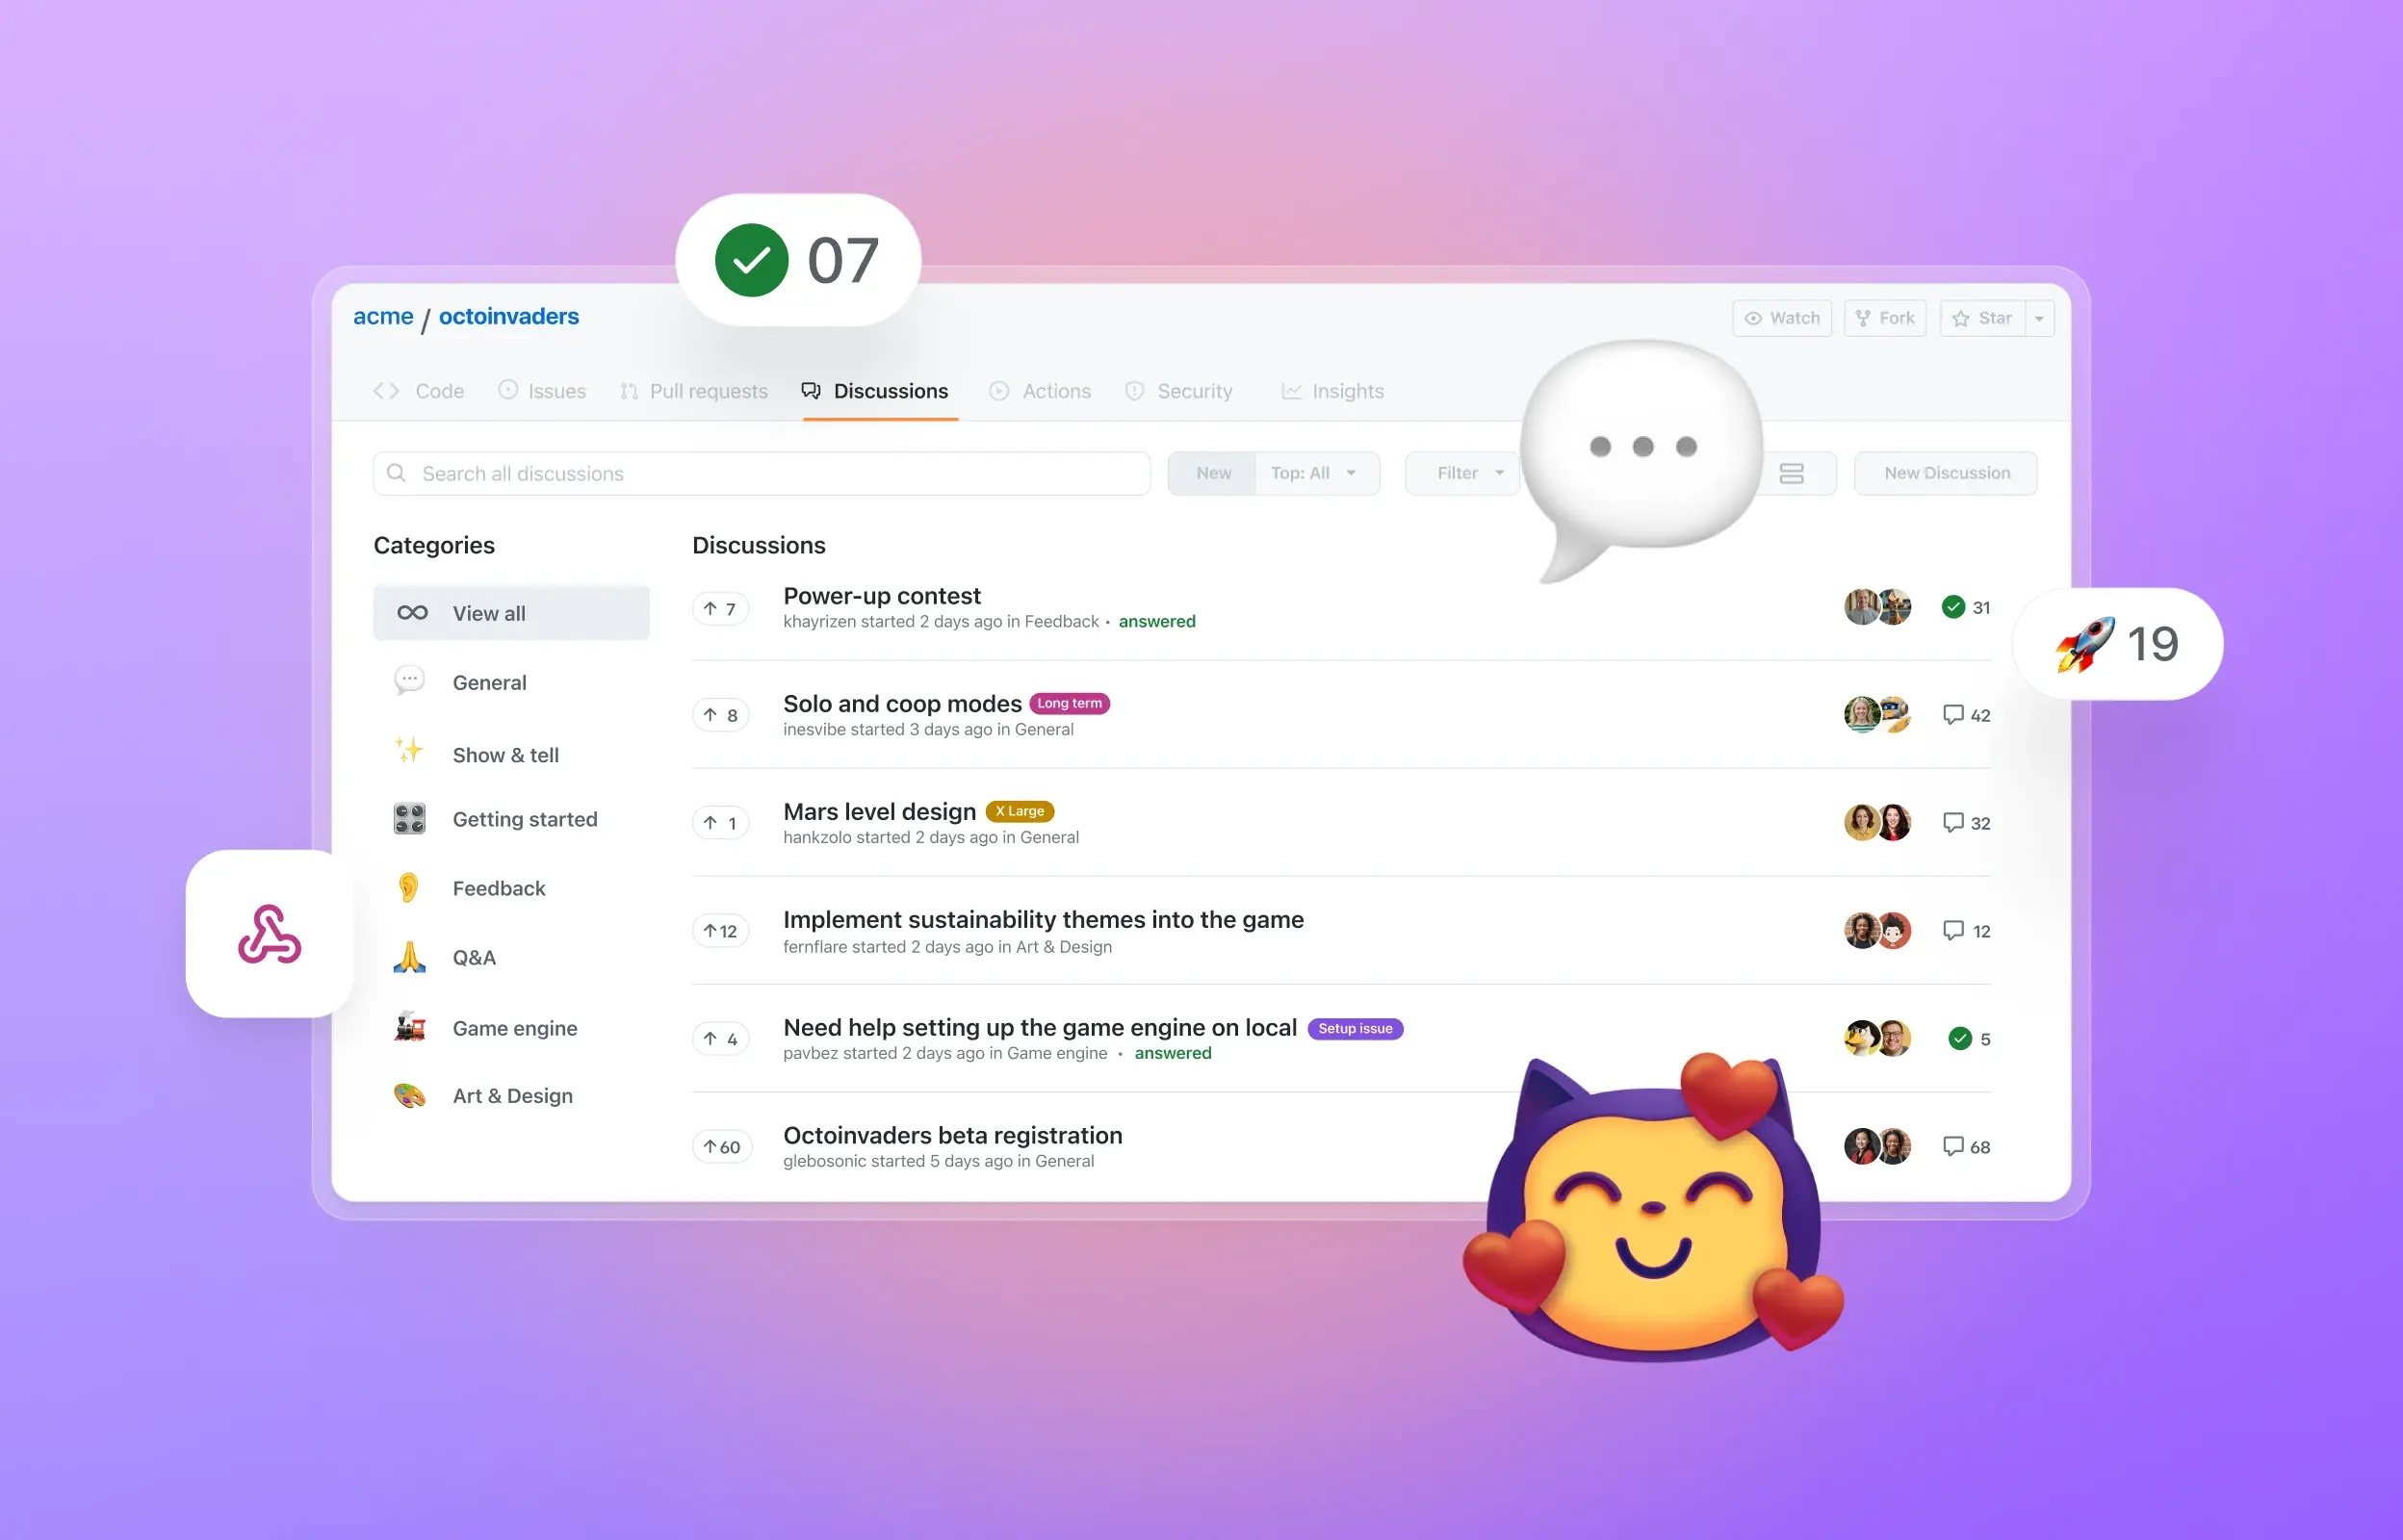
Dedicated space for conversations
Decrease the burden of managing active work in issues and pull requests by providing a separate space to host ongoing discussions, questions, and ideas.
Highlight quality responses and make the best answer more discoverable.
Keep context in-tact and conversations on track with threaded comments.
Ask your community directly with custom polls.
Leverage GraphQL API and webhooks to meet your teams wherever they are.
Give your open ended conversations the room they need outside of issues.
Personalize for your community and team with any ways to make your space unique for you and your collaborators.
Monitor insights
Track the health and growth of your community with a dashboard full of actionable data.
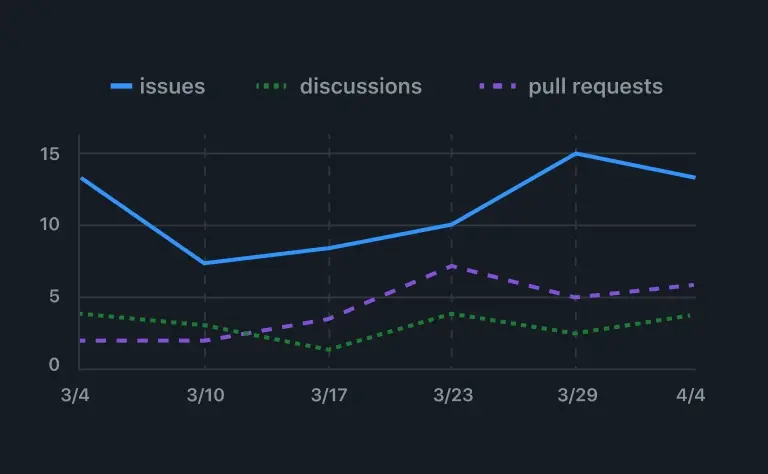
Contribution activity
Count of total contribution activity to Discussions, Issues, and PRs.
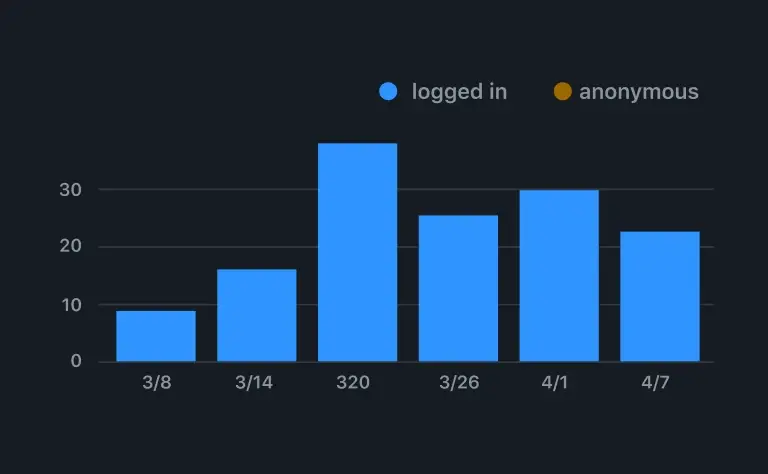
Discussion page view
Total page views to Discussions segmented by logged in vs anonymous users.
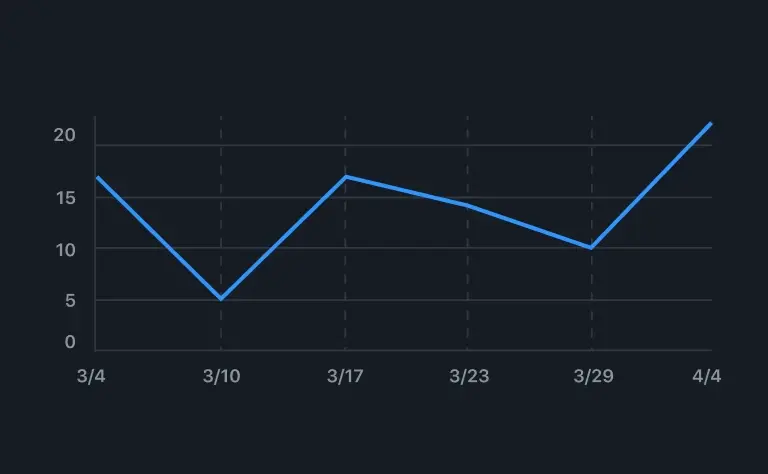
Discussions daily contributors
Count of unique users who have reacted, upvoted, marked an answer, commented, or posted in the selected period.